How to change the default AJAX timeout in Jira server
Platform notice: Server and Data Center only. This article only applies to Atlassian products on the Server and Data Center platforms.
Support for Server* products ended on February 15th 2024. If you are running a Server product, you can visit the Atlassian Server end of support announcement to review your migration options.
*Except Fisheye and Crucible
Problem
Sometimes an underlying performance problem will prevent the AJAX calls that JIRA uses from completing within the normal timeout of 30 seconds.
In some cases, this problem will appear as a timeout error message in the UI. In others, the browser developer tools will show a request that is canceled or has no HTTP response code.

Temporarily increasing the AJAX timeout used by JIRA can be helpful to reduce the severity of a problem while working on the complete solution.
Environment
- 8.20.x or above
Diagnosis
Scenario 1
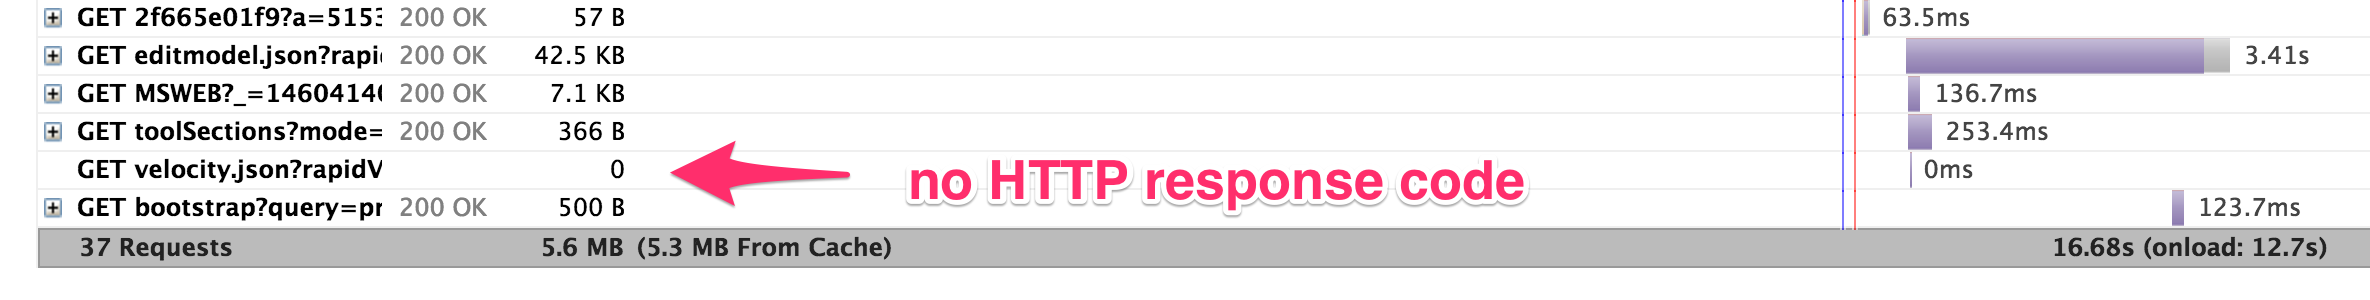
If you are not seeing a timeout error message in the UI you can confirm the problem using your browser's developer tools. For this document, we will provide detailed steps for Chrome.
These instructions are adapted from Generating HAR files and Analysing Web Requests.
- Open up Chrome and display the Developer Tools.
- Select the Network tab.
- Load the page with the problem and repeat the steps that trigger the issue.
In the Network tab, look for any requests that do not have an HTTP response code:
If you are reporting this issue to Atlassian Support, right click inside the Network tab area and select Save as HAR with content then attach the HAR file to your support ticket.
Scenario 2
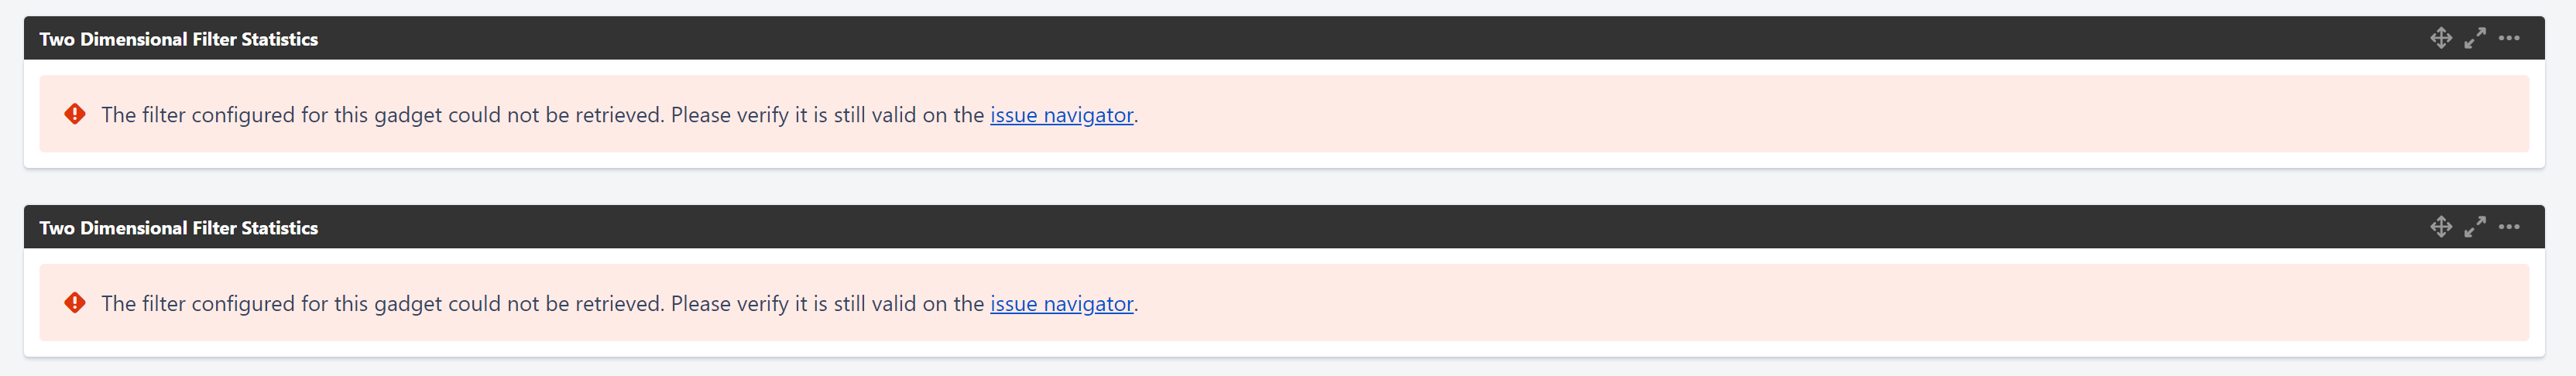
Some Jira dashboard gadgets getting timeout:
- Open the gadget filter to check if it's using a complex JQL query.
Check the HAR file, you can see the filter request timeout after 60 seconds with the HTTP response code:
Request Method:GET

Status Code:net::ERR_ABORTED

Remote Address::80
Cause
- JIRA has a default AJAX timeout period so that requests in the browser do not run for unlimited amounts of time. Normally 30 seconds is plenty of time for a typical data request.
- AJAX timeouts can be caused by many different things. Once you know the URL that is timing out this will suggest what types of operations are slow: JQL query, database query, the network itself, etc.
- Some Jira dashboard gadget timeout when using nested filters that take a longer time to load. For example, you have such JQL query was used by the gadget filter: project = TEST and xxx and filter in/not in (filter1,filter2,filter3)
Workaround
Temporarily increase the global AJAX timeout so that users can continue working (albeit more slowly) while you troubleshoot the underlying problem.
![]() If you are experiencing AJAX timeouts the underlying problem must be addressed as quickly as possible because it could become worse and may indicate that a crash is looming.
If you are experiencing AJAX timeouts the underlying problem must be addressed as quickly as possible because it could become worse and may indicate that a crash is looming.
- Create an Announcement Banner from Administration > System > User Interface > Announcement Banner. This will not be visible, it will be used to add JavaScript to every page in JIRA.
Add this HTML+JavaScript code as the banner contents:
<script type="module">
AJS.$.ajaxSetup({
	timeout: 60000 // Milliseconds, 60 seconds in this example.
});
</script>
For scenario 2, you may want to increase more than 60 seconds. For example, set timeout value to timeout: 120000
- For "Visiblity Level" select "Private" (logged-in users only).
- Save the banner.
After you make this change confirm that the timeout no longer occurs. If it is you may need to increase the timeout further. Set it to 0 to wait forever.
Resolution
Scenario 1: resolving the cause of the AJAX timeout will depend on what URL is timing out and what problems are affecting your JIRA installation. Please see Troubleshooting Performance Problems.
Scenario 2: Identify the problematic filter that contributes to the slowness the most. In the gadget filter, you can clone the filter out and test it on your own dashboard gadget and try to remove each of the filter to see which filter is causing the issue. Remove muti-nested filters and use a pure JQL query. For more information about how to optimise the complex JQL query, please see Factors contributing to JQL performance in Jira server