Create a cohort analysis chart
Platform Notice: Cloud Only - This article only applies to Atlassian products on the cloud platform.
Summary
A cohort is a group of users sharing a particular characteristic. Strictly speaking, it can be any characteristic, but typically the term cohort refers to a time-dependent grouping. A cohort analysis looks at related groups (i.e., cohorts) and their behavior for a specific metric over a defined period of time. In this example, we’ll show you how to create a cohort analysis table chart in Atlassian Analytics using Jira data.
Solution
A cohort analysis chart example using Jira issue data
In this example using Jira issue data, our cohorts will be created based on the week that a Jira issue was created during the current quarter. We’ll then analyze these cohorts to determine the number of weeks it took to resolve issues based on the cohort that the issues belong to. Here are the steps used to create this example cohort analysis in Atlassian Analytics:
Select Create and then select Chart from the global navigation bar to start making your cohort analysis table.
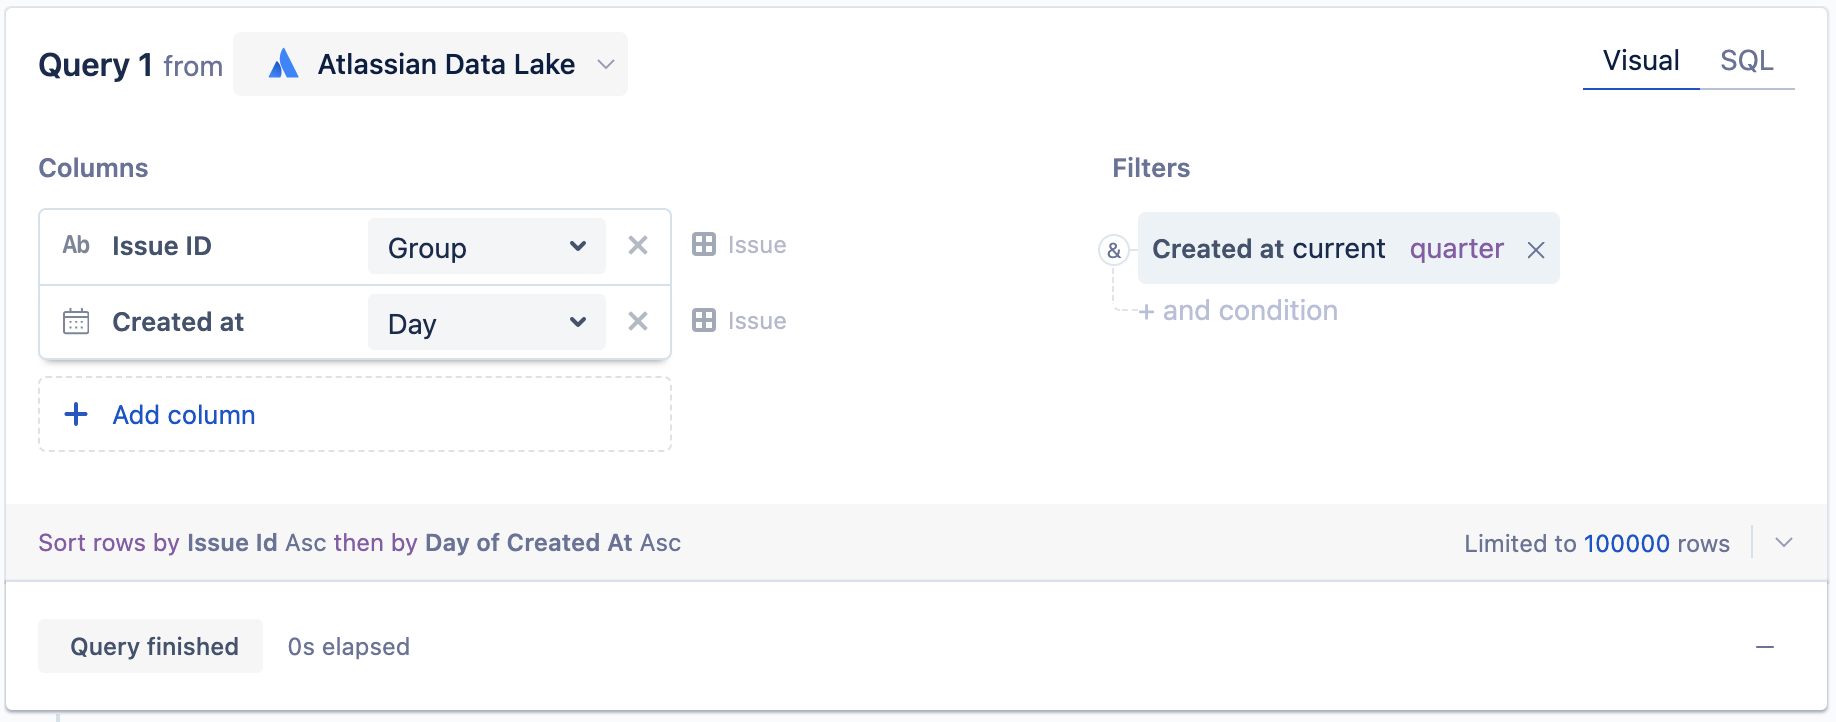
For the first query, use an Atlassian Data Lake data source to pull the creation dates of each Jira issue created in the current quarter.
Add the Issue ID and Created At columns from the Issuetable to the visual mode query and use the following aggregations for each column:
Issue ID: Group
Created At: Day
To reduce the number of rows returned, we also added Created At from the Issuetable to the filters section to only look at issues created in the current quarter.
Select Run query.
You may need to increase the row limit to the maximum limit of 100,000 rows if the default row limit of 1000 is reached.
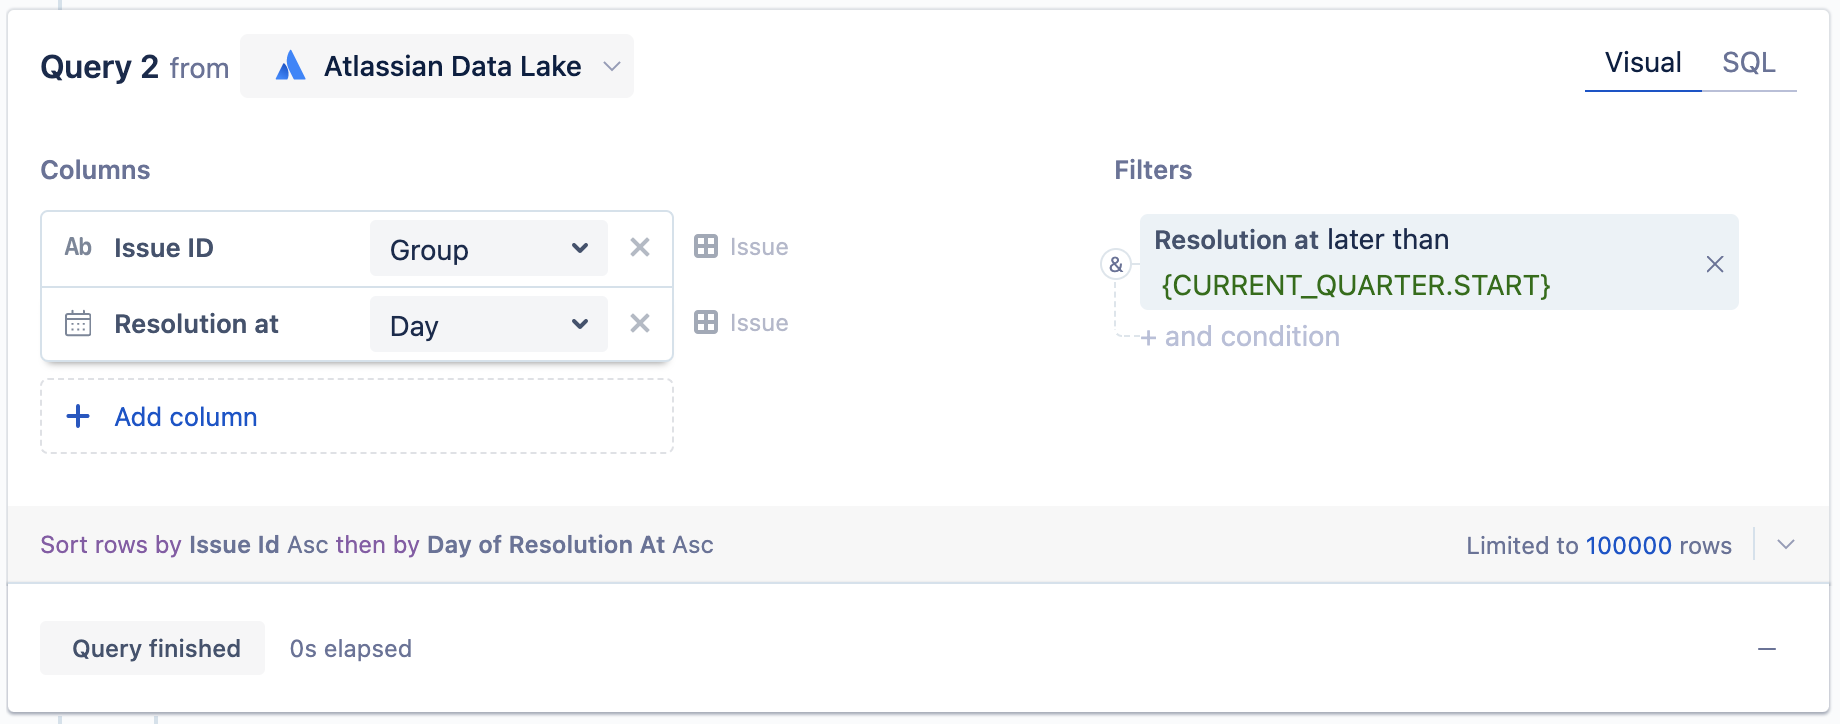
Add another query, which will look at the data you’re trying to track. For this example, we want to see the dates that users performed an event, in this case, resolving an issue.
Add the Issue IDand Resolution Atcolumns from the Issue table to the second visual mode query. Use the following aggregations for each column:
Issue ID: Group
Resolution At: Day
If you filtered over a specific date range for Query 1, make sure to apply the same filter for Query 2 but using the date column from the event you’re looking to capture, in this example “Resolution At”. In our example, we made sure to only look at events created after the start of the current quarter. We leveraged our
{CURRENT_QUARTER.START}relative date variable to filter our data.Select Run query.
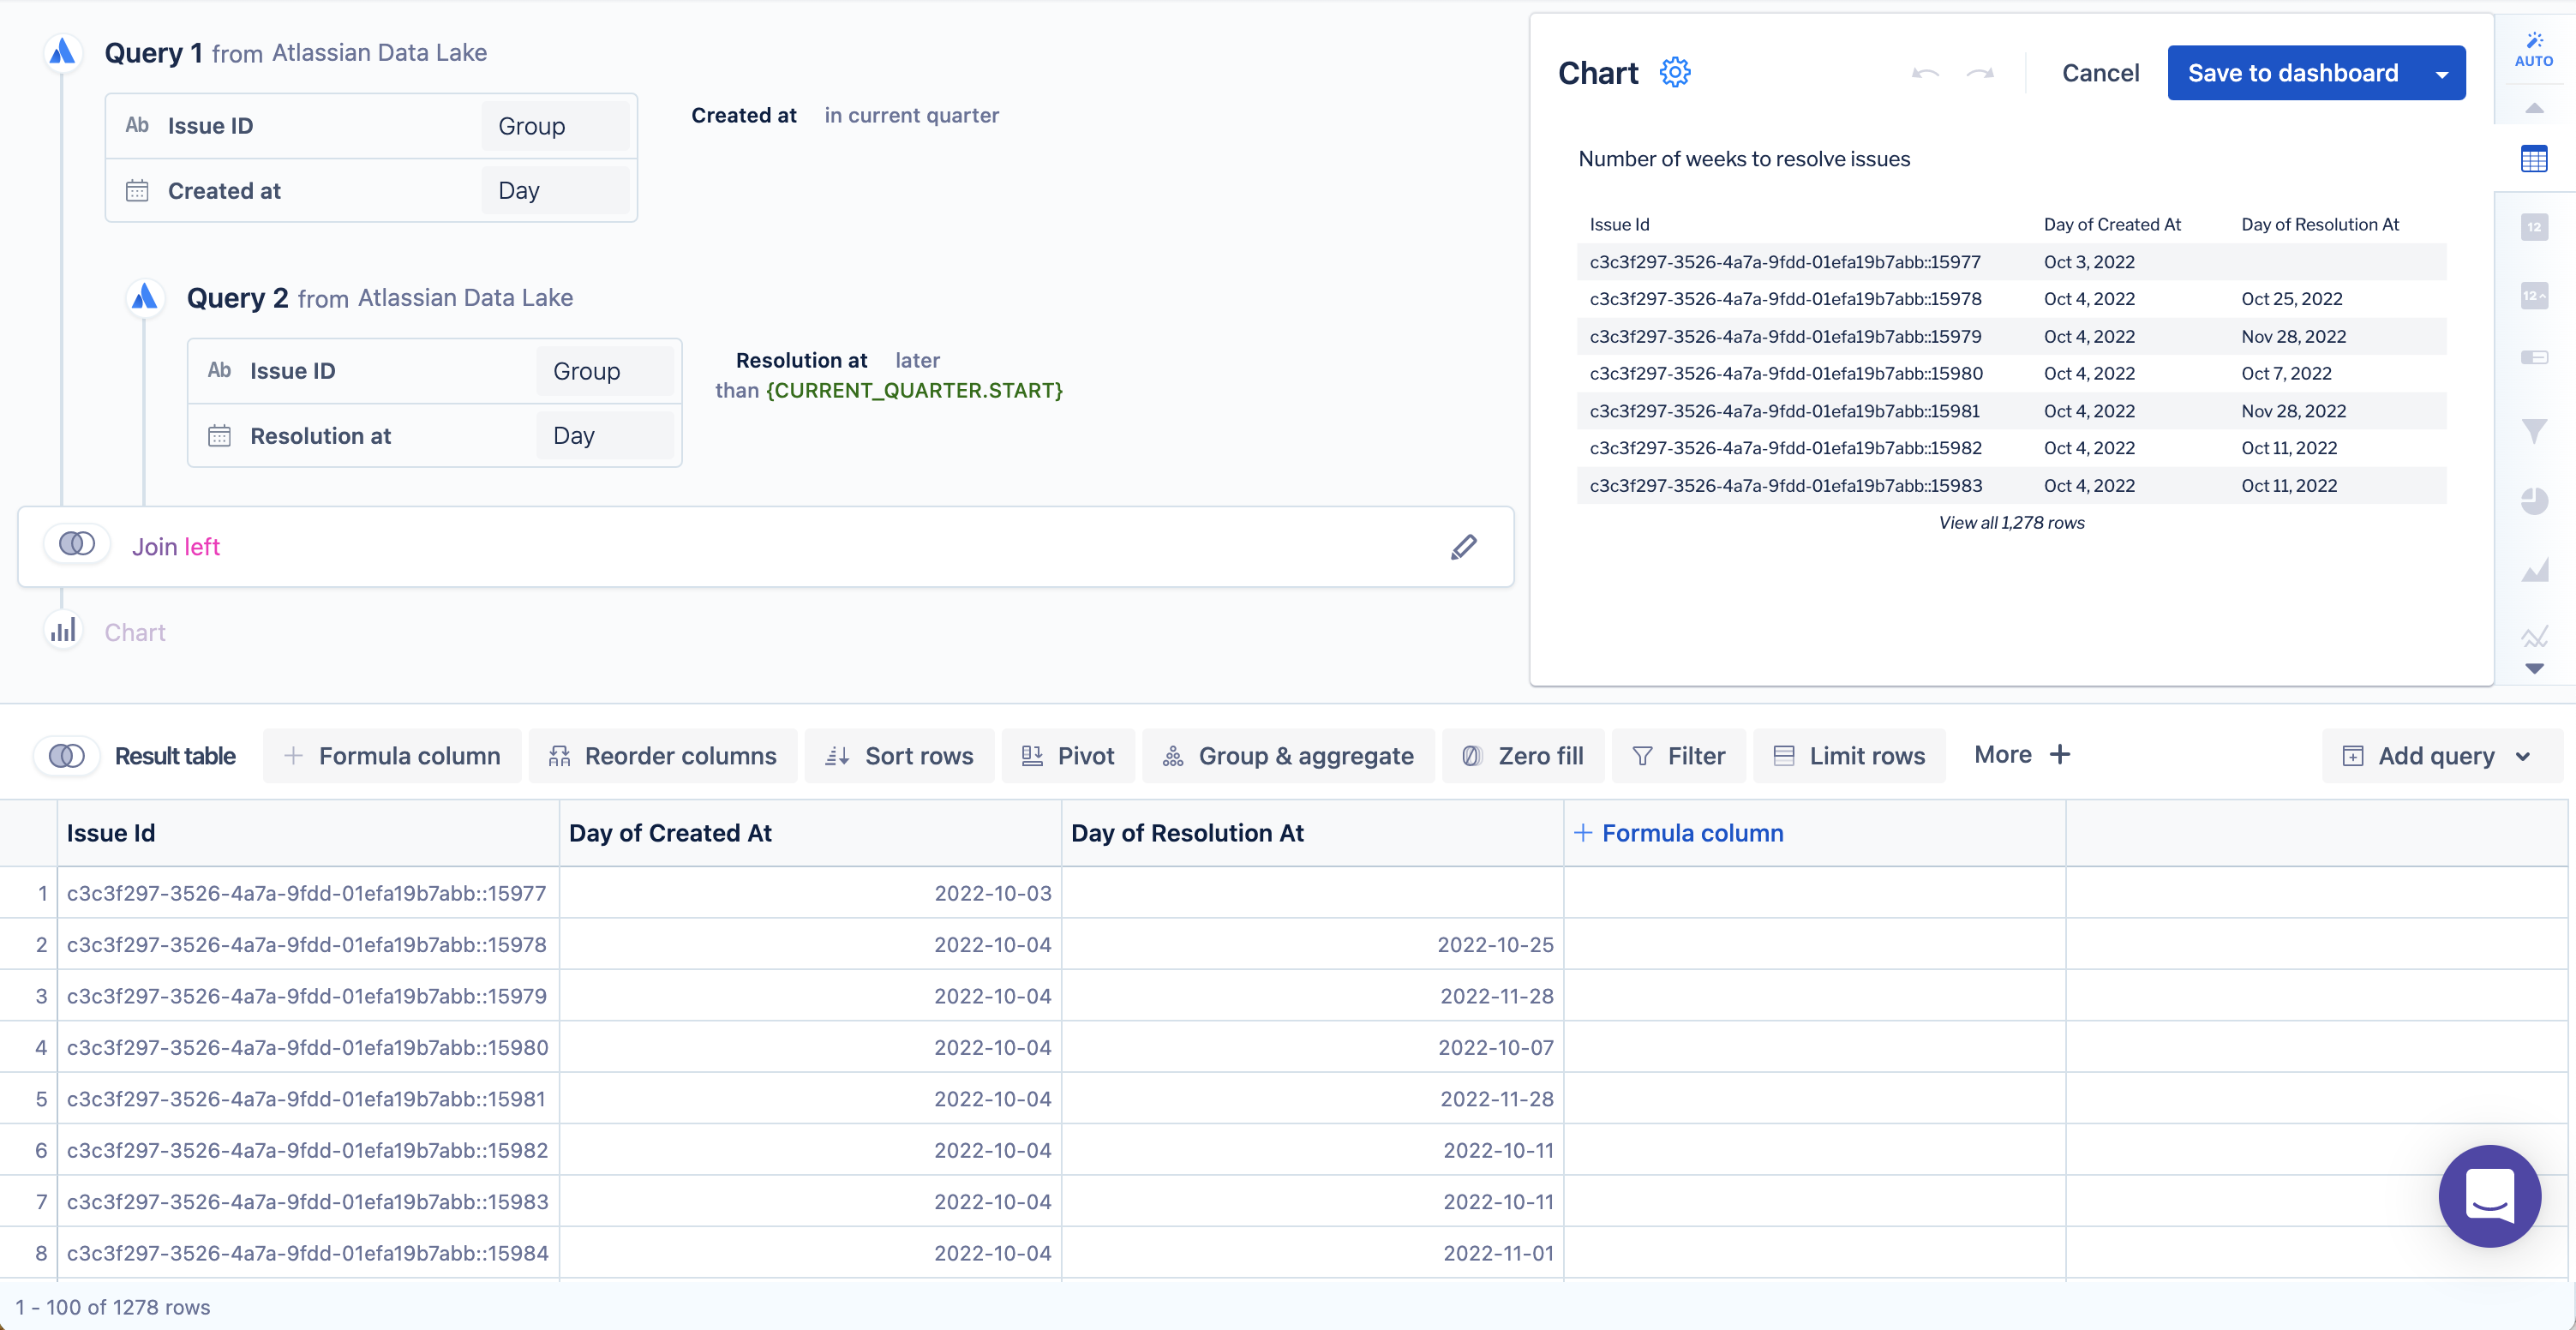
Edit the “Join” step and change the join type to Left on the first column so we only include rows pertaining to the issues created in the current quarter.
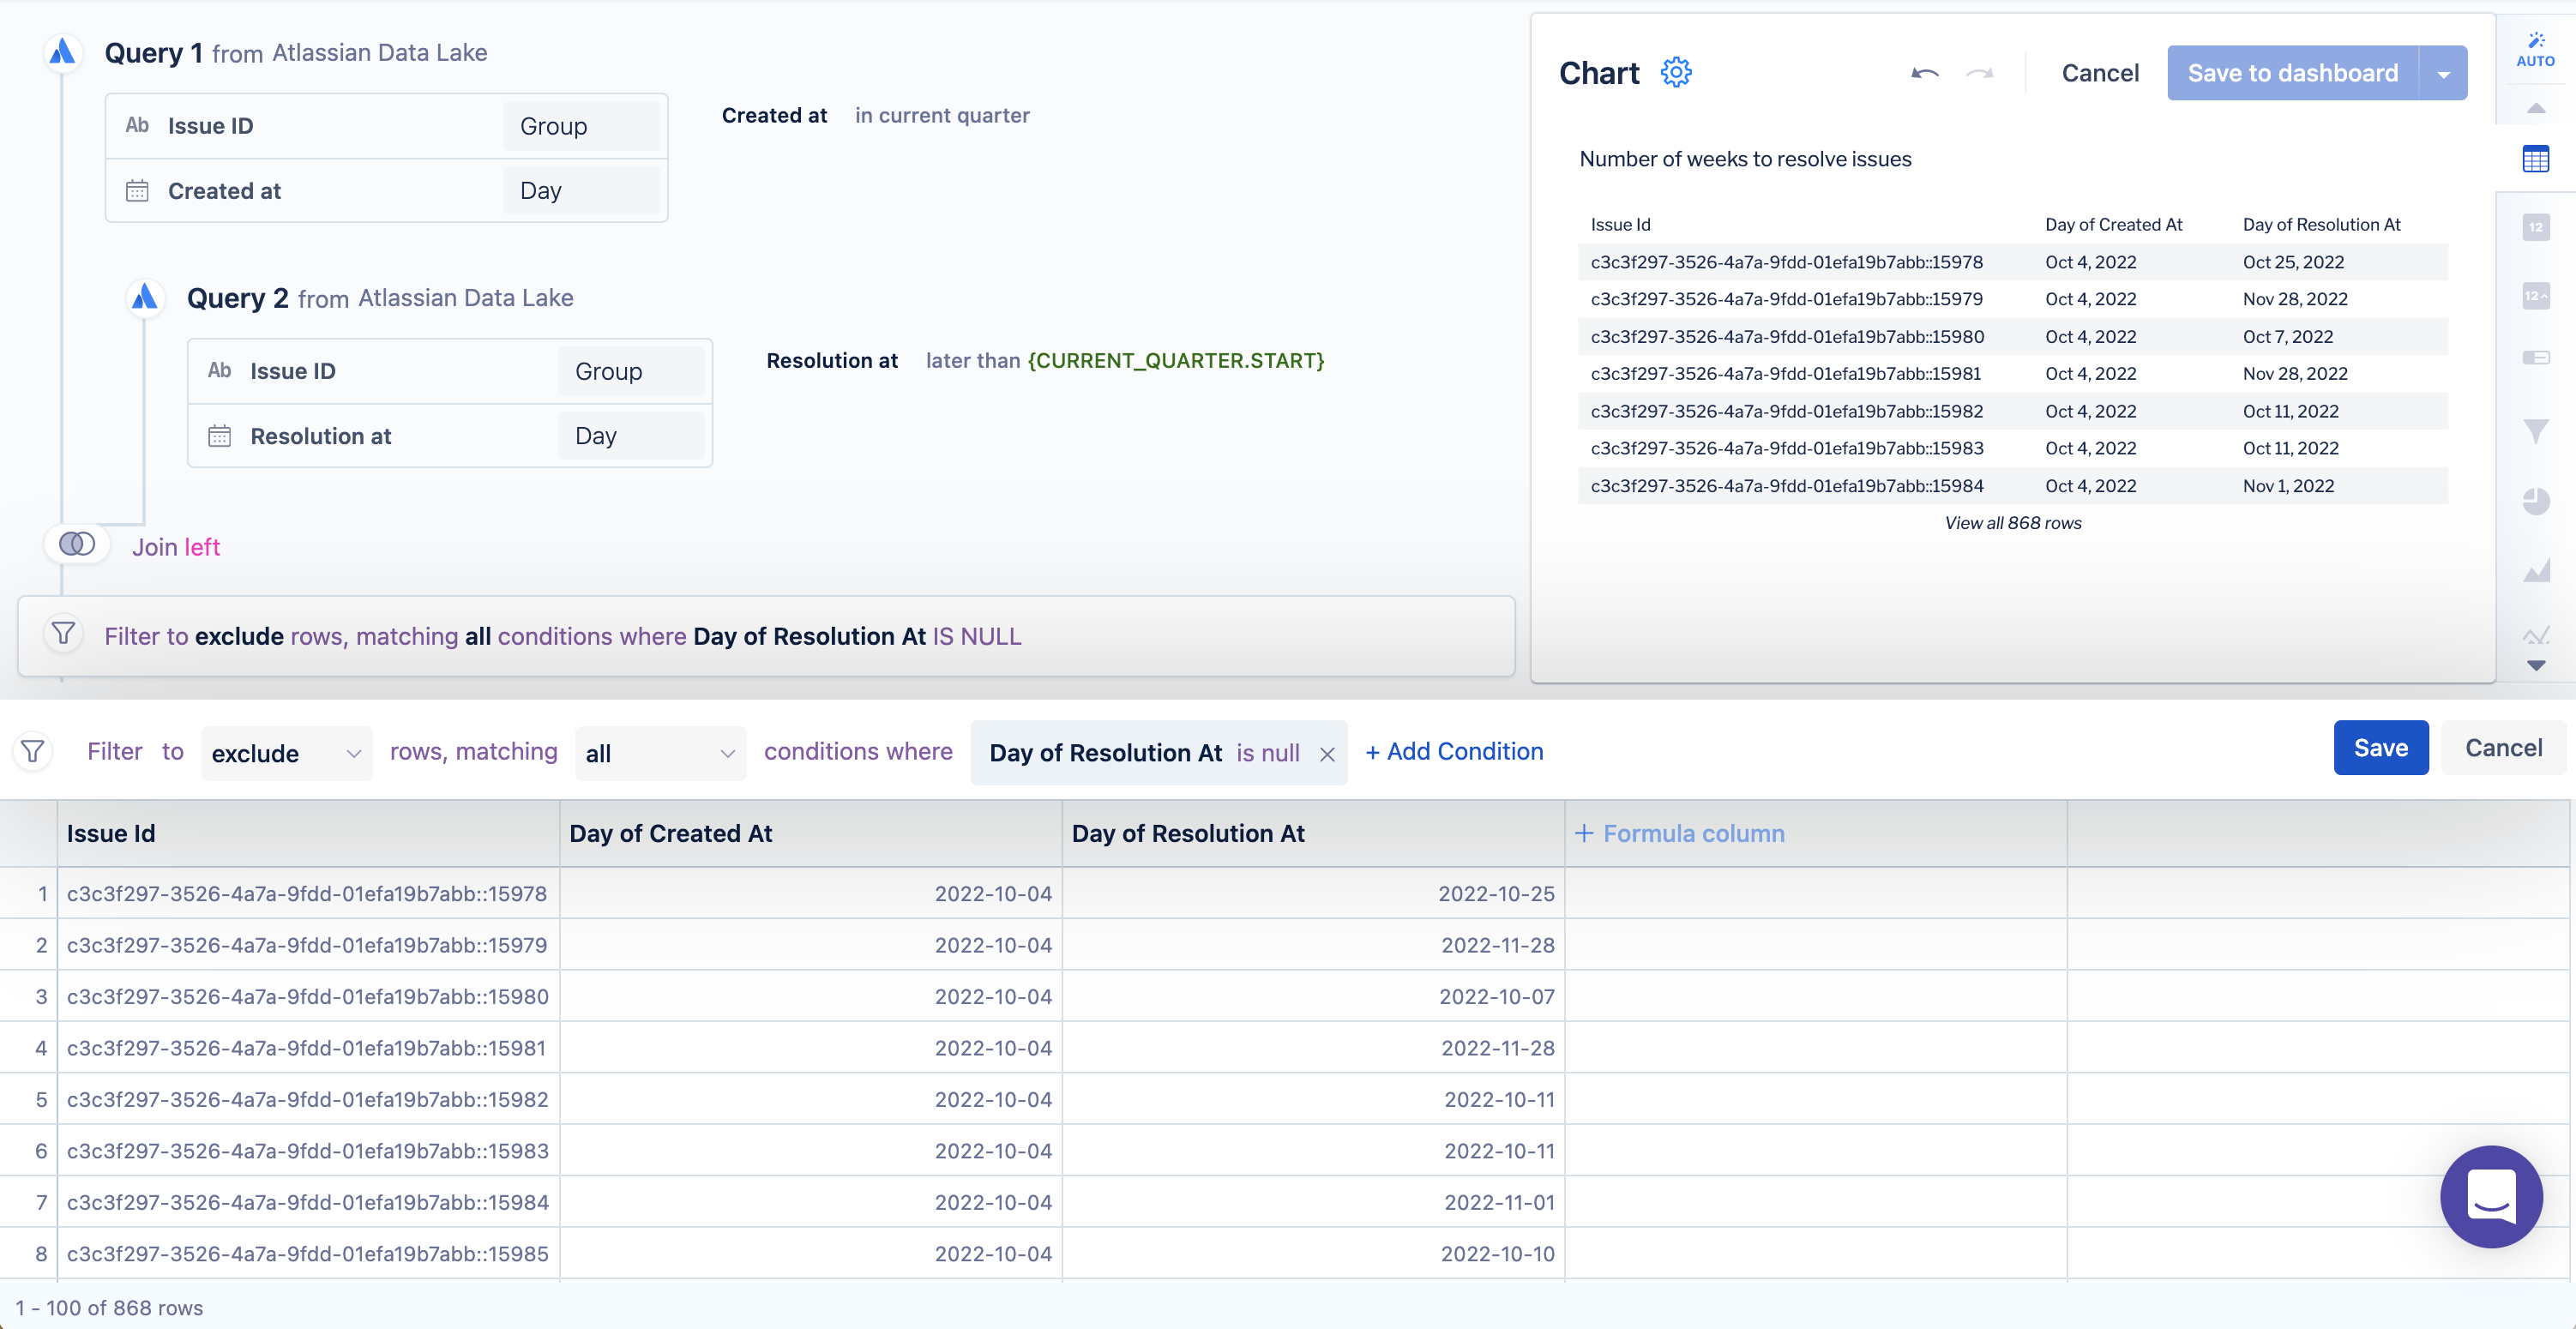
Since we're only looking to perform a cohort analysis for issues that were resolved, we now want to include a ”Filter” step to exclude all rows where “Day of Resolution At” is null.
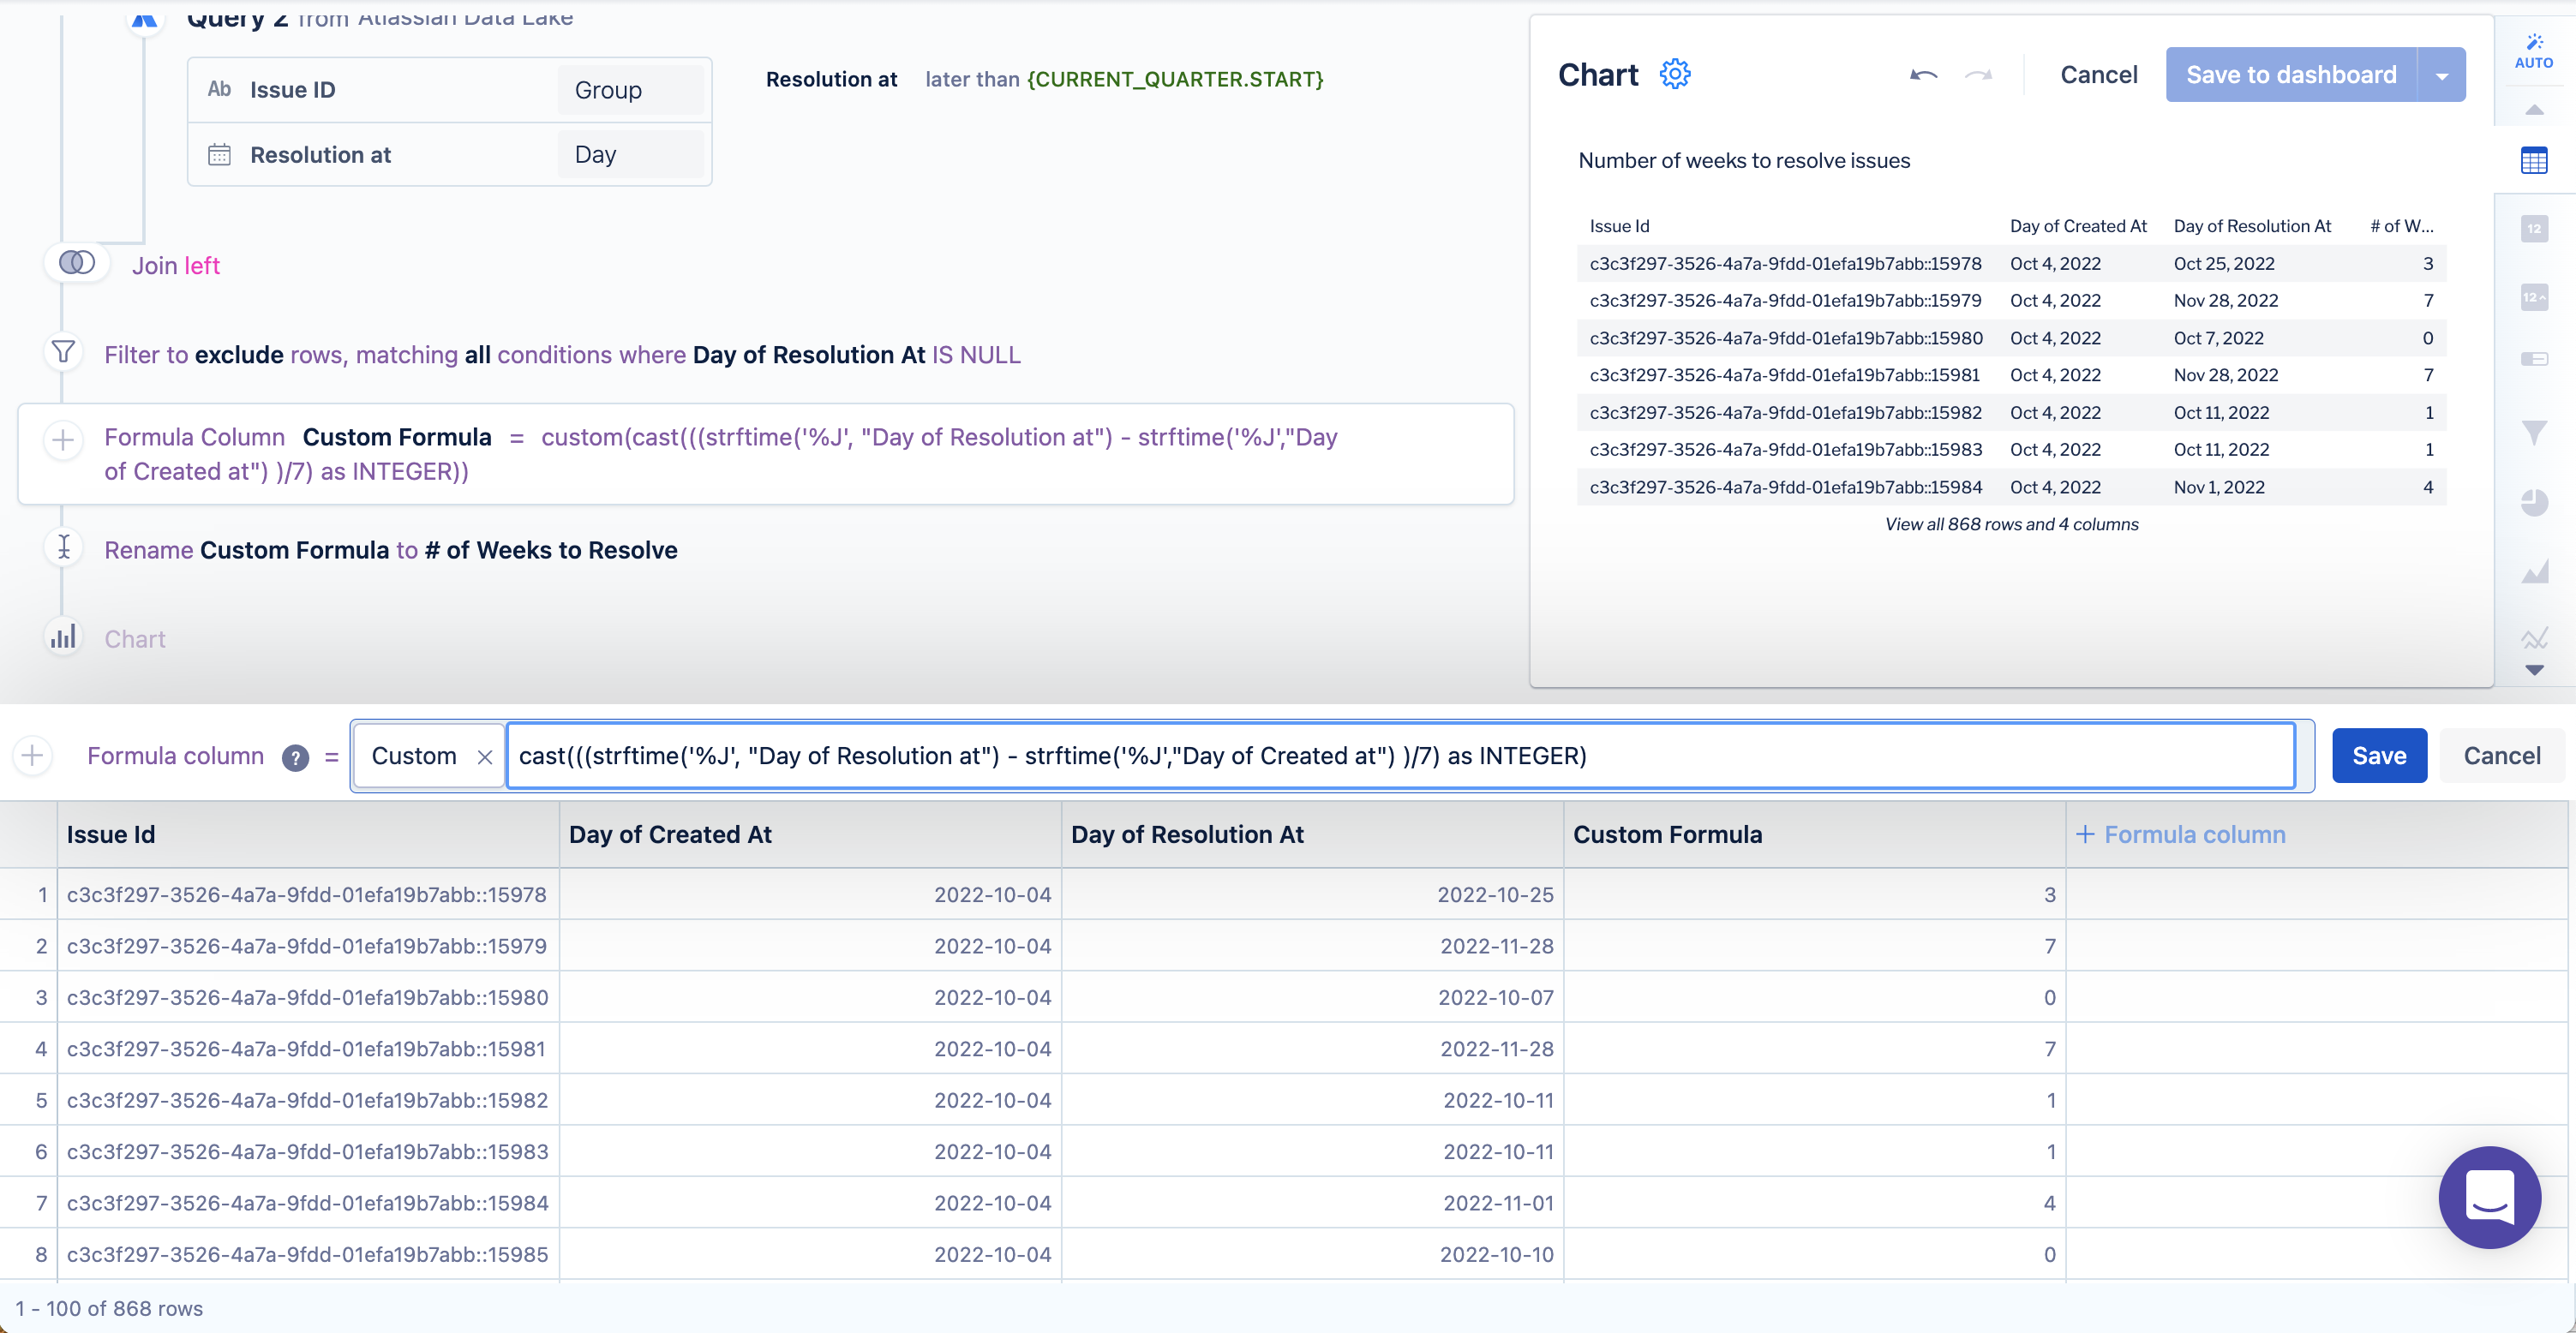
Next, create a new column that will store the number of weeks since issue creation that the event occurred. To do this, add a “Formula column” step, select Customas the formula type, then use the following formula:
1CAST(((STRFTIME('%J', "Day of Resolution at") - STRFTIME('%J',"Day of Created at") )/7) AS INTEGER)What is this formula doing? It’s taking the Julian day of the event minus the Julian day of the start date then dividing by 7 to get the number of weeks it took for the user to perform the activity since the start date.
For clarity, rename this custom formula to something such as “# of Weeks to Resolve”.
Now change the “Day of Created At” column to show the corresponding ISO week by using an “Apply formula” step on the “Day of Created At” column. Select Customas the formula type, and use the following formula:
1STRFTIME('%Y-W%W', "Day of Created at")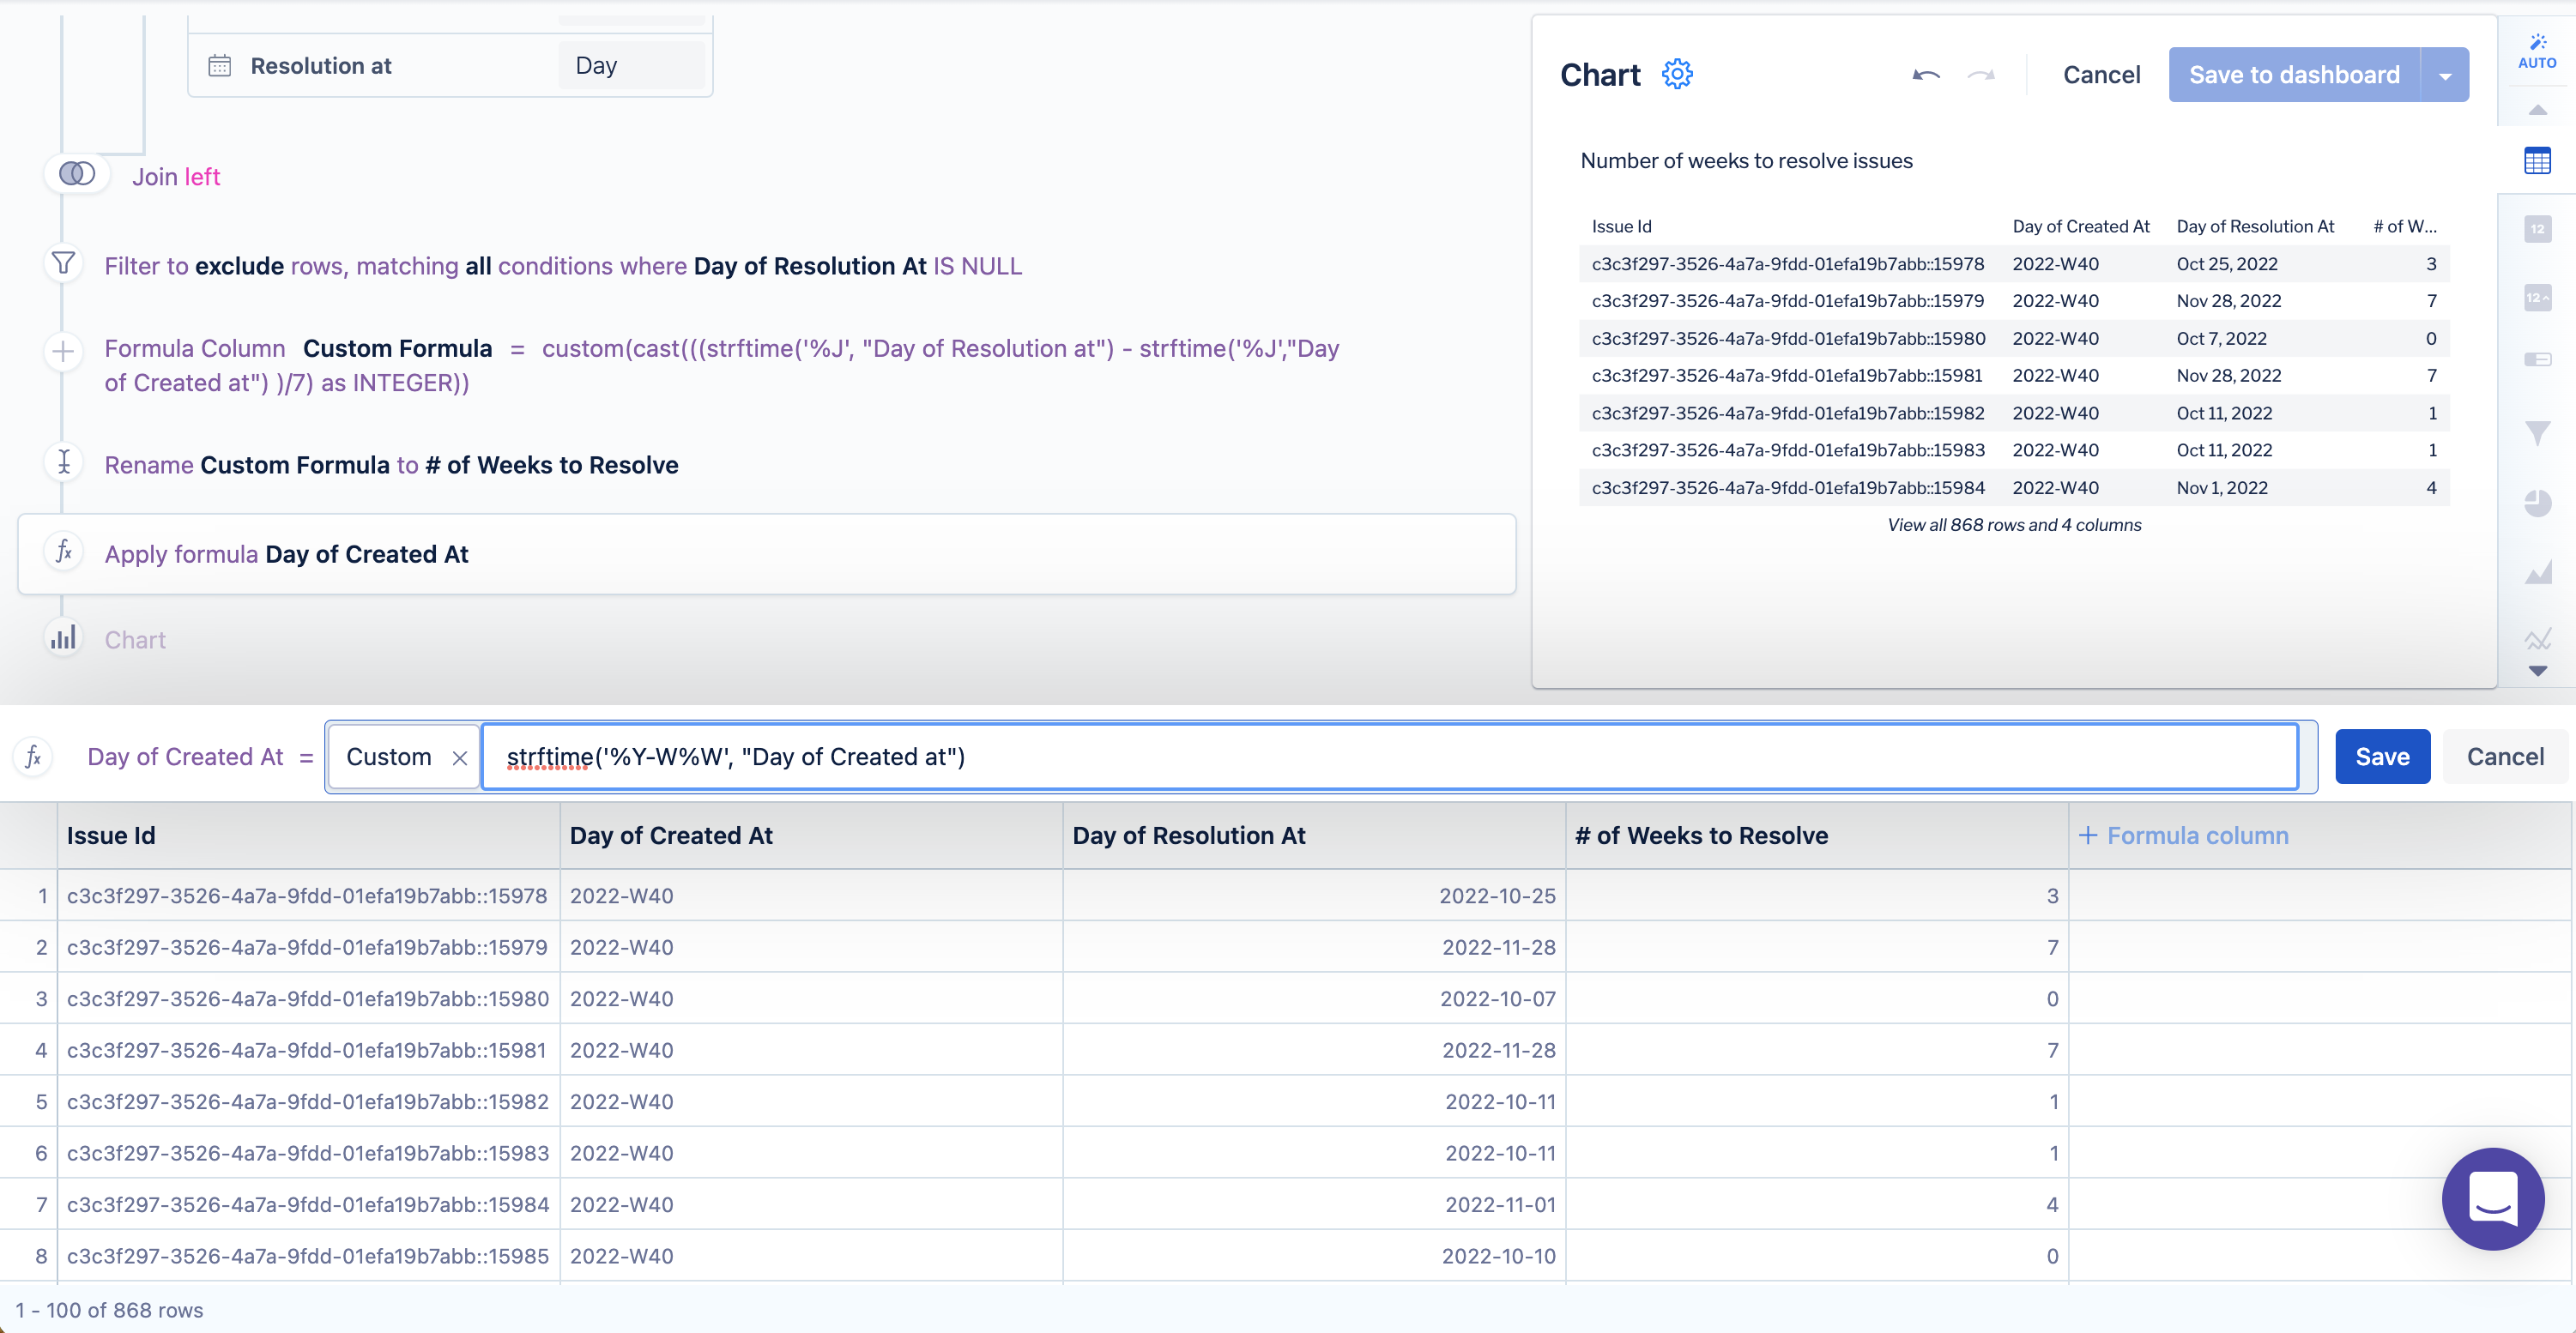
Since it’s no longer necessary, hide the “Day of Resolution At” column.
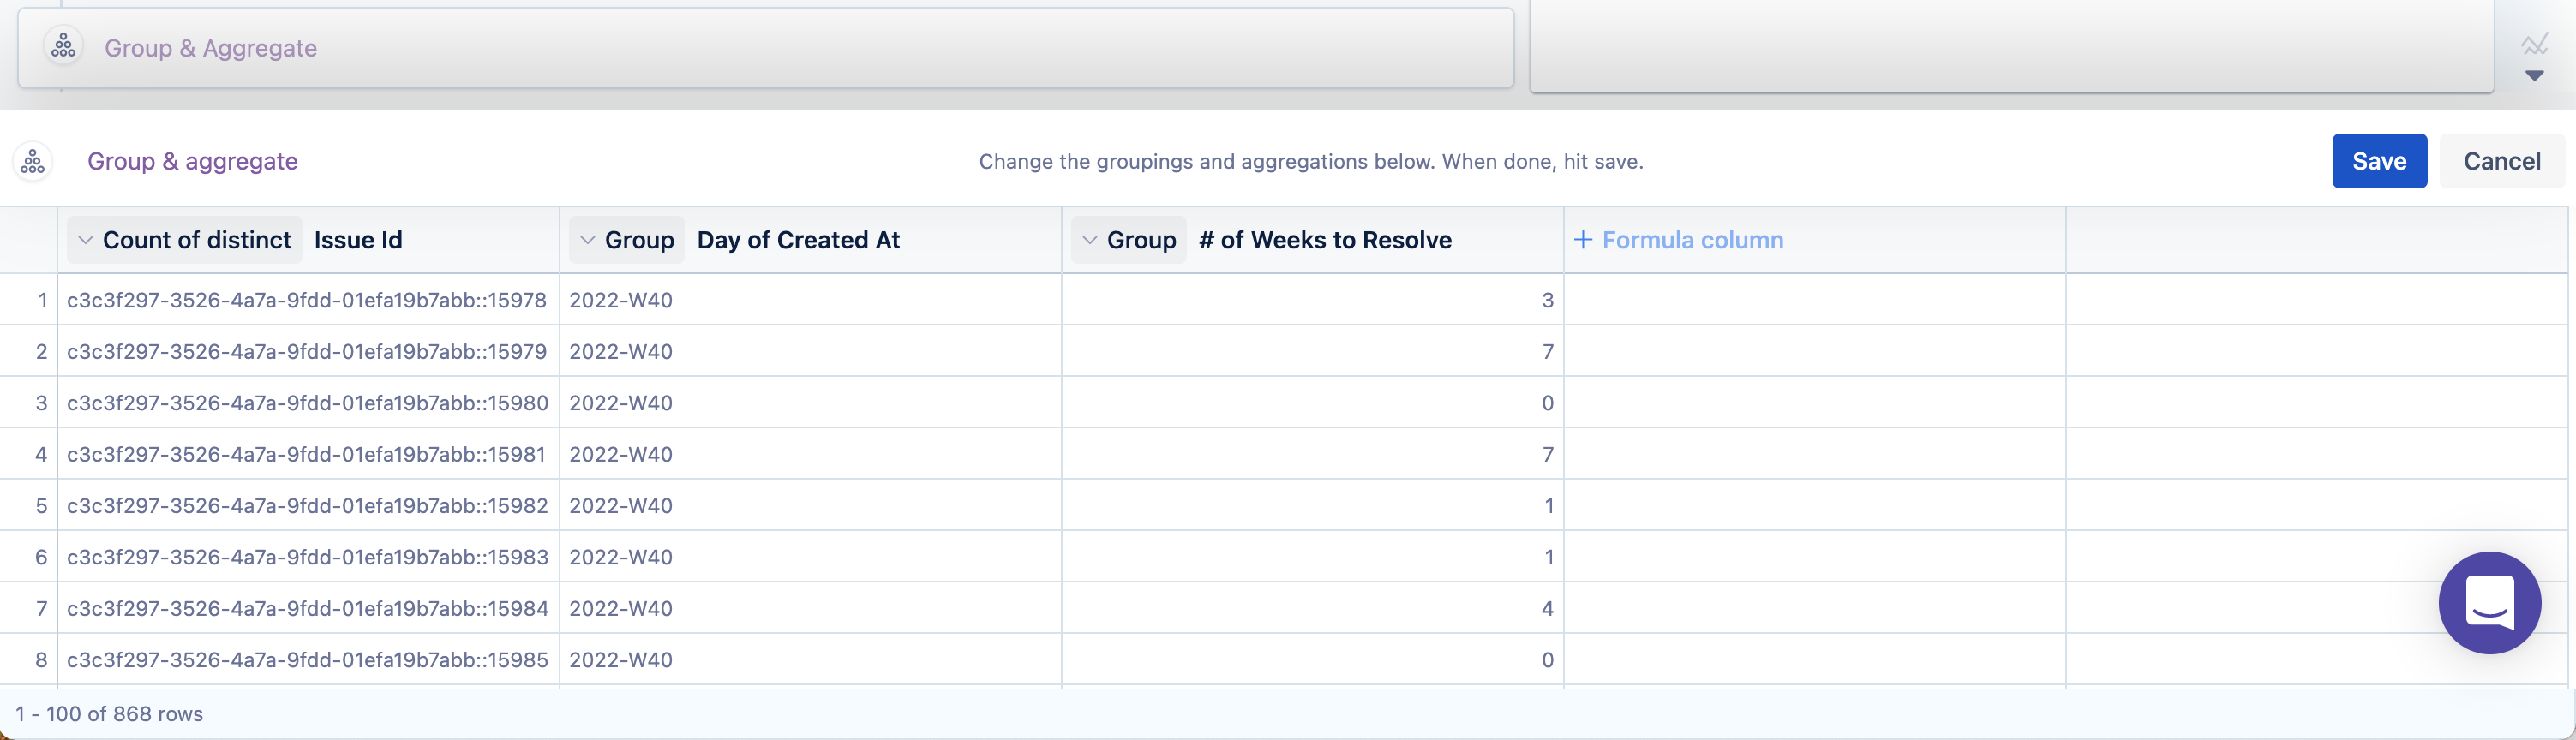
Use a “Group & aggregate” step to change the aggregations of each column in the result table:
Issue ID: Count of distinct
Day of Created At: Group
Week of Event: Group
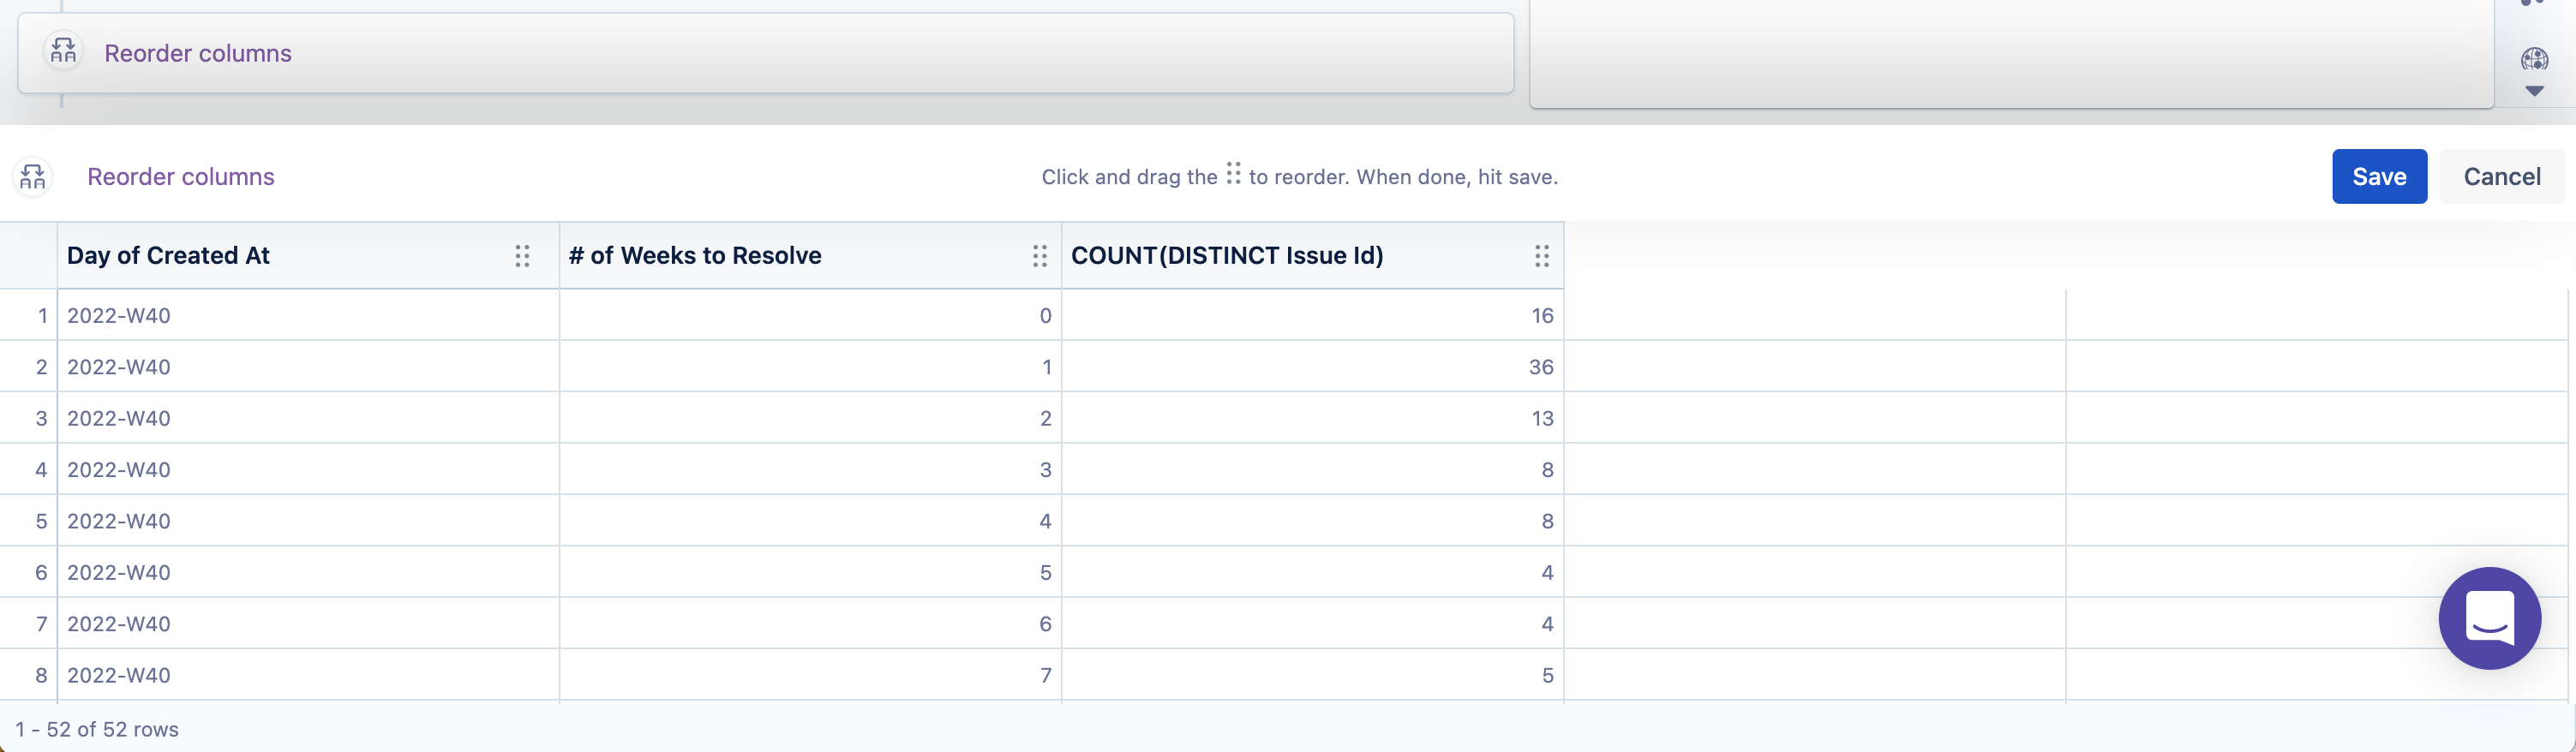
Reorder the columns in this order (left to right): “Day of Created At”, “# of Weeks to Resolve”, “COUNT(DISTINCT Issue Id)”.
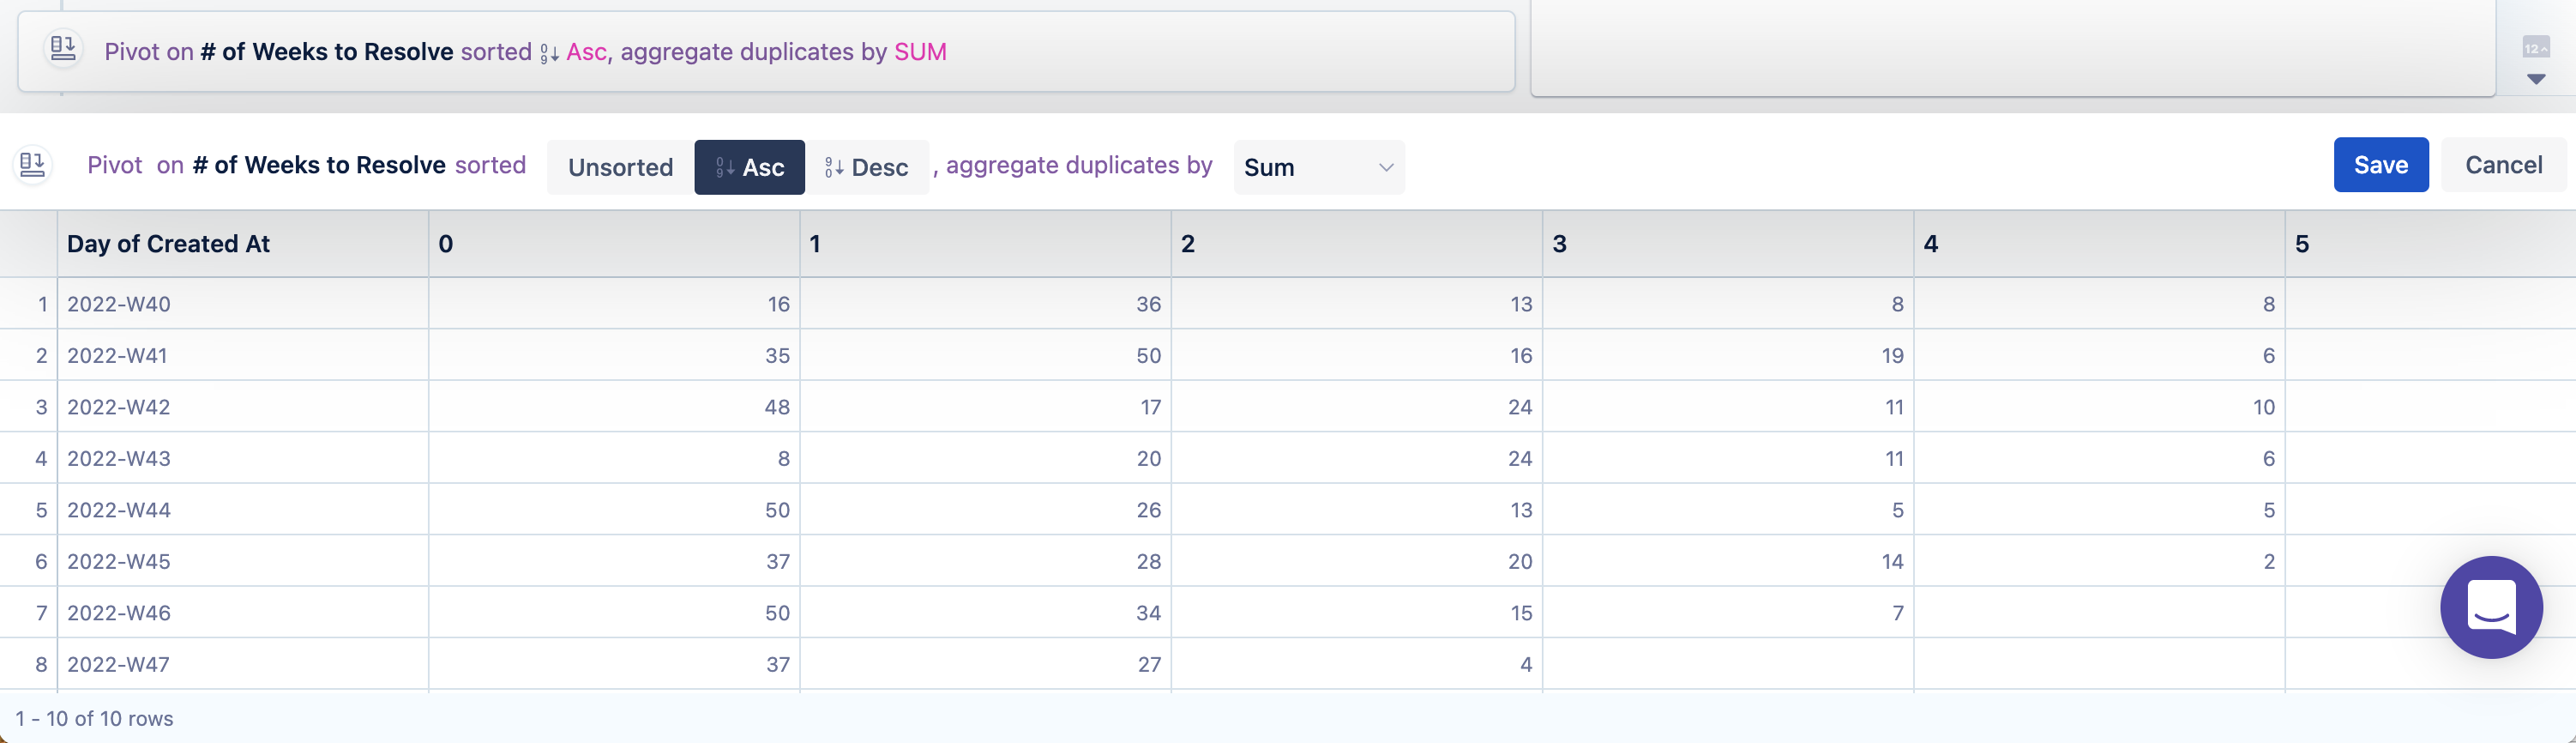
Use a “Pivot” step to turn the values in your “# of Weeks to Resolve” column into column headers and aggregate any duplicates by Sum.
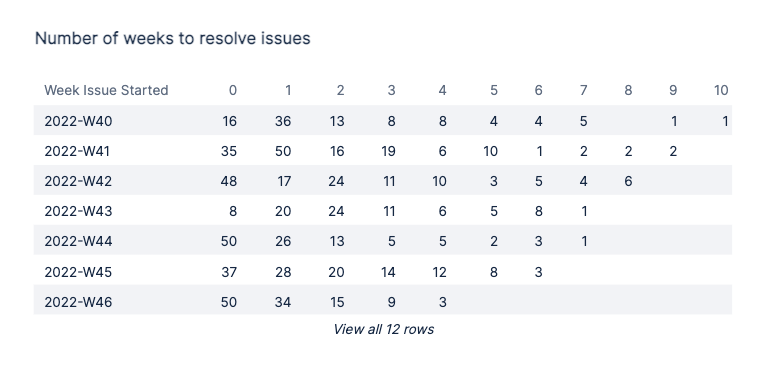
Lastly, rename the “Day of Created At” column to something such as “Week Issue Started” to be more accurate.
Select Table as the chart type and that’s it! You’ve got a cohort analysis where each row is a different cohort and each column indicates the number of Jira issues that took X amount of weeks to be resolved.
Was this helpful?