Querying issues in a sprint
Platform Notice: Cloud and Data Center - This article applies equally to both cloud and data center platforms.
Support for Server* products ended on February 15th 2024. If you are running a Server product, you can visit the Atlassian Server end of support announcement to review your migration options.
*Except Fisheye and Crucible
Summary
This article covers how to query your Jira sprint issues in Atlassian Analytics. The example queries below will be utilizing the “Issue sprint history” table within the Atlassian Data Lake. The “Issue sprint history” table tracks any changes in issue allocation associated with a sprint. If you’d like a further look at the data included in the table, please take a look at our documentation for the “Issue sprint history” table.
Solution
Querying issues added to or removed from a sprint
In this example, we’re going to create a chart calculating the number of issues added to a sprint titled ‘Product Sprint 1’. We’ll create a chart with the following steps:
1. Open up the chart editor by creating a new custom chart or editing an existing chart.
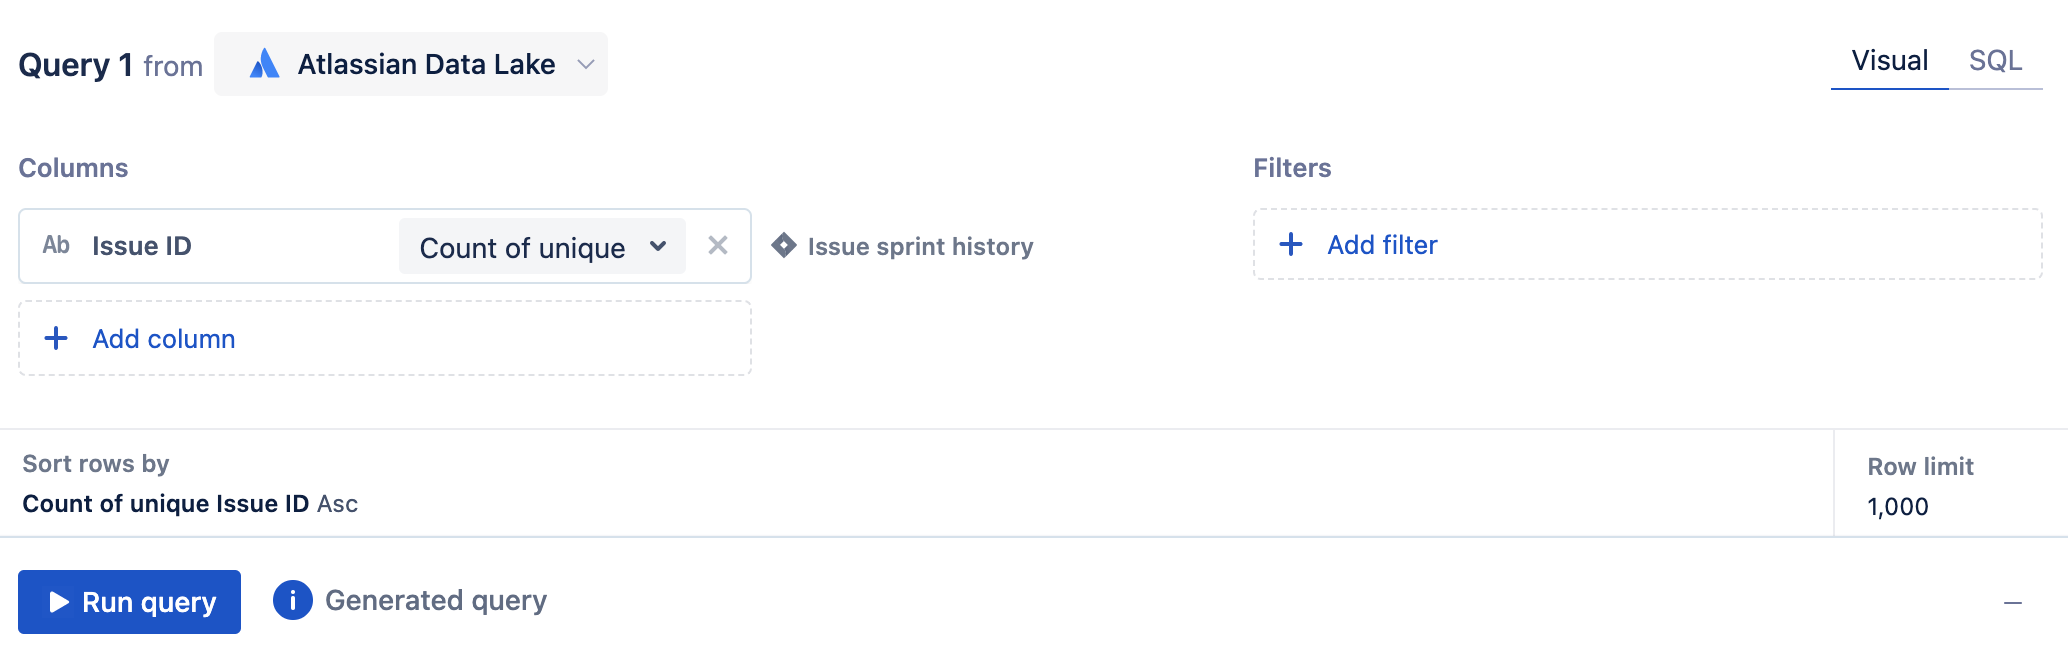
2. In visual mode, add the Issue ID column from the Issue sprint history table to the query and select Count of unique as the aggregation.
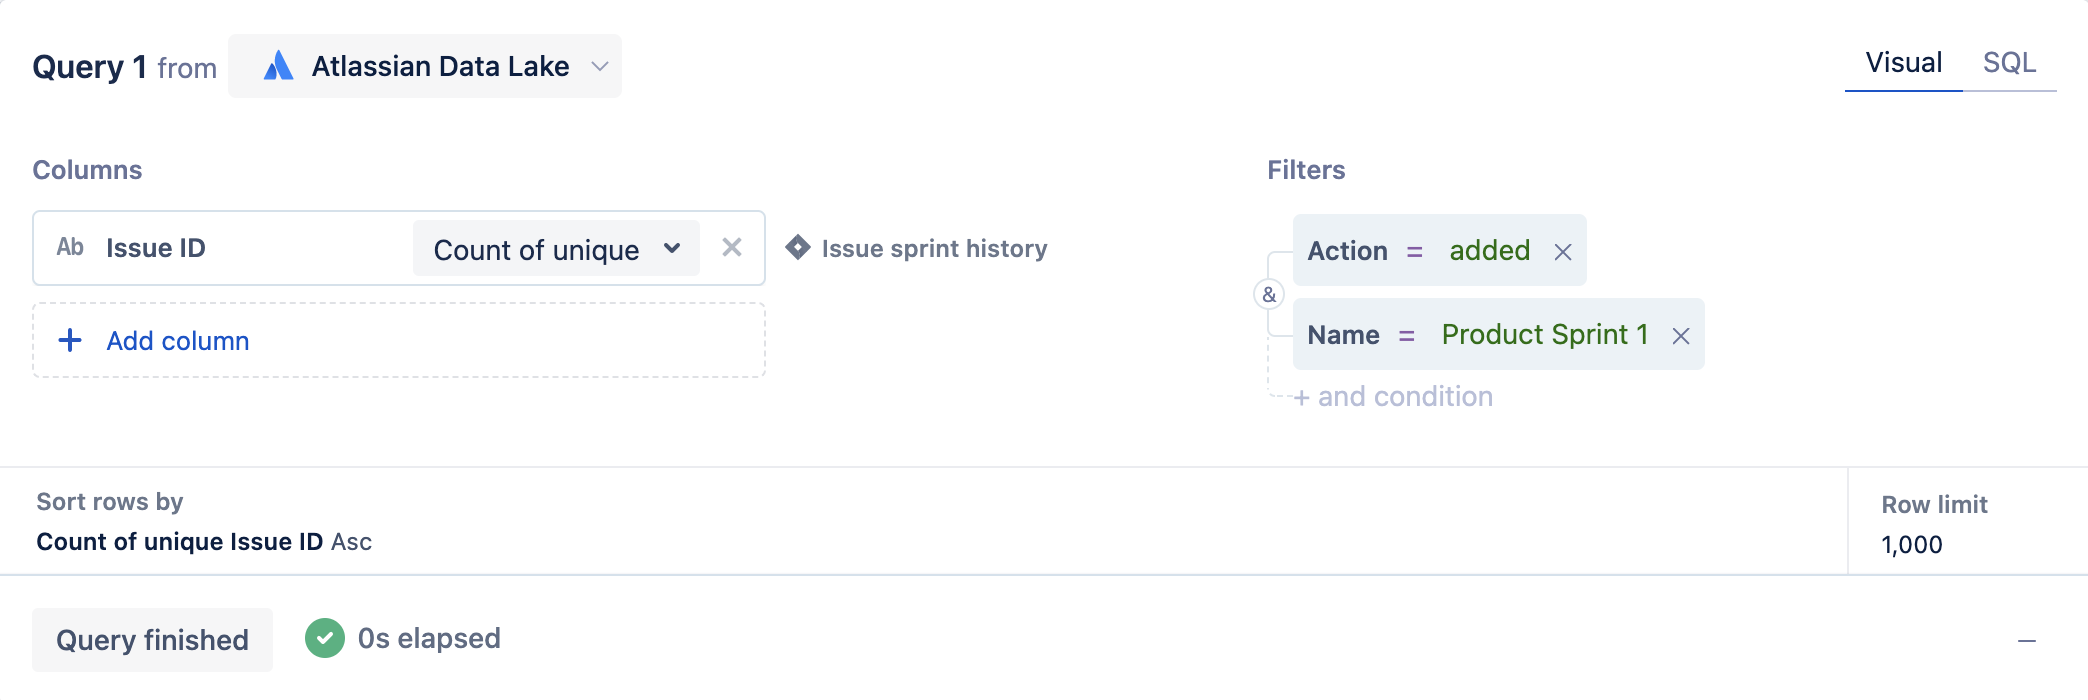
3. Next, we’ll add two filters to the query:
a. For the first filter, add the Action column from the Issue sprint history table where it equals ‘added’.
If you’d rather query the issues removed from the sprint, you’ll add a filter where the Action column from the Issue sprint history table equals ‘removed’.
b. For the second filter, add the Name column from the Sprint table where it equals your sprint’s name. In our example, we’ll use Name = 'Product Sprint 1'since that is what our sprint is named.
4. Run the query!
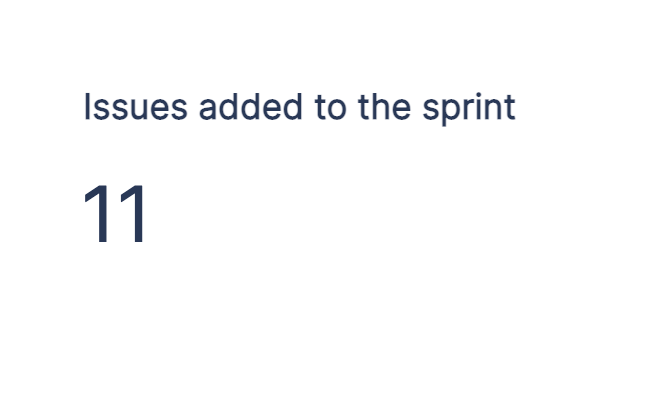
Now we’re able to see how many issues have been added to our ‘Product Sprint 1’ sprint.
Querying a sprint's allocation
To query a sprint’s total allocation, we’ll create a single chart with the following steps:
1. Open up the chart editor by creating a new custom chart or editing an existing chart.
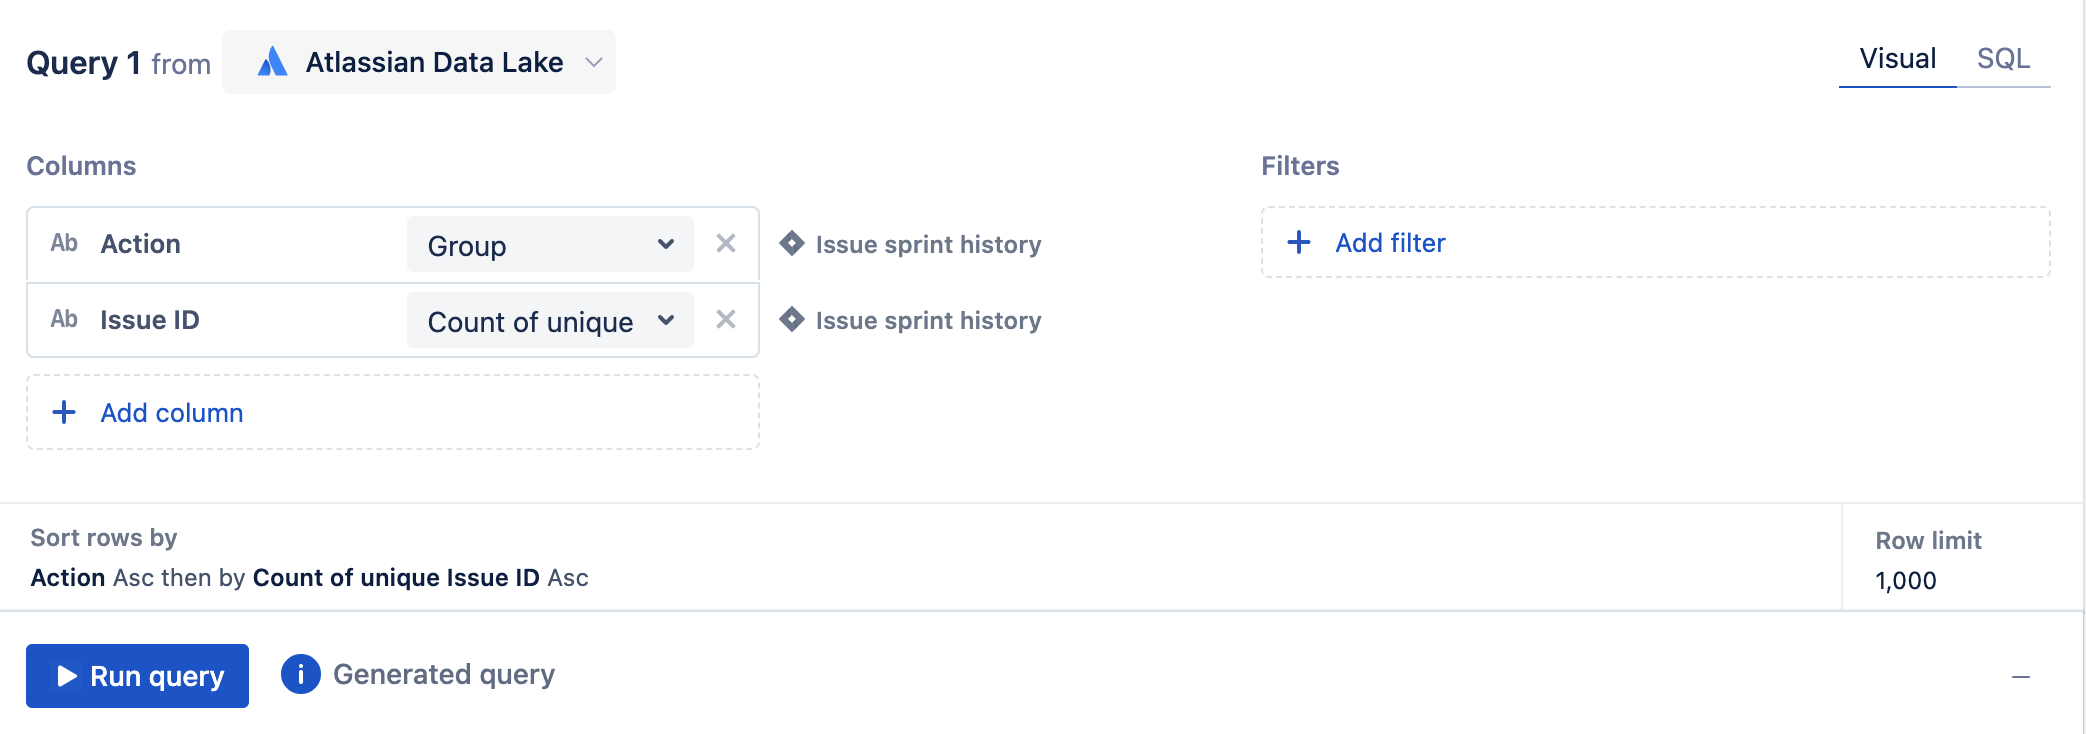
2. In visual mode, add the Action and Issue ID columns from the Issue sprint history table to the query. Select Count of unique as the aggregation for the Issue ID column and leave Group as the grouping for the Action column.
3. Next, we’ll add a filter to the query where the Name column from the Sprint table equals the name of the sprint. In our example, we’ll use Name = 'Product Sprint 1'since that is what our sprint is named.
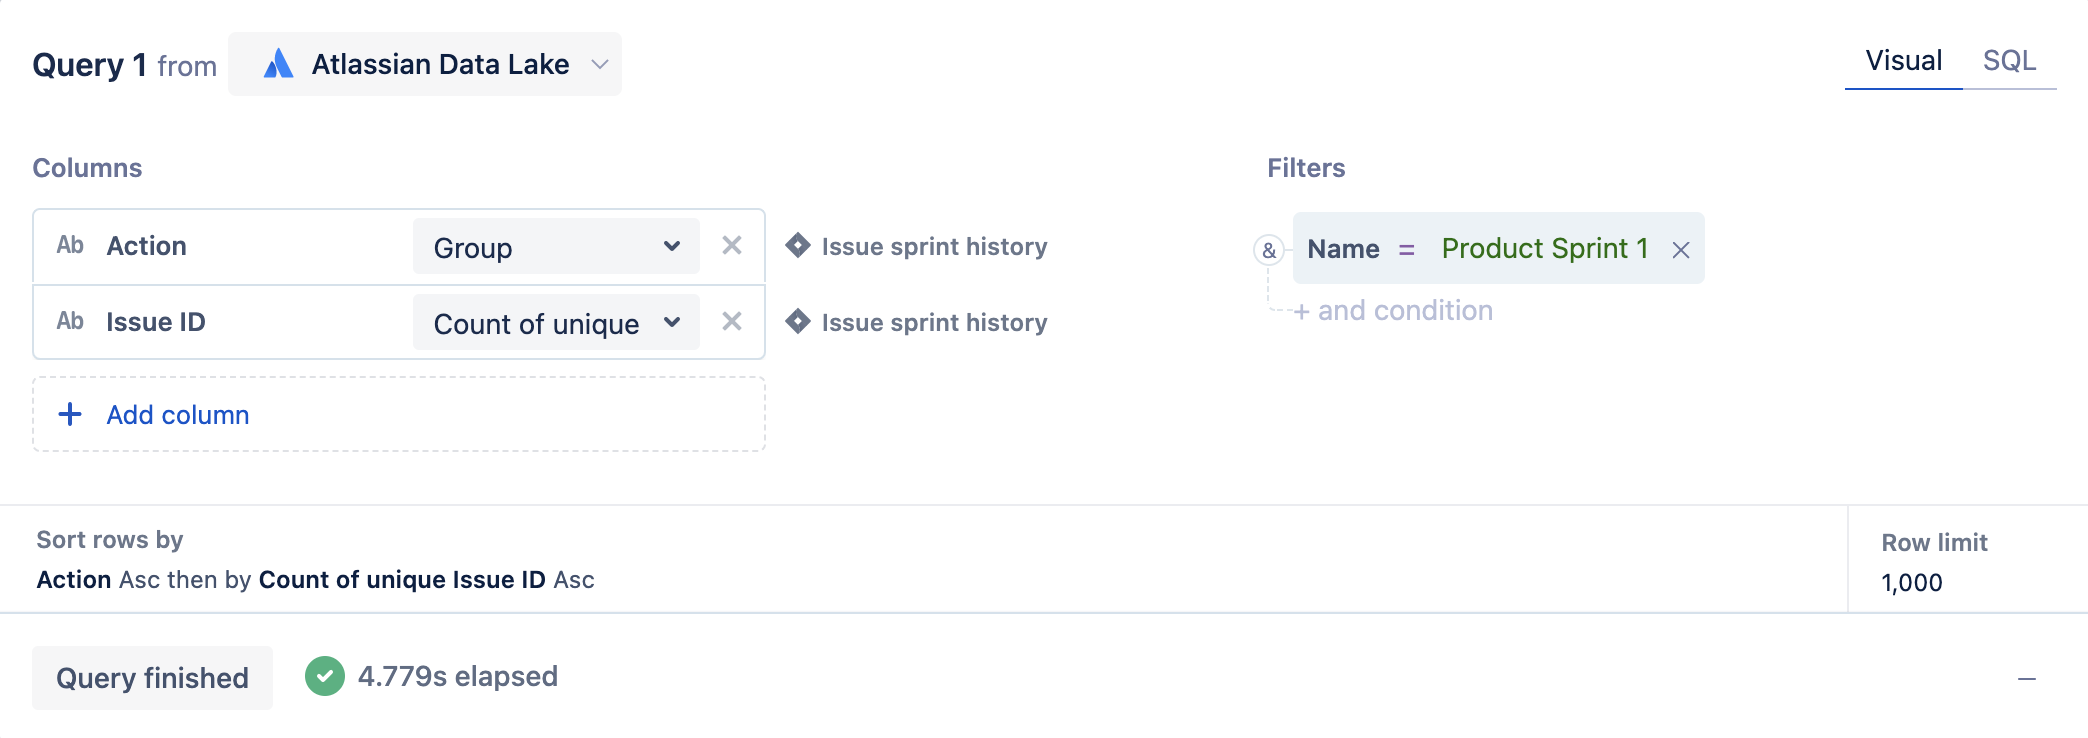
4. Optional: Rename the Issue ID column from ‘Count of unique Issue ID’ to ‘Issues’.
5. Run the query!
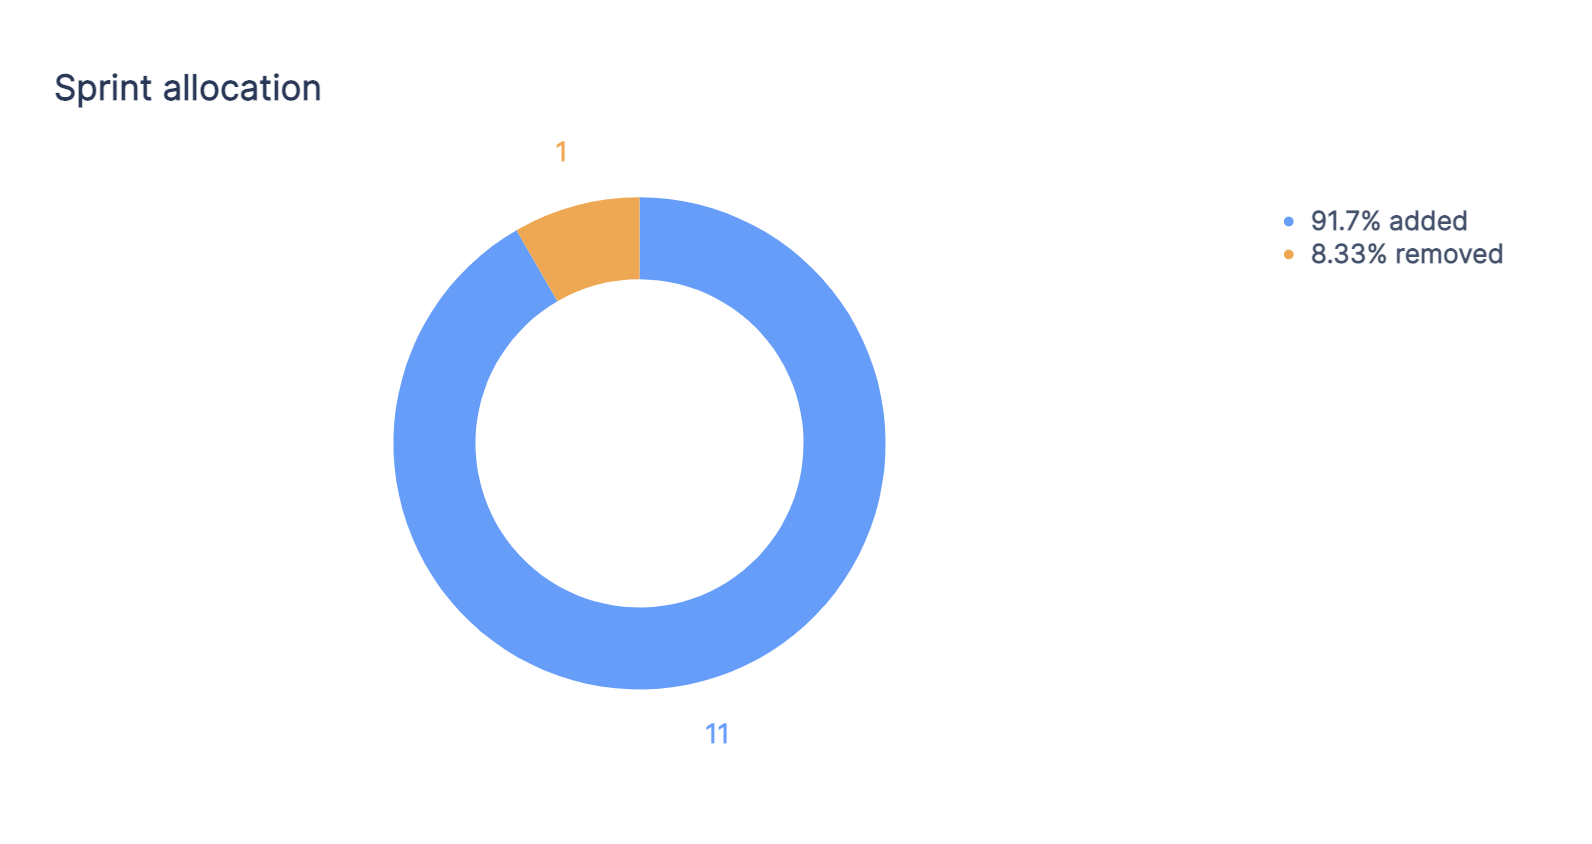
Now our chart is visualizing the allocation of issues for our ‘Product Sprint 1’ sprint.
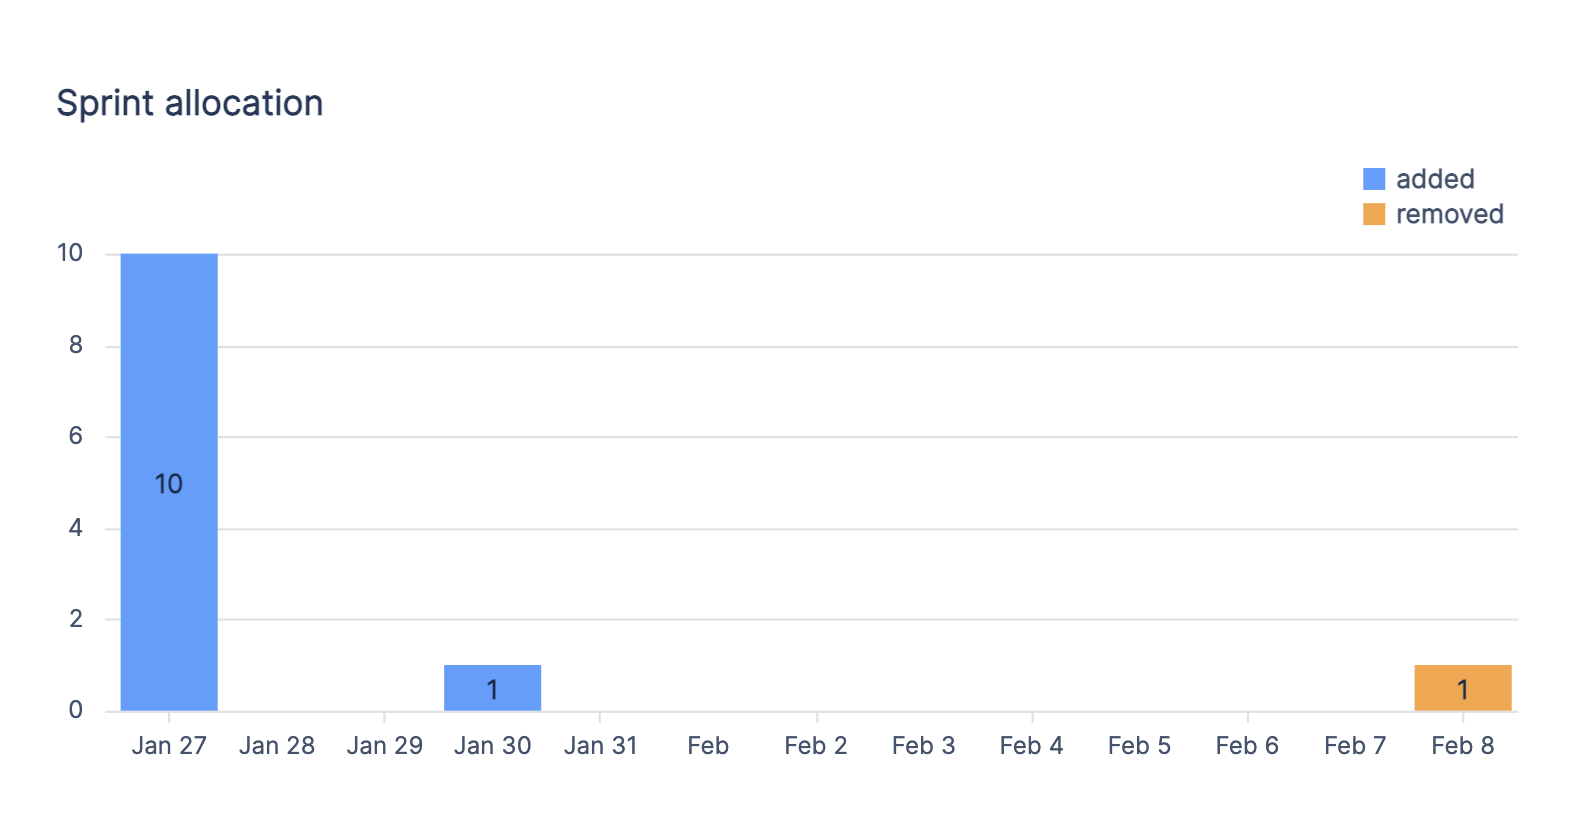
Querying a sprint's allocation over time
If you’d like to see how the sprint’s allocation has changed over time, you can take the chart above one step further using these steps:
1. Edit your existing sprint allocation chart, or create a new one by following the steps above.
2. Add the Action at column from the Issue sprint history table to the query. Select your desired grouping of the Action at column.
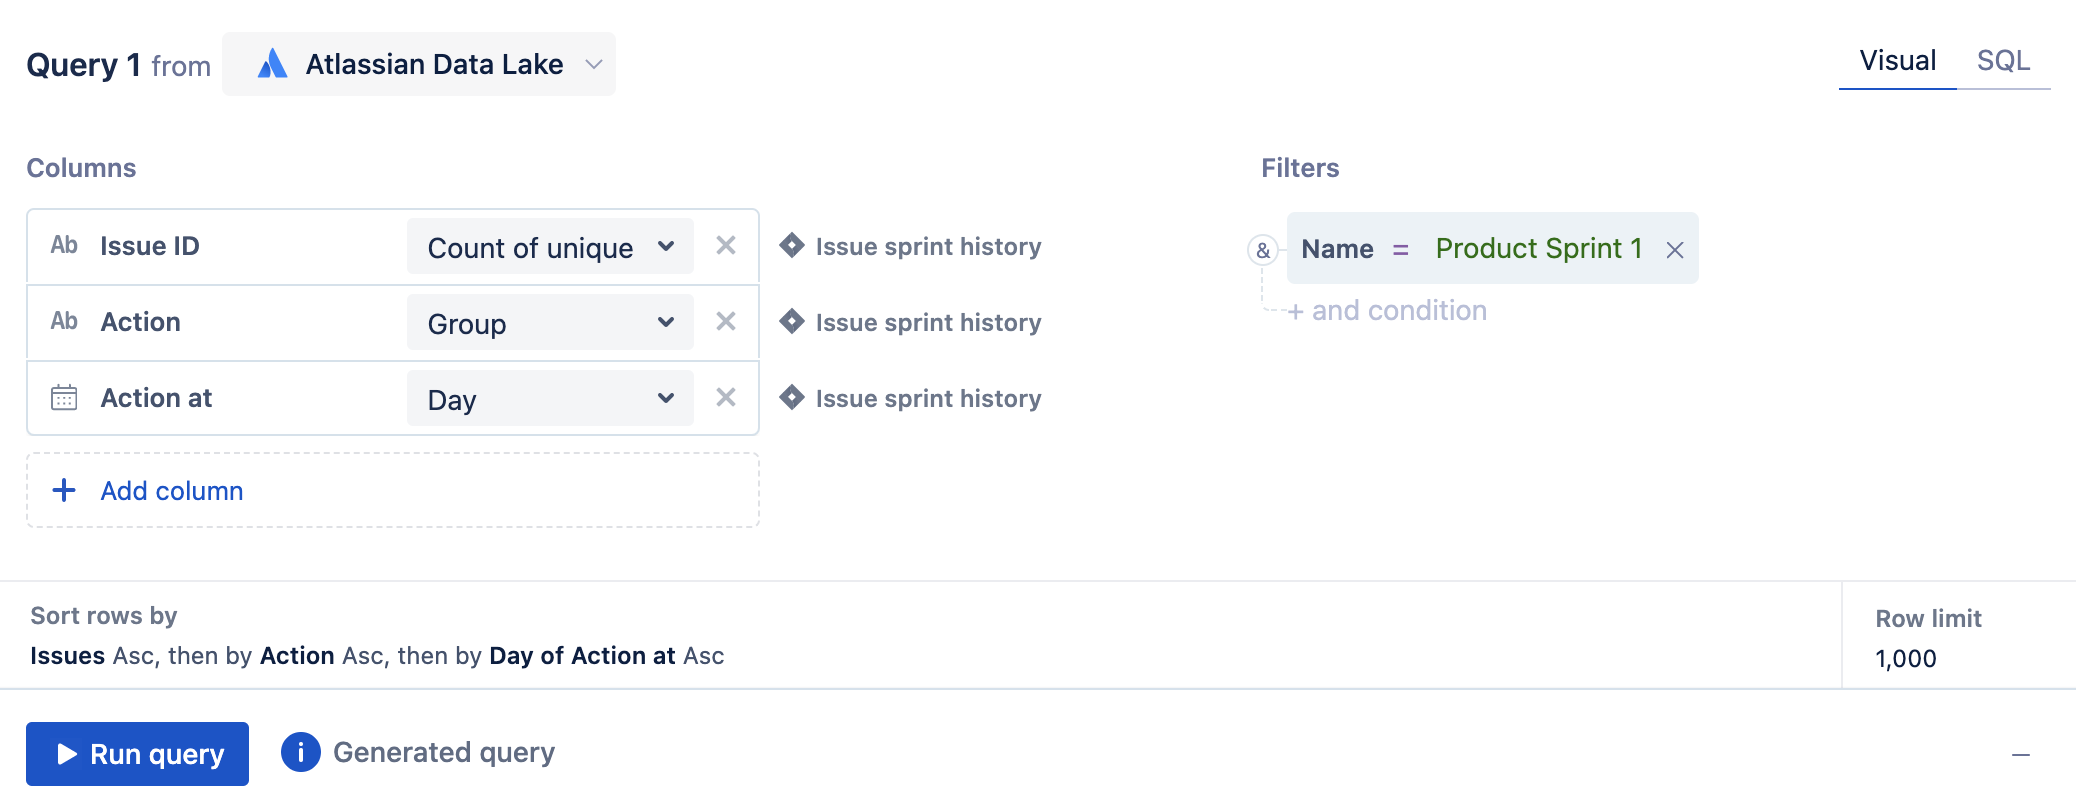
3. Run the query!
4. Reorder the columns so they appear in this order: Action at, Action, Issue ID
5. Add a "Pivot" step that sums any duplicates. This will separate the Action column into two distinct columns, added and removed, that have a count of the issues added or removed on the Action at date.
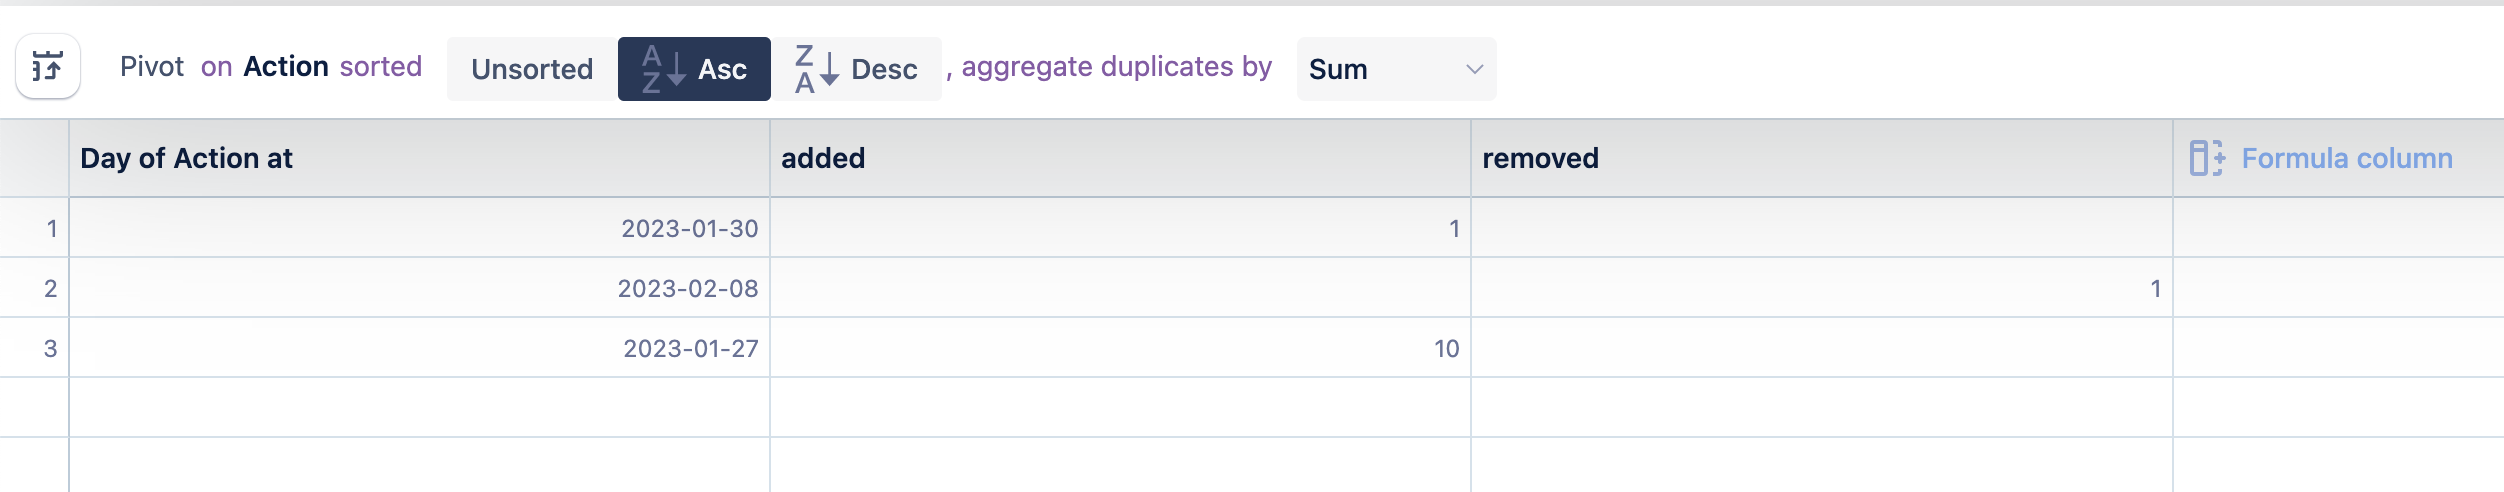
6. Optional: add a Zero fill step to fill any missing values with zeroes.
The chart is now displaying issue allocation for the ‘Product Sprint 1’ sprint over time.
If you’d like to query more of your sprint data, you can easily do so by using the Jira Software - Sprint overview dashboard template.
Was this helpful?