Monitoring the progress of a sprint
Active sprints
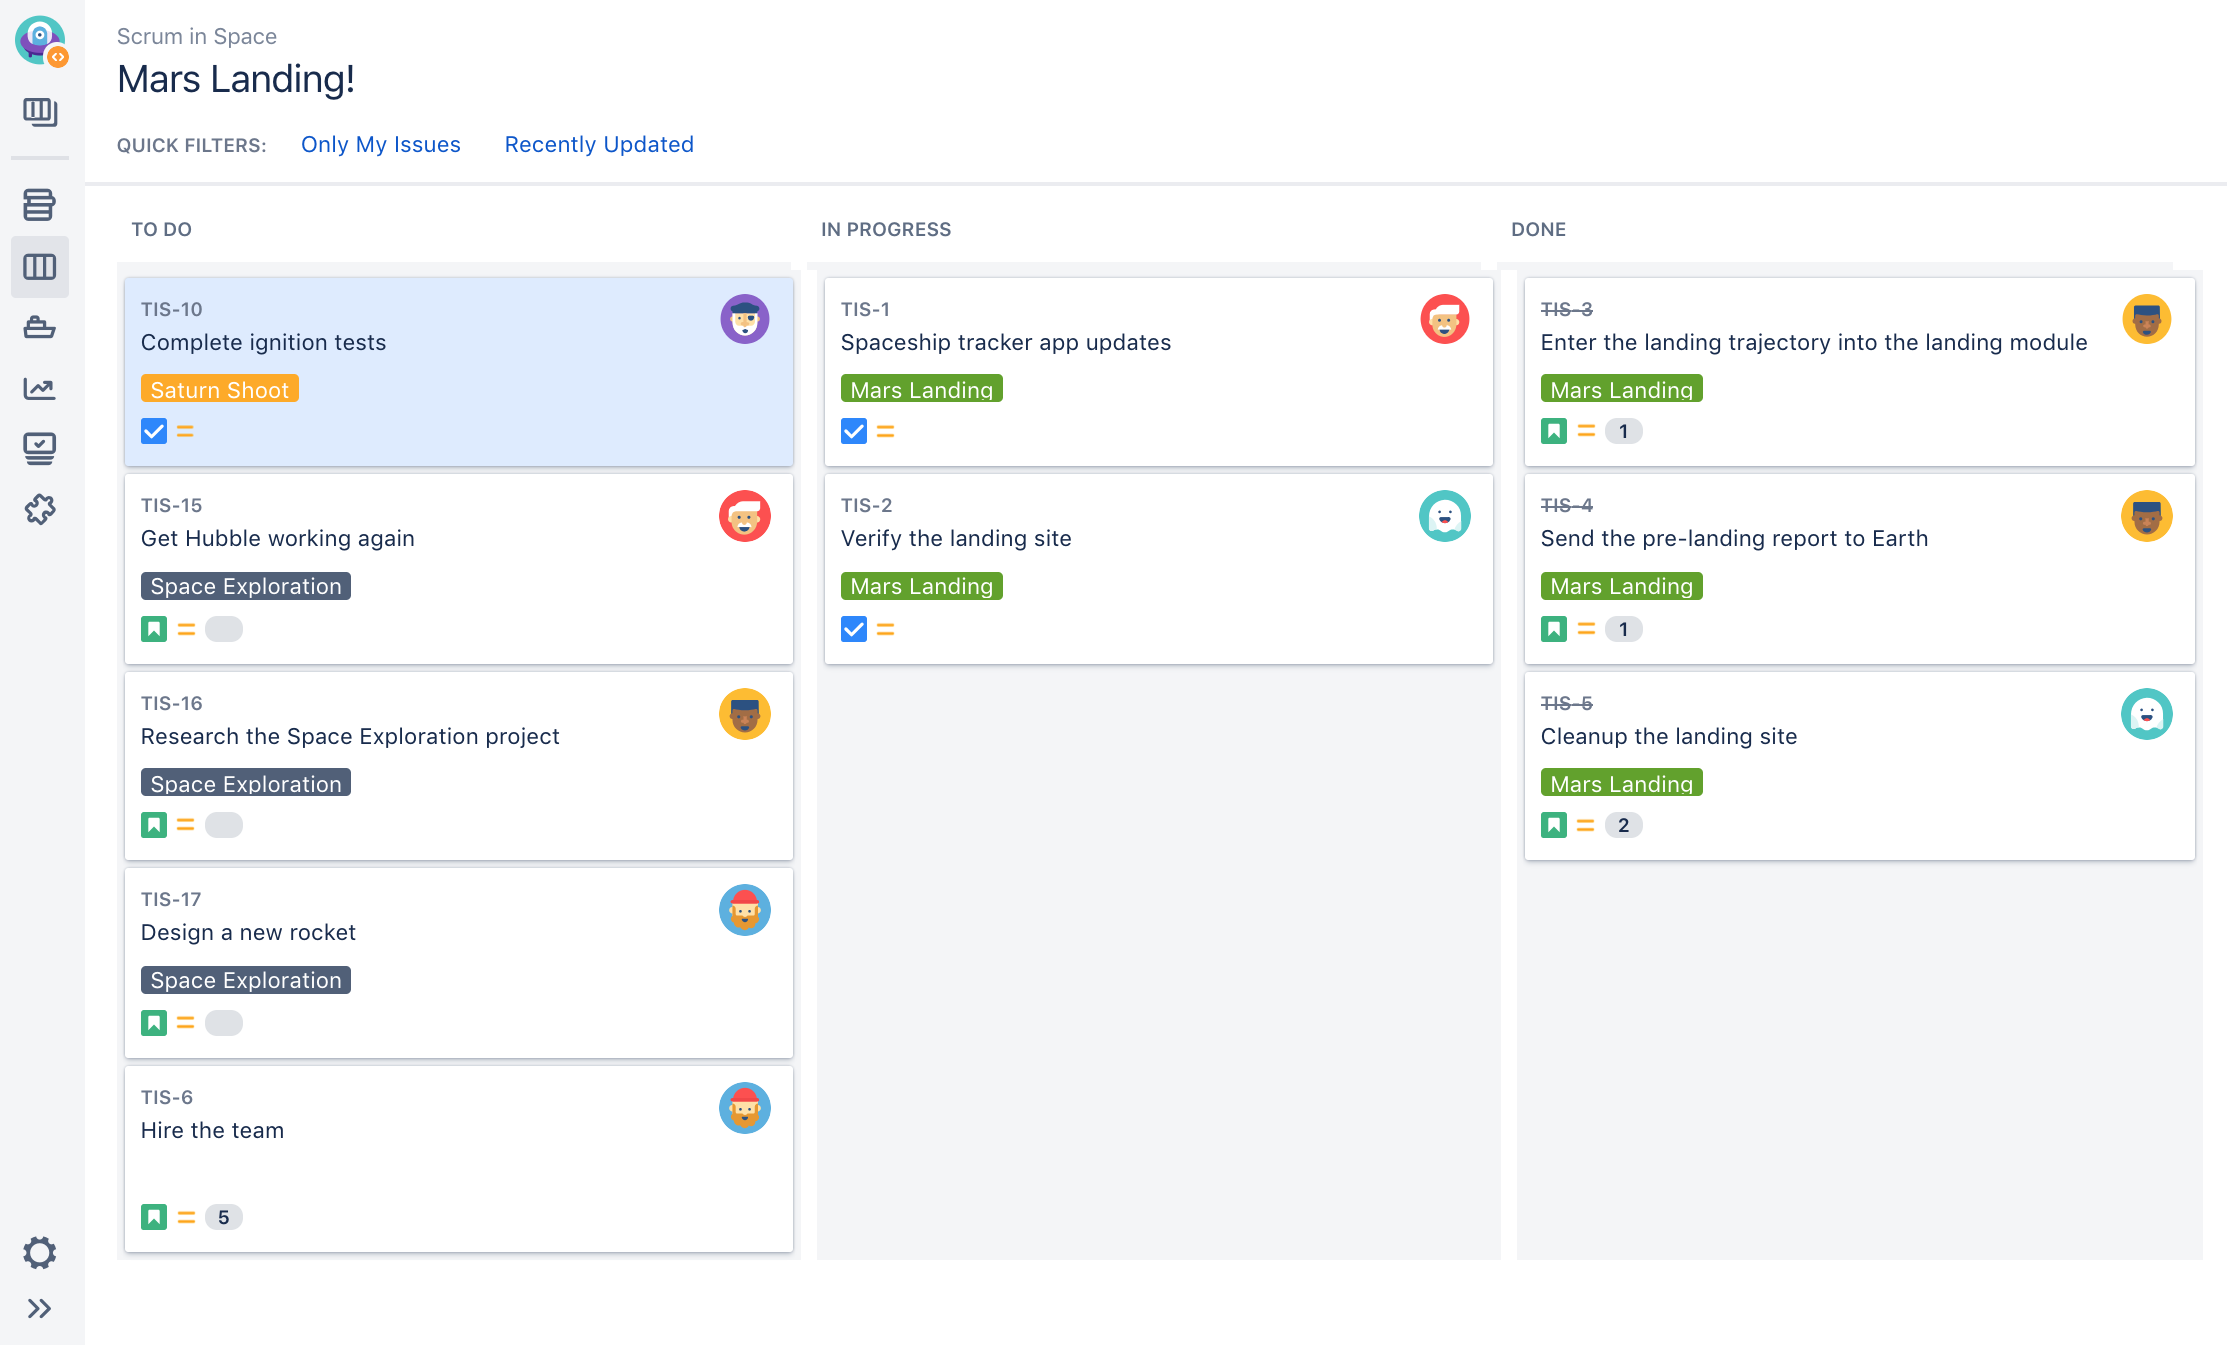
The Active sprints of a scrum board just may be the central workspace for a sprint that is in progress. You and your team would usually check Active sprints at least once a day, while a sprint is running — perhaps your team has its daily stand-ups around a monitor displaying Active sprints.
Learn more: Using Active sprints
Development panel for issues
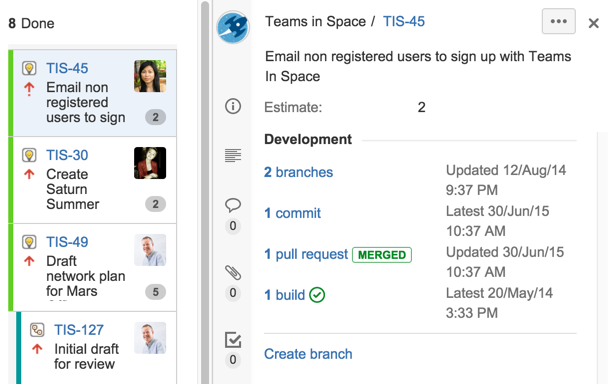
If you have Jira Software connected to your development tools, a 'Development' panel is shown on each issue that shows you information about the commits, branches, pull requests, builds, and more, that are related to the issue. This can help you see discrepancies at a glance — for example, issues that have related commits, but are still in the 'To Do' status.
Learn more: Configuring development tools
Wallboards and gadgets
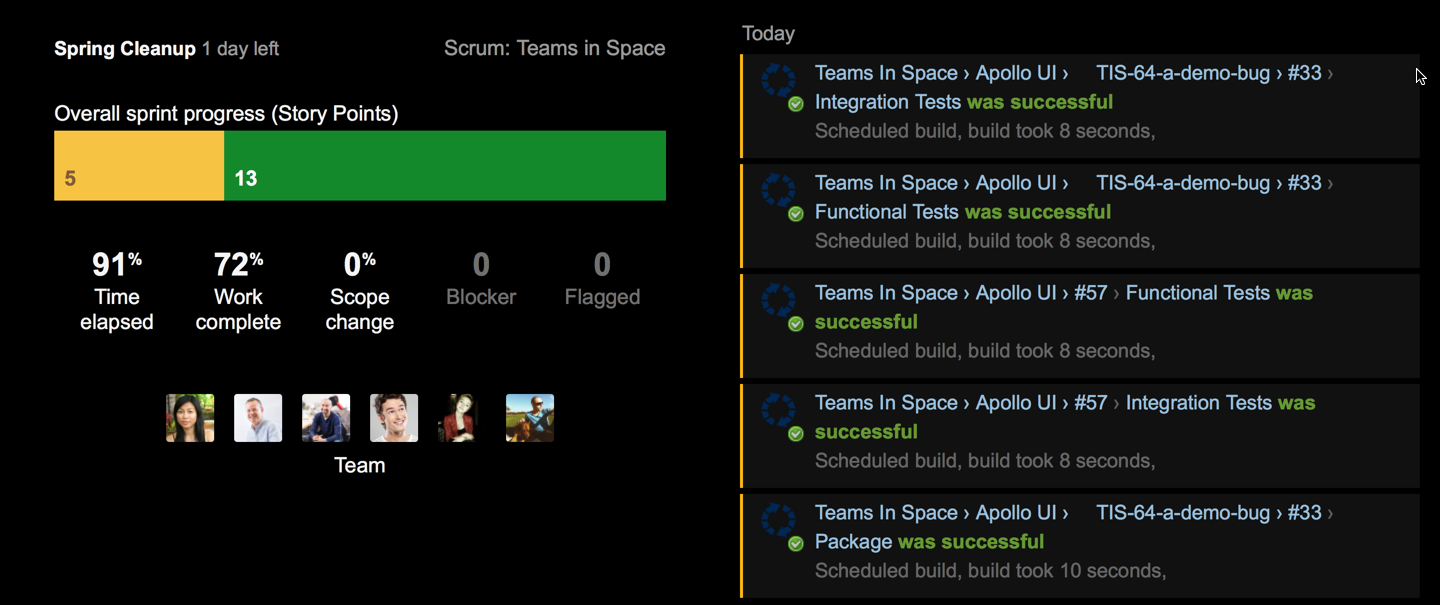
A wallboard can act as an "information radiator" for your team, letting them know how they are progressing during a sprint, alerting them when builds are broken, reminding them about upcoming team events, and more. You just need to add the desired gadgets to a dashboard, then display it as a wallboard (Tools > View as Wallboard on the dashboard).
Learn more: Configuring dashboards
Burndown chart
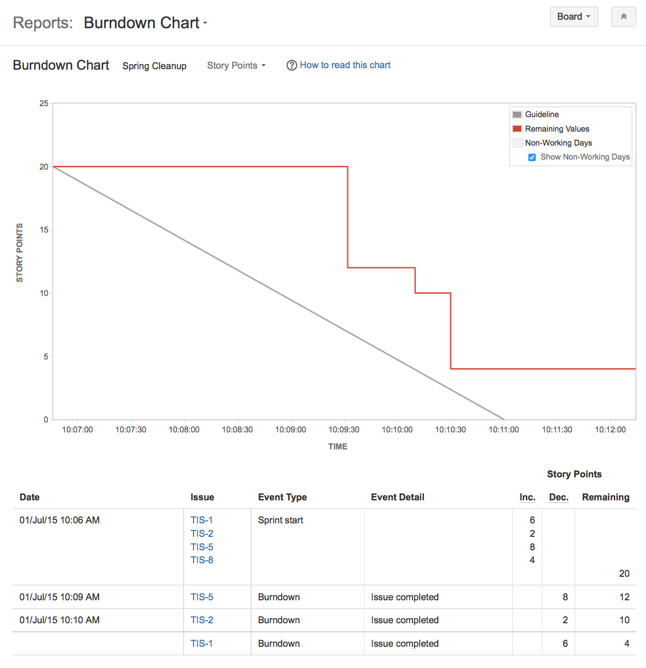
The Burndown chart shows the work that has been completed in a sprint and estimates how long it will take to complete the remaining work. This can help you determine the likelihood of your team completing a sprint on time — allowing you to visualize or highlight problems so your team can take actions to remedy them.
Learn more: Burndown Chart
View the Burnup Chart
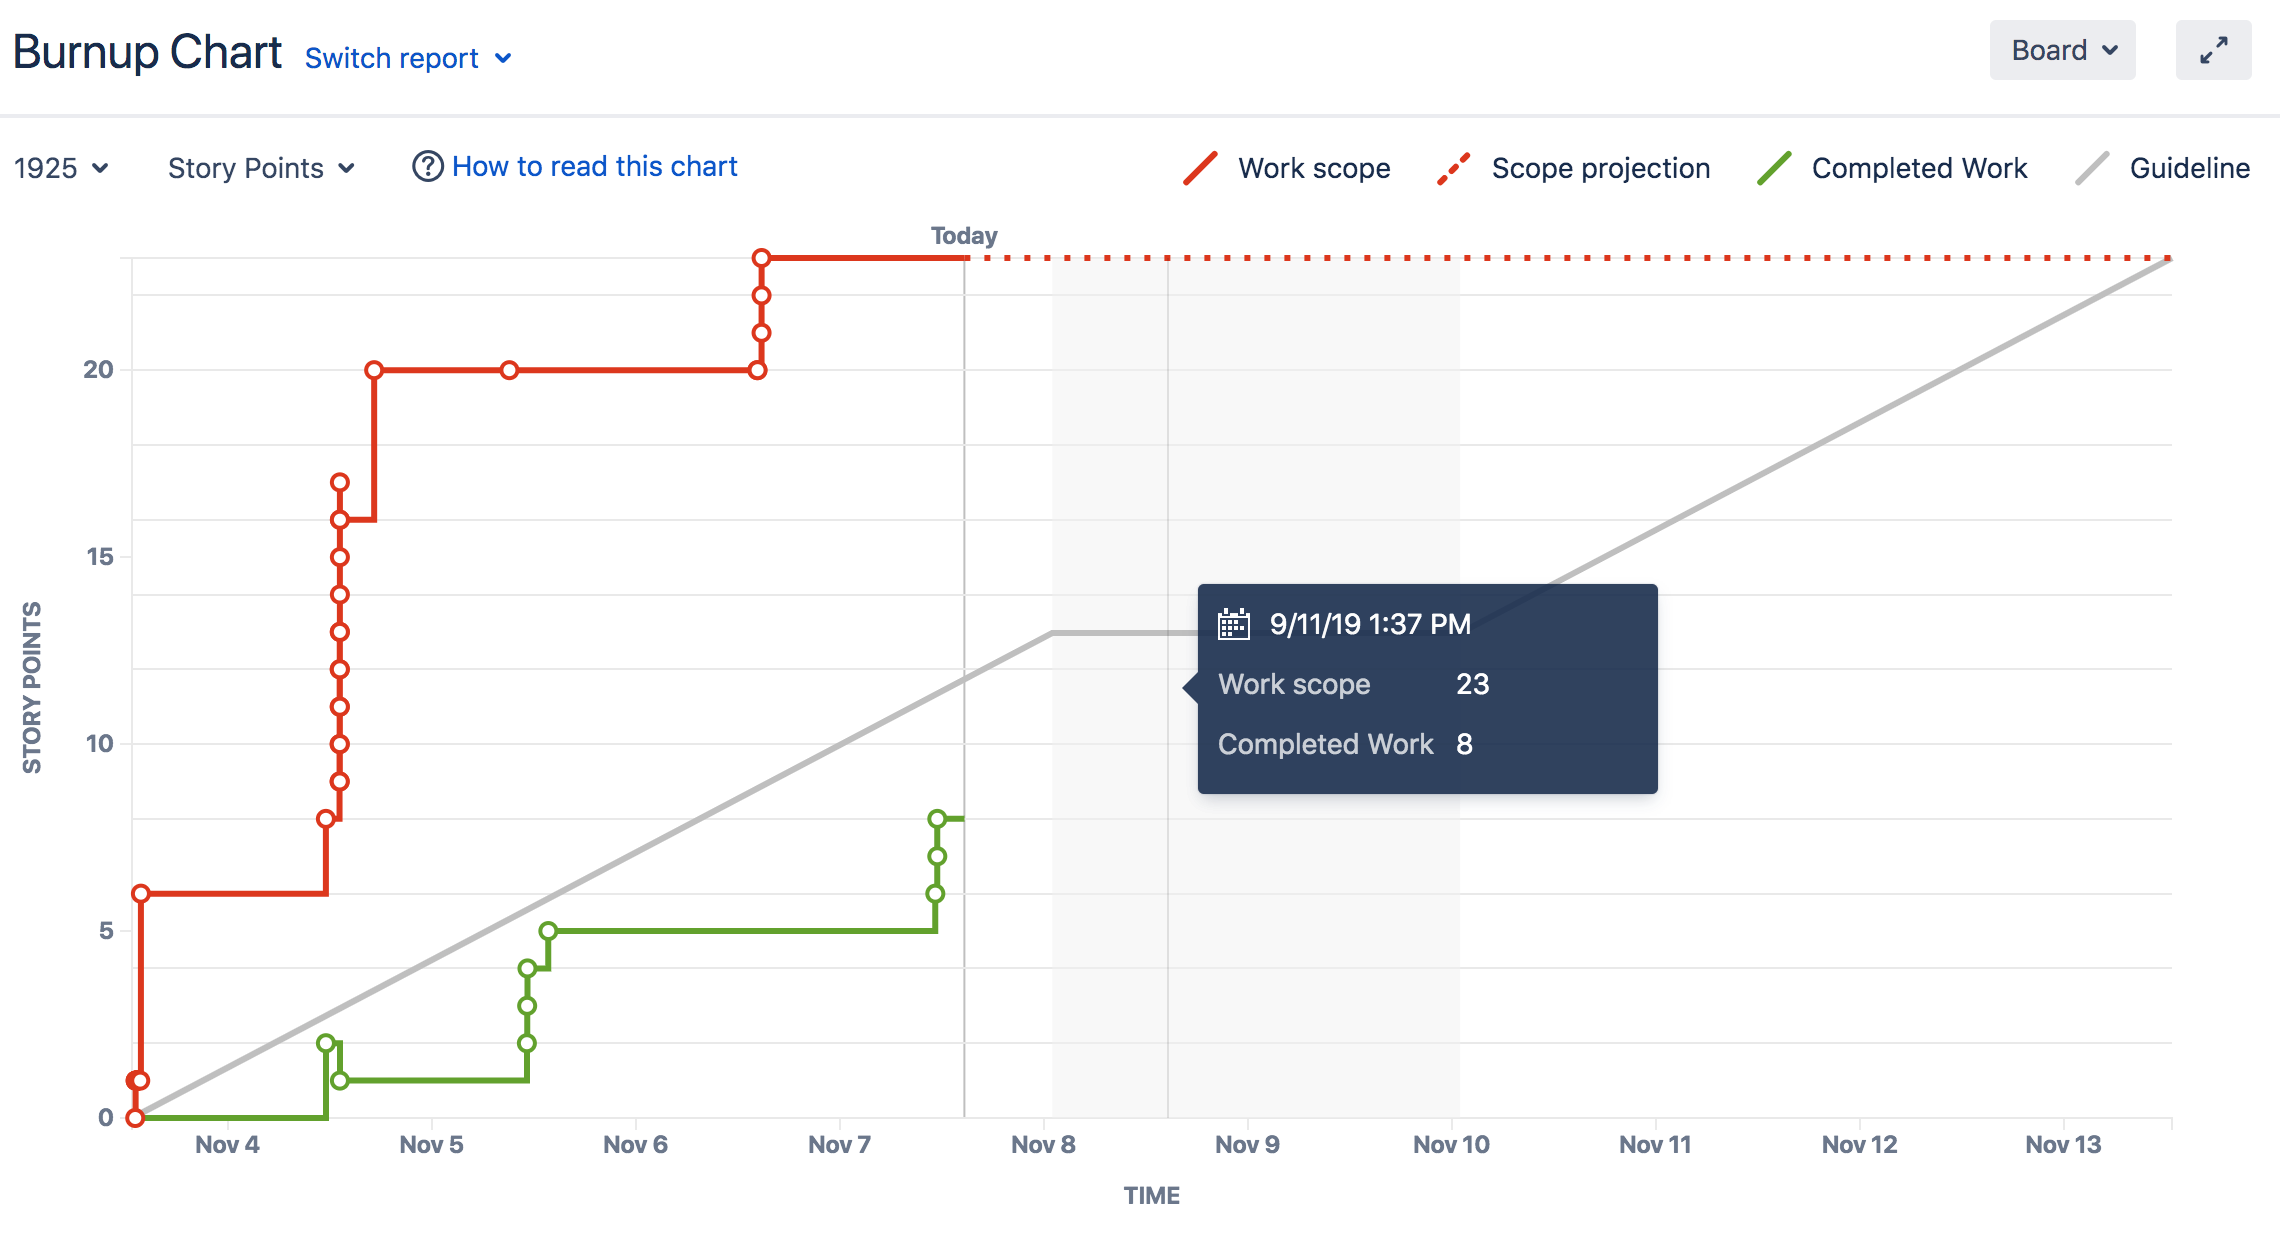
The Burnup Chart provides a visual representation of a sprint's completed work compared with its total scope. It offers insights on your project's progress, as well as offers warnings to help you maintain your project's health; you can instantly identify problems such as scope creep or a deviation from the planned project path.
Burn-up charts has one important advantage over the Burndown Chart in that it allows to divide the scope and the progress. Both scope and progress are combined on the Burndown chart and it is not possible to visualize and identify changes in scope and/or progress.
Learn more: Burnup Chart
