Monitoring your Operations integration inactivity
Platform Notice: Cloud - This article applies to Atlassian products on the cloud platform.
This article highlights a new alerting feature that's natively available in Jira Service Management which is gradually rolling out to some Jira Service Management Cloud customers. It may not yet be visible or available on your site.
This article only applies for sites having Premium and Enterprise Jira Service Management subscriptions.
Scenario
Suppose you have an Operations integration that creates hourly alerts and it suddenly stops working. Or perhaps you just want to get notified in case your integration doesn't create new alerts within a specific period of time. After following this article steps you should be able to monitor your integration inactivity specifically for your use case.
In this article example we will set up a monitoring mechanism for an email integration, however you can apply it for any other integration you might have.
Solution
After setting up an email integration, the first step will be a heartbeat creation by following the below steps:
1 - Search for your team and access it using the Teams option on the upper menu of your Jira.
2 - Once into your team's page, click the Go to operations button under the Operations section.
3 - Select the Heartbeats option from the left menu of your team's operations and click Create heartbeat.
4 - Fill in your heartbeat information:
- Give your heartbeat a name and a description, if required.
- Fill in its ping interval. This configuration refers to how long you want an alert to be created in case your actual integration doesn't create any alerts. Supposing you have an integration creating hourly alerts as described above, you may set it to 70 minutes so an alert is created after 10 minutes of the period that the last alert should have been created.
- Specify what is the alert priority and and message that should be created in case your heartbeat expires, meaning the time your actual integration doesn't create an alert.
5 - Hit the Create heartbeat button.
6 - Within the created heartbeat configuration scroll down the page to the Instructions section. From the Heartbeats API tab, copy the URL provided in the second step and save it somewhere to be used in the upcoming steps:
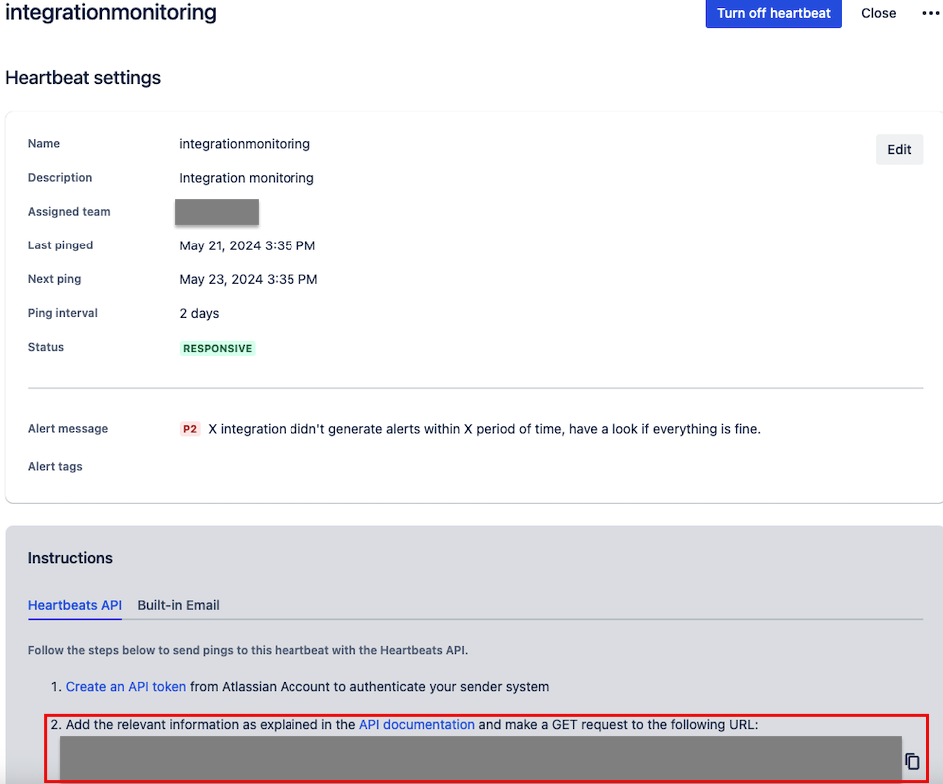
We recommend using the copy shortcut to make sure you copy accurate information.
We're now done with our heartbeat creation. The next action requires a webhook integration creation according to the below steps:
1 - Search for your team and access it using the Teams option on the upper menu of your Jira.
2 - Once into your team's page, click the Go to operations button under the Operations section.
3 - Select the Integrations option from the left menu of your team's operations and click Add integration.
4 - Search for and select the Webhook integration.
5 - Give your integration a name, select the related team or make it a global integration and hit Continue.
6 - From the top informational box of your integration click the Edit button.
7 - Within its Authenticate for sending alert updates to Webhook section, select the Authenticate with a Webhook account option.
8 - Fill in the Webhook URL field with the URL you copied in the 6th step during the heartbeat set up.
9 - Click on Add extra property and fill the Key field with the Authorization keyword and the Value field as follows:
- If you already have an API token you can use it, otherwise you should create one following our Manage API tokens for your Atlassian account documentation.
- After having the Atlassian API token, you will need to encode your credentials with base64. It can be done using any online tool such this example. Just fill the first text field using the following format:
- <EMAIL>:<API_TOKEN>
- Supposing your email address is atlassian@atlassian.com, it should be filled as: atlassian@atlassian.com:xxxxxxxxxxxxxxxxx
- In the above example, xxxxxxxxxxxxxxxxx should be replaced with the API token code created in the first step.
- Now hit the Encode button and it will automatically create the result. Fill the Value field with the Basic keyword along with the encoding result, just like the following example where yyyyyyyyyyyy corresponds to the encoded content. After that click the confirmation button:

10 - You should now hit the Save button.
11 - In the Alert filters section you should apply filters that match the alerts being created from the integration you want to be monitored.
12 - Within Alert actions you should leave only the Alert is created checkbox selected.
13 - Now you're ready to turn on your integration by hitting the Turn on integration button.
Wrap up
We're now done with your integration monitoring. It should basically follow the below workflow:
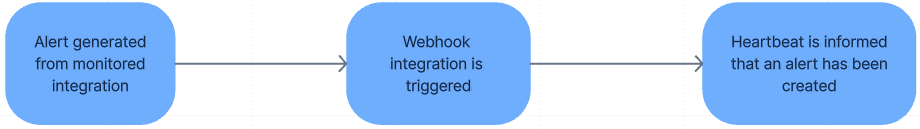
If the monitored integration doesn't create alerts within the interval specified in the heartbeat's ping interval an alert will be generated.