The board configuration page returns a blank page
Platform notice: Server and Data Center only. This article only applies to Atlassian products on the Server and Data Center platforms.
Support for Server* products ended on February 15th 2024. If you are running a Server product, you can visit the Atlassian Server end of support announcement to review your migration options.
*Except Fisheye and Crucible
Problem
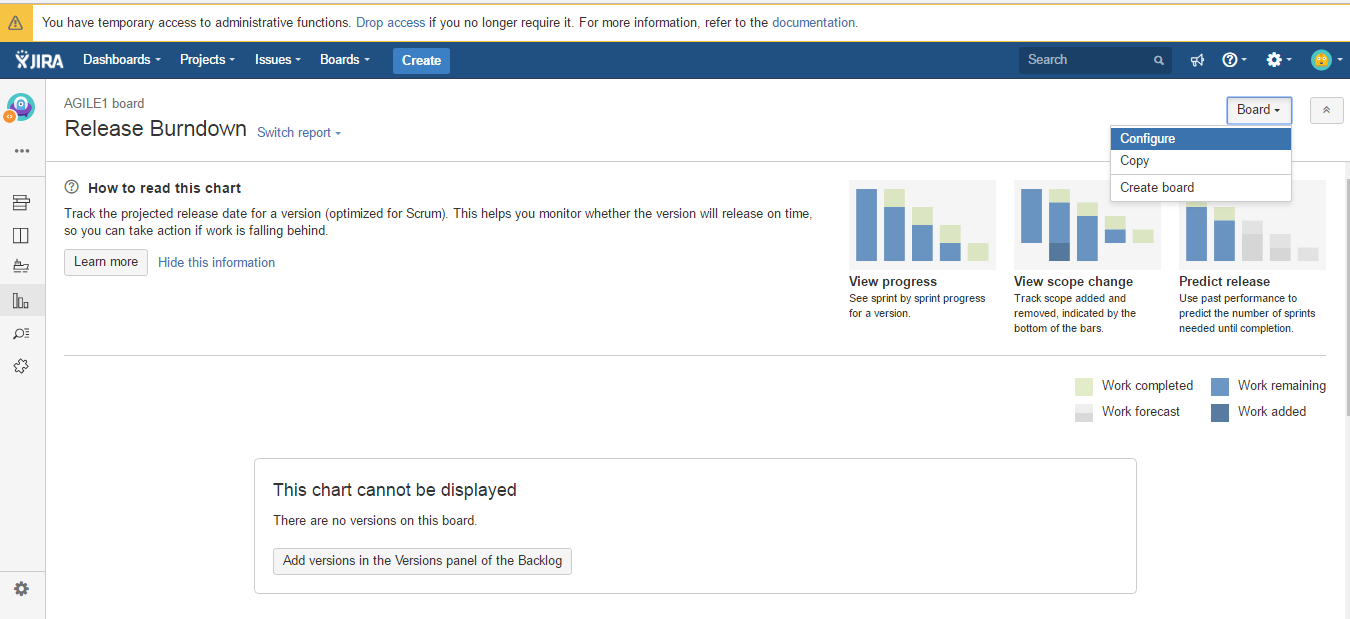
When clicking on the Configure button in an Agile Board, an empty page is displayed as shown below:
|
|
|---|
Environment
Jira Software Server / Data Center 7.0.0 and any higher version.
Diagnosis
Diagnosis for Root Cause 1 and 2
If either of the 2 errors below is found in the atlassian-jira.log file, then Root Cause 1 or Root Cause 2 might be relevant:
Example or error 1
2016-09-10 14:19:41,756 http-nio-8080-exec-16 ERROR jiraadmin 859x11469x3 1mw2ipg 0:0:0:0:0:0:0:1 /rest/greenhopper/1.0/rapidviewconfig/editmodel.json [c.a.g.w.rapid.view.RapidViewEditResource] Unable to complete GreenHopper REST method
java.lang.NullPointerException
	at com.atlassian.greenhopper.service.workflow.SimplifiedWorkflowServiceImpl.getResolutionUpdateFunction(SimplifiedWorkflowServiceImpl.java:640)
	at com.atlassian.greenhopper.service.workflow.SimplifiedWorkflowServiceImpl.isStatusResolutionDone(SimplifiedWorkflowServiceImpl.java:590)
	at com.atlassian.greenhopper.web.rapid.view.ColumnEditHelper.asStatusEntry(ColumnEditHelper.java:341)
	at com.atlassian.greenhopper.web.rapid.view.ColumnEditHelper.buildColumnStatusesModel(ColumnEditHelper.java:293)
	at com.atlassian.greenhopper.web.rapid.view.ColumnEditHelper.buildColumnEditModel(ColumnEditHelper.java:186)
	at com.atlassian.greenhopper.web.rapid.view.RapidViewEditHelper.getEditModel(RapidViewEditHelper.java:148)
...
	at org.apache.tomcat.util.threads.TaskThread$WrappingRunnable.run(TaskThread.java:61)
	at java.lang.Thread.run(Unknown Source)
Example or error 2
2016-06-29 11:57:23,848 http-bio-8280-exec-24 ERROR captainplanet 717x4633x1 1fq3nm0 10.0.1.10 /rest/greenhopper/1.0/rapidviewconfig/editmodel.json [common.error.jersey.ThrowableExceptionMapper] Uncaught exception thrown by REST service: null java.lang.NullPointerException
	at com.atlassian.greenhopper.web.rapid.view.ColumnEditRequest$StatusDetails.from(ColumnEditRequest.java:148)
	at com.atlassian.greenhopper.web.rapid.view.ColumnEditHelper.asStatusEntry(ColumnEditHelper.java:331)
	at com.atlassian.greenhopper.web.rapid.view.ColumnEditHelper.buildColumnStatusesModel(ColumnEditHelper.java:314)
	at com.atlassian.greenhopper.web.rapid.view.ColumnEditHelper.buildColumnEditModel(ColumnEditHelper.java:186)
	at com.atlassian.greenhopper.web.rapid.view.RapidViewEditHelper.getEditModel(RapidViewEditHelper.java:156)
...
	at org.apache.tomcat.util.threads.TaskThread$WrappingRunnable.run(TaskThread.java:61)
	at java.lang.Thread.run(Thread.java:745)
Diagnosis for Root Cause 3
If you are using Jira Data Center with a cluster of nodes, and the following error is found in at least 1 node in the atlassian-jira.log file, then Root Cause 3 might be relevant:
2022-11-10 06:06:03,950-0500 http-nio-8080-exec-110 ERROR admin 366x7359545x3 1h95ms4 XX.XXX.XX.XX /rest/greenhopper/1.0/rapidviewconfig/editmodel.json [c.a.j.issue.fields.DefaultFieldManager] FieldLayoutItem for field named Related with ID customfield_15203 is null. Usually this is a transient race condition due to concurrent modification. Please contact Atlassian support if you see this log message frequently.
2022-11-10 06:06:03,962-0500 http-nio-8080-exec-110 ERROR admin 366x7359545x3 1h95ms4 XX.XXX.XX.XX /rest/greenhopper/1.0/rapidviewconfig/editmodel.json [c.a.p.r.c.error.jersey.ThrowableExceptionMapper] Uncaught exception thrown by REST service: java.lang.NullPointerException
com.atlassian.cache.CacheException: java.lang.NullPointerException
	at com.atlassian.cache.ehcache.DelegatingCache.get(DelegatingCache.java:113)
	at com.atlassian.jira.issue.fields.config.persistence.CachedFieldConfigSchemePersister.getConfigSchemesForCustomField(CachedFieldConfigSchemePersister.java:111)
	at com.atlassian.jira.issue.fields.config.manager.FieldConfigSchemeManagerImpl.getConfigSchemesForField(FieldConfigSchemeManagerImpl.java:66)
	at com.atlassian.jira.issue.fields.ImmutableCustomField.getConfigurationSchemes(ImmutableCustomField.java:1213)
	at com.atlassian.jira.jql.permission.CustomFieldClausePermissionChecker.hasPermissionToUseClause(CustomFieldClausePermissionChecker.java:43)
	at com.atlassian.jira.jql.permission.DefaultClausePermissionHandler.hasPermissionToUseClause(DefaultClausePermissionHandler.java:46)
	at com.atlassian.jira.issue.search.managers.DefaultSearchHandlerManager.getVisibleClauseHandlers(DefaultSearchHandlerManager.java:172)
	at com.atlassian.jira.web.component.jql.DefaultAutoCompleteJsonGenerator.getVisibleFieldNamesJson(DefaultAutoCompleteJsonGenerator.java:77)
Diagnosis for Root Cause 4
This root cause is not a straight forward root cause to identify, since there is no error thrown in the Jira application logs. Because of that, it is important that each point mentioned below is reviewed carefully.
Checking the Browser Network/Console logs
Once way to check if this root cause is relevant is to open the browser development tool while loading the board configuration page, wait for about 1-2min, and check the Network and Console tabs:
- In the Network tab:
- look for the end point /rest/greenhopper/1.0/rapidviewconfig/editmodel.json and check if the loading fails with the error "Failed to load response data: No data found for resource with given identifier"

- look for the end point /rest/greenhopper/1.0/rapidviewconfig/editmodel.json and check if the loading fails with the error "Failed to load response data: No data found for resource with given identifier"
- In the Console tab:
check if there is an error saying that an Ajax script was aborted because it timed out:
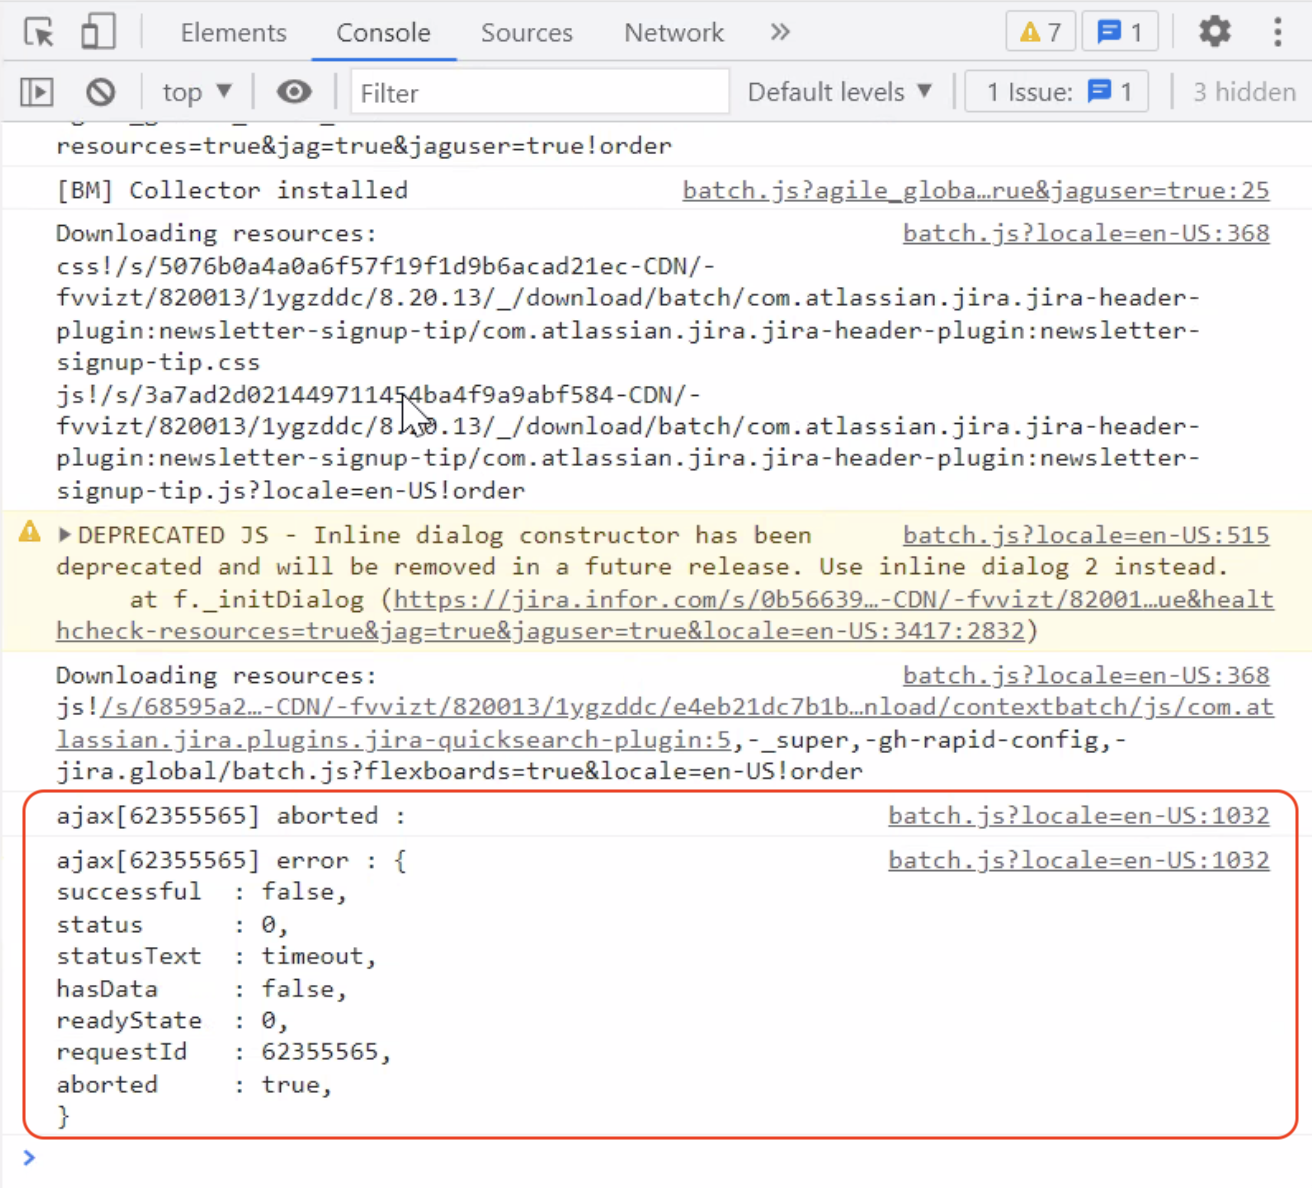
(anonymous) @ batch.js?agile_global_admin_condition=true&baseurl-check-resources=true&flexboards=true&healthcheck-resources=true&jag=true&jaguser=true&locale=en-US:13105
batch.js?locale=en-US:1032 ajax[50624658] aborted :
batch.js?locale=en-US:1032 ajax[50624658] error : {
successful  : false,
status      : 0,
statusText  : timeout,
hasData     : false,
readyState  : 0,
requestId   : 50624658,
aborted     : true,
}
Note that depending on how long it takes for the end point /rest/greenhopper/1.0/rapidviewconfig/editmodel.json to be loaded (we have seen situations were it took more than 15min), we might not always see the "aborted" error in the console tab, since it is difficult to tell in advance how long we should wait until we see this error in the browser.
Checking the Tomcat Access logs
Not seeing the "aborted" error in the Console log does not necessarily mean that this root cause is not valid. It is possible that we did not wait long enough for this error to show in the browser (since this error could show more than 15min later).
Another way to validate this root cause is to check the Tomcat Access logs. These files are stored in the directory <JIRA_INSTALL>/logs , and have the name access_log.<date>.log.
Run the grep command below after replacing <BOARD_ID> with the board ID (which you can get from the URL you see in the browser while trying to load the board configuration page), and <date> with the day you replicated the issue:
grep 'GET /rest/greenhopper/1.0/rapidviewconfig/editmodel.json?rapidViewId=<BOARD_ID>' access_log.<date>.logLook at the row(s) that were found by the grep command, and check the time it took for this request to complete. If it took several minutes to complete, then this root cause is relevant. In the example below, we can see that it took 964085 ms (16min!) to look the board with ID 5:
XX.XX.XX.XX 853x14255961x4 someuser [08/Dec/2023:14:29:48 +0000] "GET /rest/greenhopper/1.0/rapidviewconfig/editmodel.json?rapidViewId=5&_=1702044821702 HTTP/1.1" 200 231578 964085 "https://jira.eon.com/secure/RapidView.jspa?rapidView=5" "Mozilla/5.0 (Windows NT 10.0; Win64; x64) AppleWebKit/537.36 (KHTML, like Gecko) Chrome/119.0.0.0 Safari/537.36 Edg/119.0.0.0" "1c2h0xg"Checking Thread Dumps
If the methods listed above did not help, another way to validate this root cause is to collect thread dumps while loading the Board Configuration page, and to check if you can find a long running thread associated to the end point /rest/greenhopper/1.0/rapidviewconfig/editmodel.json:
"http-nio-8080-exec-22 url: /rest/greenhopper/1.0/rapidviewconfig/editmodel.json; user: jayachandra.nellore@infor.com" daemon prio=5 tid=0x00000000000002b5 nid=0 runnable
   java.lang.Thread.State: RUNNABLE
	at java.util.AbstractCollection.<init>(AbstractCollection.java:66)
	at java.util.AbstractList.<init>(AbstractList.java:76)
	at java.util.Arrays$ArrayList.<init>(Arrays.java:3812)
	at java.util.Arrays.asList(Arrays.java:3800)
	at com.google.common.base.Predicates.asList(Predicates.java:689)
	at com.google.common.base.Predicates.and(Predicates.java:115)
	at com.atlassian.jira.issue.fields.CustomFieldScopeImpl.isIncludedIn(CustomFieldScopeImpl.java:54)
	at com.atlassian.jira.issue.fields.ImmutableCustomField.isInScopeOfAtLeastOneIssueContext(ImmutableCustomField.java:263)
	at com.atlassian.jira.issue.fields.ImmutableCustomField.isInScopeForSearch(ImmutableCustomField.java:257)
	at com.atlassian.jira.issue.managers.CachingCustomFieldManager.lambda$getCustomFieldObjects$4(CachingCustomFieldManager.java:271)
	at com.atlassian.jira.issue.managers.CachingCustomFieldManager$$Lambda$5017/1050505143.test(Unknown Source)
	at java.util.stream.ReferencePipeline$2$1.accept(ReferencePipeline.java:174)
	at java.util.Spliterators$ArraySpliterator.forEachRemaining(Spliterators.java:948)
	at java.util.stream.AbstractPipeline.copyInto(AbstractPipeline.java:482)
	at java.util.stream.AbstractPipeline.wrapAndCopyInto(AbstractPipeline.java:472)
	at java.util.stream.ReduceOps$ReduceOp.evaluateSequential(ReduceOps.java:708)
	at java.util.stream.AbstractPipeline.evaluate(AbstractPipeline.java:234)
	at java.util.stream.ReferencePipeline.collect(ReferencePipeline.java:566)
	at com.atlassian.jira.issue.managers.CachingCustomFieldManager.getCustomFieldObjects(CachingCustomFieldManager.java:272)
	at com.atlassian.jira.issue.fields.DefaultFieldManager.getAvailableCustomFieldsWithScope(DefaultFieldManager.java:441)
	at com.atlassian.jira.issue.fields.DefaultFieldManager.getAvailableNavigableFieldsWithScope(DefaultFieldManager.java:381)
	at com.atlassian.jira.issue.fields.DefaultFieldManager.getAvailableNavigableFieldsWithScope(DefaultFieldManager.java:341)
Testing the Board filter with another board
Another way to identify this root cause is to create a new Dummy board, using the same filter that the board that is not loading is using. If the configuration page of this board is also blank, then it is an indicator that this root cause is valid and that the problem is coming from the board filter that is too complex
To identify which filter is used by the problematic board, get the board ID from the URL you see in the browser while trying to load the board configuration page, and replace <BOARD_ID> with this ID in the SQL query below:
select * from searchrequest where id =
	(
		SELECT "SAVED_FILTER_ID" FROM "AO_60DB71_RAPIDVIEW" where "ID" = <BOARD_ID>
	)
Cause
Root Cause 1
The system Workflow Plugin was disabled.
Root Cause 2
You have workflow(-s) with an orphaned status (for example, status was manually deleted from the DB after creating the workflow).
The issue is caused by the bug
JSWSERVER-13881
-
Getting issue details...
STATUS
.
Root Cause 3
Due to a Jira bug which only occurs on a Data Center cluster with at least 2 nodes, if a custom field is deleted, the following might happen:
- a NullPointerException might be thrown in the Jira application logs
- in some cases, some Board configuration page might be blank
This issue is caused by the bug JRASERVER-68647 - Getting issue details... STATUS .
Root Cause 4
The board is configured with a complex filter that does not filter specific projects.
Resolution
For Root Cause 1
Enable the system Workflow plugin by following the steps below:
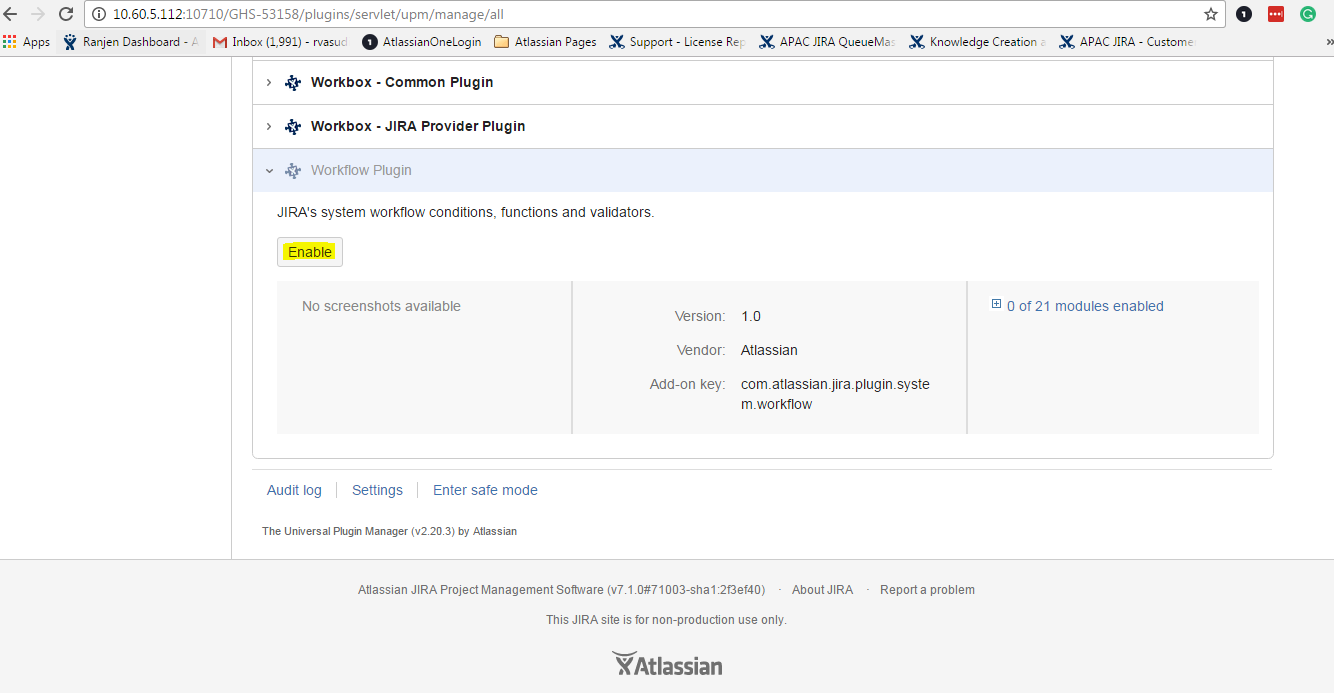
- Go to Administration (⚙) > Manage apps.
- Select "All apps" from the dropdown list.
- Enable the Workflow Plugin.
For Root Cause 2
The workaround is similar to the one mentioned in the KB article Jira server throws Internal Server Error when accessing boards, however this can be caused by any workflow (not just those used by the board).
For Root Cause 3
To fix this issue, you will need to restart all the Node(s) in the Jira cluster where you found the com.atlassian.cache.CacheException: java.lang.NullPointerException error, so that the cache can be flushed on these nodes. After you restart the nodes, check again the atlassian-jira.log file and make sure that the error is no longer showing.
For Root Cause 4
Edit the filter associated with the board and make it "simpler" by adding a condition that restricts the search to specific projects.
To find the filter that needs to be updated, follow the steps below:
Run the SQL query below after replacing <BOARD_ID> with the ID of the board which configuration page does not load:
select * from searchrequest where id = ( SELECT "SAVED_FILTER_ID" FROM "AO_60DB71_RAPIDVIEW" where "ID" = <BOARD_ID> )- Get the filter ID from the result
Open the URL below, after replacing <JIRA_BASE_URL> with Jira's Base URL, and <FILTER_ID> with the filter ID identified in the SQL query:
<JIRA_BASE_URL>/issues/?filter=<FILTER_ID>