SLA display formats and time frames
Support teams rely on Service Level Agreements (SLAs) to plan and track their time against issues.
Jira Service Management shows SLAs in a simplified time format, instead of only hours and minutes. That way, service project agents don't spend precious time working out what 78:00 means in days. Jira admins can change this setting. Learn how to configure additional SLA settings
On this page:
What information can agents and customers see
Project admins can choose to display SLAs on the customer portal. Learn how to set up SLAs
When SLAs are displayed on the customer portal, customers can view fewer SLA details compared to agents:
- Agents can hover over an SLA in the queue view to understand how the SLA is configured. In the issue view, the SLAs section lists all SLAs configured in the project and additional details such as the calendar set against each SLA.

- Customers see SLAs that have been enabled on the customer portal, but they only see the status of the SLA (that is, if an SLA is at risk or breached), without the actual goal.
Icons, colors, and formats
An SLA that's in progress displays:
- an icon (clock or pause) to indicate if the time is being measured or paused
- colors to indicate the urgency of an issue, based on the time remaining
A completed SLA displays:
- an icon (green tick or red cross) to indicate if the SLA was met or breached
- either the remaining time when the SLA completed or the amount of time passed since the SLA breached
Refer to the following table for some example statuses and display formats.
| Status of the SLA cycle and display | Example | Description |
|---|---|---|
| In progress, no color, and the clock is ticking | Agent view:
Customer view:
| There’s more than 1 hour left for the SLA to breach. |
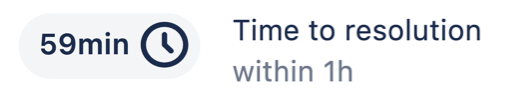
| In progress, gray color, and the clock is ticking | Agent view:
Customer view:
| There’s less than 1 hour (but more than 30 minutes) left for the SLA to breach. |
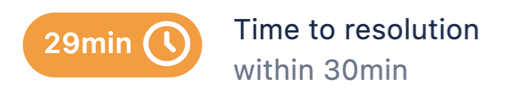
| In progress, orange color, and the clock is ticking | Agent view:
Customer view:
| There’s less than 30 minutes left for the SLA to breach. |
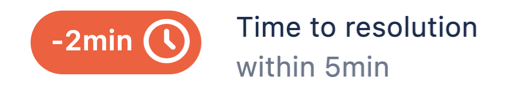
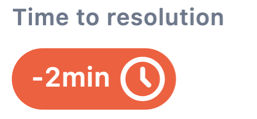
| In progress, red color, and the clock is ticking | Agent view:
Customer view:
| The SLA is about to be breached in a few seconds or it has already breached the target. For breached SLAs, the amount of time past the goal is shown as a negative number. |
| Paused | Agent view:
Customer view:
| The SLA has been paused due to the conditions set or the time is not being counted as it is outside of working hours. When the SLA is at risk or breached when paused, it will use the same colors and layout as shown in the above row, but the clock icon will change to a pause icon. |
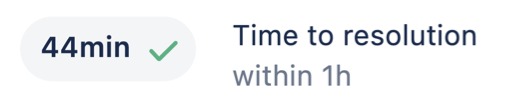
| Completed, green tick | Agent view:
Customer view:
| The SLA goal was met before the SLA entered the stop condition and the time indicates the remaining time left when the SLA completed. |
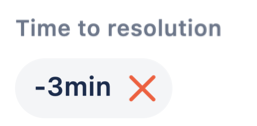
| Completed, red cross | Agent view:
Customer view:
| The SLA breached the target goal and the time indicates the time that has passed since the SLA breached. |


SLAs with multiple cycles
Project admins can configure SLAs to start, pause, and stop based on various conditions. After an SLA has stopped and if one of the start conditions is detected again, the SLA will be reset to start a new cycle.
The past cycle will be displayed in the SLAs panel in the issue view, underneath the SLA’s name. Use the expand icon to view the past cycles.
There will be as many previous cycles as times an SLA is reset.
Past SLA cycles show only in the agent view and aren’t available in the customer view.
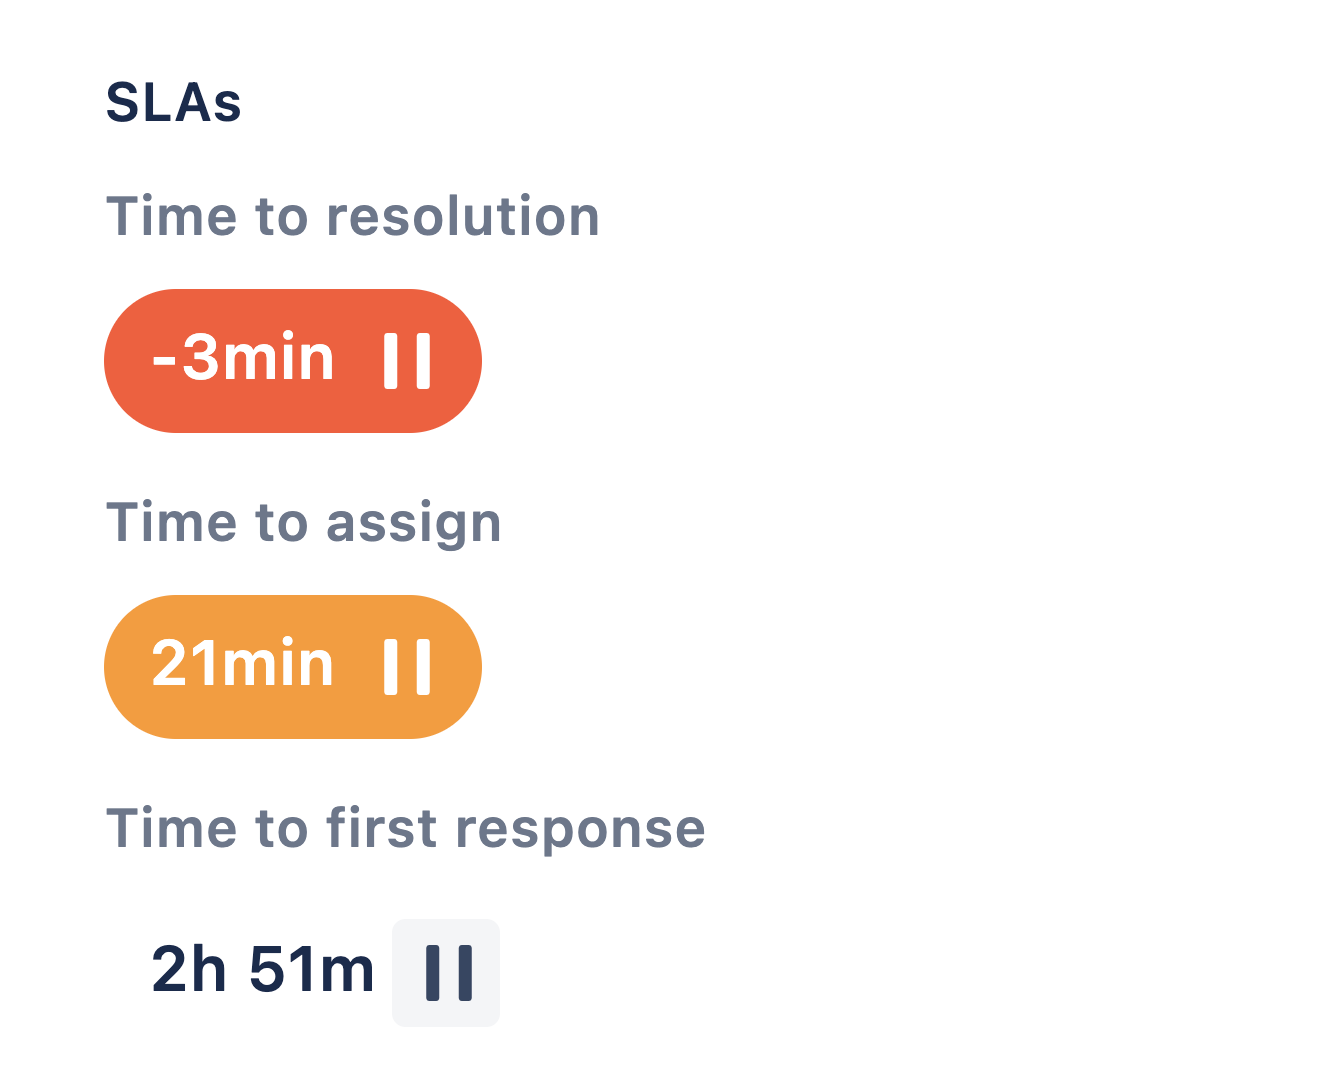
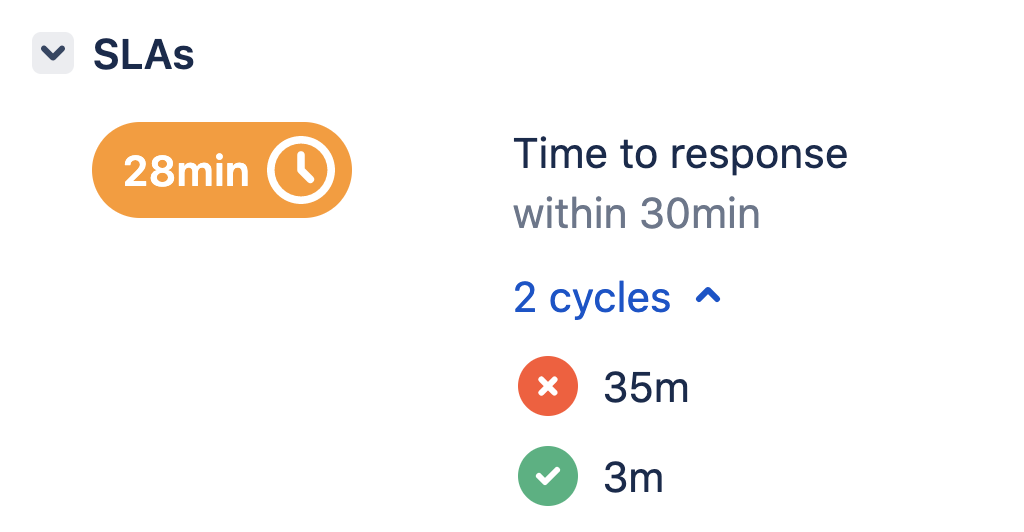
Here’s how past SLA cycles are displayed in the agent view. The SLA has two past cycles:
- The first cycle where the SLA wasn’t breached, and 3 minutes passed.
- The second cycle where the SLA was breached, and 35 minutes passed.
Multiple targets
If the issue meets the criteria for multiple SLAs, trackers for each SLA will be displayed. In addition, if the SLA had multiple cycles, you can hover over the symbols for more details on how the SLA was met for that particular cycle. For example, in an SLA that is measured based on when an issue is Waiting for support, you can see whether the SLA was met each time the issue entered into the Waiting for support status.
Sort issues based on remaining times
When you view a list of issues (in a queue or elsewhere), you can sort them by their remaining times. Issues that are in progress listed first, with the shortest time remaining at the beginning of the list. Completed issues are ranked last, but aren't sorted by the remaining time.
Time notation
Time units are represented in the following format:
| Unit | Display |
|---|---|
| Seconds | Not applicable |
| Minutes | min for single units and m when multiple units are displayed |
| Hours | h |
| Days | d |
| Weeks | w |
| Months | mo |
| Years | yr |
For simplicity, only 1 or 2 units are displayed at a time in the following combinations:
- min
- h m
- d h
- w d
- mo
- yr
Clock and working hours
Jira Service Management calculates minutes, hours, days, and weeks by using the working hours set in the associated calendar. It calculates a month and a year by using approximations of 4 weeks and 12 months, respectively. Learn how to track your teams' working hours and assign calendars to a goal
Let's take a look at how time is tracked:
- Remaining time: Remaining time is calculated by considering the time from now until due, taking into account any pauses.
- Goal time: Goal time is calculated similar to remaining time, but now is set to start of goal. Goal time doesn't take any future pauses into account. Regardless of the current time, the goal time is always calculated from the start time.
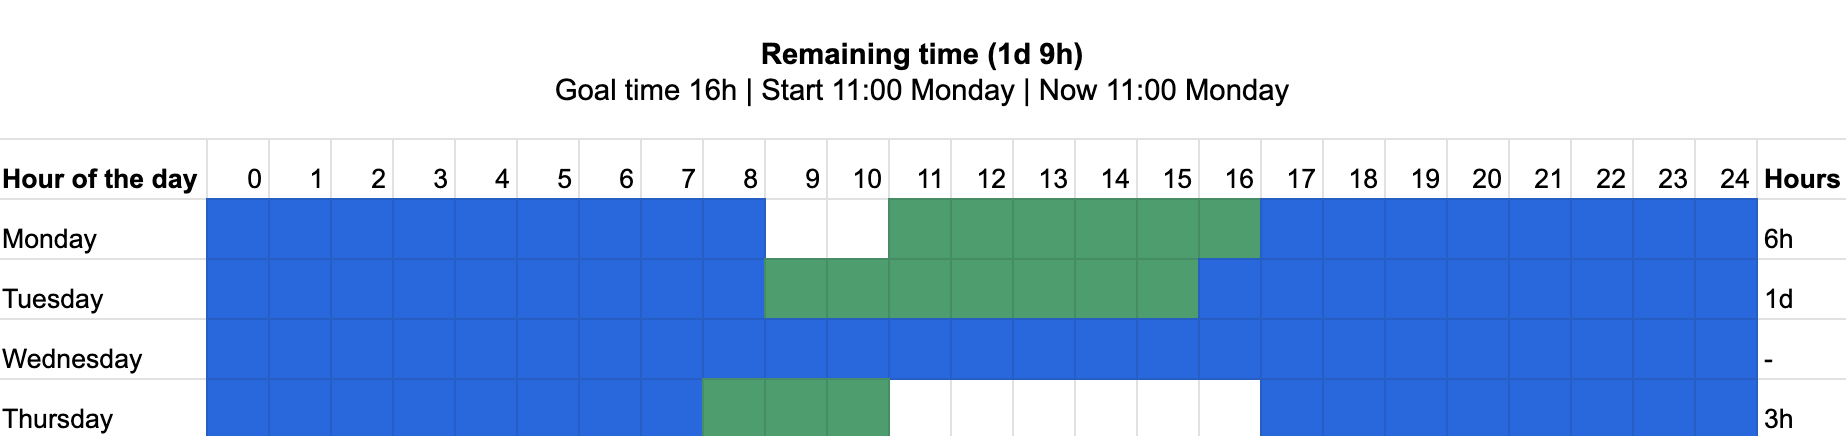
The table below shows how time is calculated for request type A, which has a goal time of 16 hours, with a start time of 11:00 on Monday, and working hours as follows:
- Monday 09:00-17:00
- Tuesday 09:00-16:00
- Wednesday not working
- Thursday 08:00-17:00
- Friday, Saturday, and Sunday, not working
| Remaining time | Description and screenshot |
|---|---|
| On Monday at 11:00 | Time started counting just now on Monday at 11:00. There’s a total of 1 day and 9 hours remaining with the following breakdown:
|
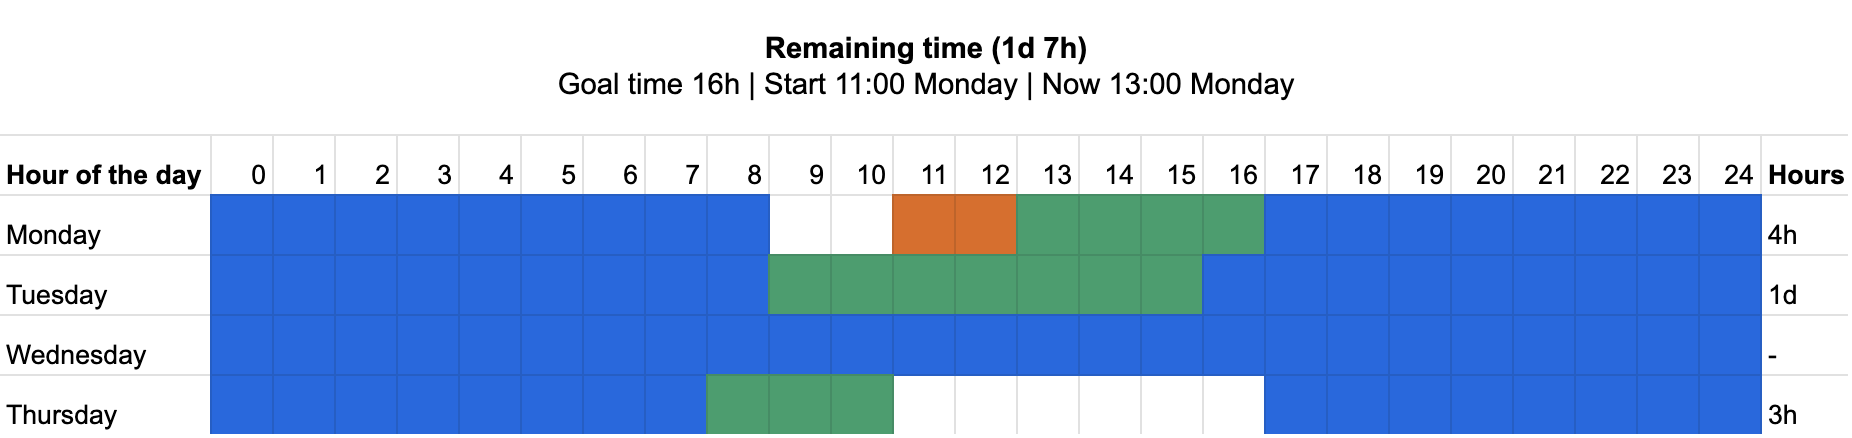
| On Monday at 1:00 | There’s a total of 1 day and 7 hours remaining with the following breakdown:
|
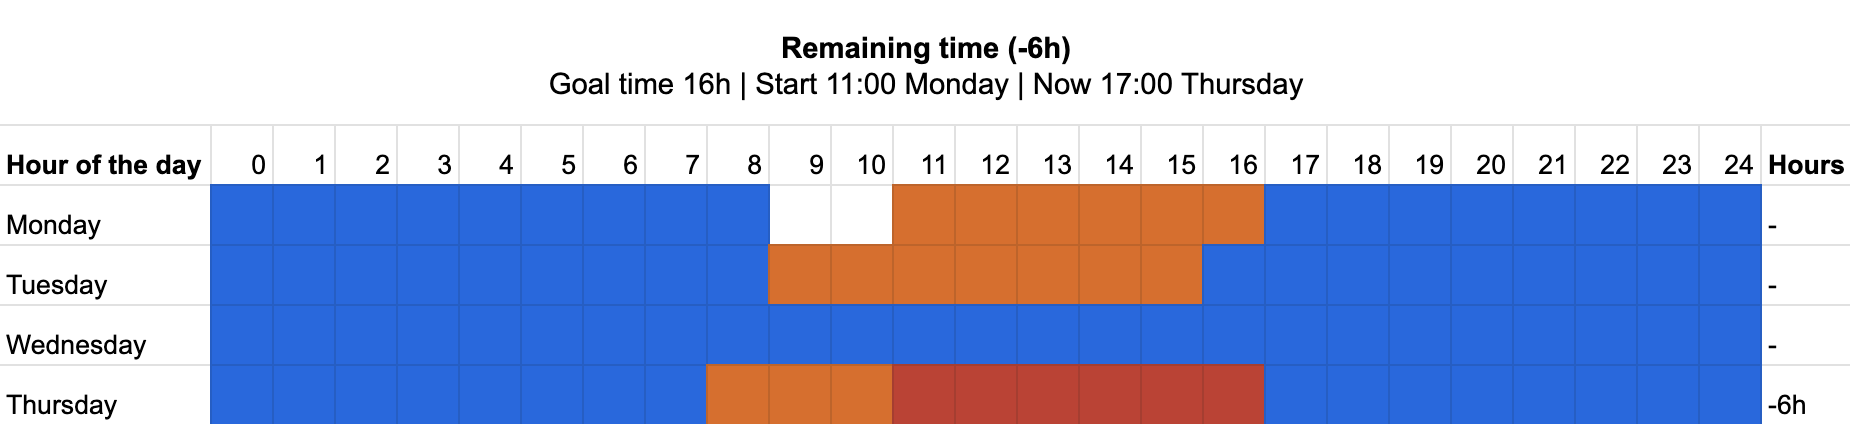
| On Thursday at 5:00 | The remaining time is -6 hours as the SLA has breached on Thursday at 11:00 and it has been 6 hrs since breach.
|
Legend (color codes) used in the screenshots on this page:
| Color | Description |
|---|---|
| White | Working time that is not counted in remaining time due to partial days |
| Blue | Non-working time |
| Green | Remaining time, SLA has not breached |
| Orange | Time passed from start of goal |
| Red | Time since SLA breached |
How time is calculated on partial days
In some situations, your agents might see time displayed as something like 1d 26h. This happens when time counting starts and stops for a period of less than a day (for example, 7 hours in an 8 hour working day).
All partial days are accumulated as hours and minutes, but not converted to 1 day, because the definition of a day will change depending on the working hours set in the calendar.
For example, request B has a goal time of 24 hours, with a start time of 10:00 on Monday, and working hours displayed in the diagram below. The goal is 1d 15h and the is due at 16:00 on Wednesday.
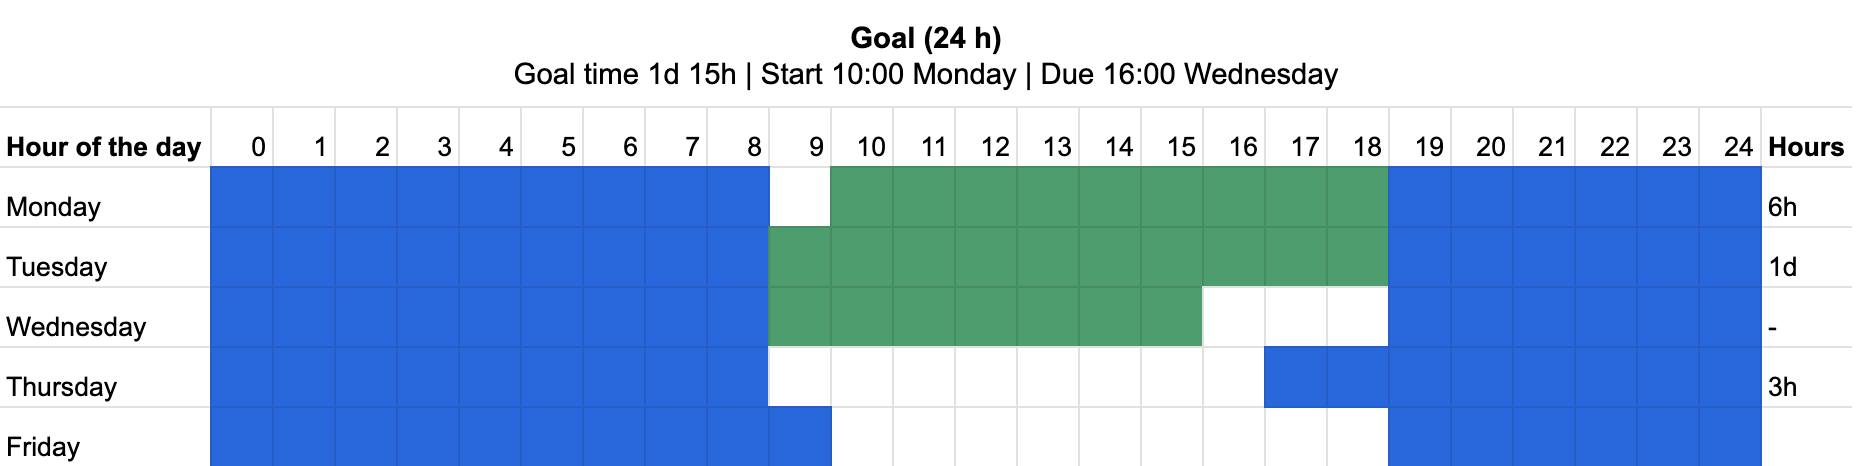
It works like this:
- From 10:00-18:00 on Monday is not a complete working day (according to the calendar). Total = 8 hours.
- From 09:00-18:00 on Tuesday is a complete working day (according to the calendar). Total = 1 day.
- From 09:00-16:00 on Wednesday ( due time) is not a complete working day (according to the calendar). Total = 7 hours.
8 hours + 1 day + 7 hours = 1d 15h