Cache Statistics
Caches help reduce the load on your database, and can make some operations faster. Track the size and hit ratio of each of Confluence's internal caches, and adjust the cache size for better performance.
On this page:
View cache statistics
To view cache statistics:
- Go to Administration menu
 , then General Configuration > Cache Management.
 - Select Show Advanced View to see the full details.
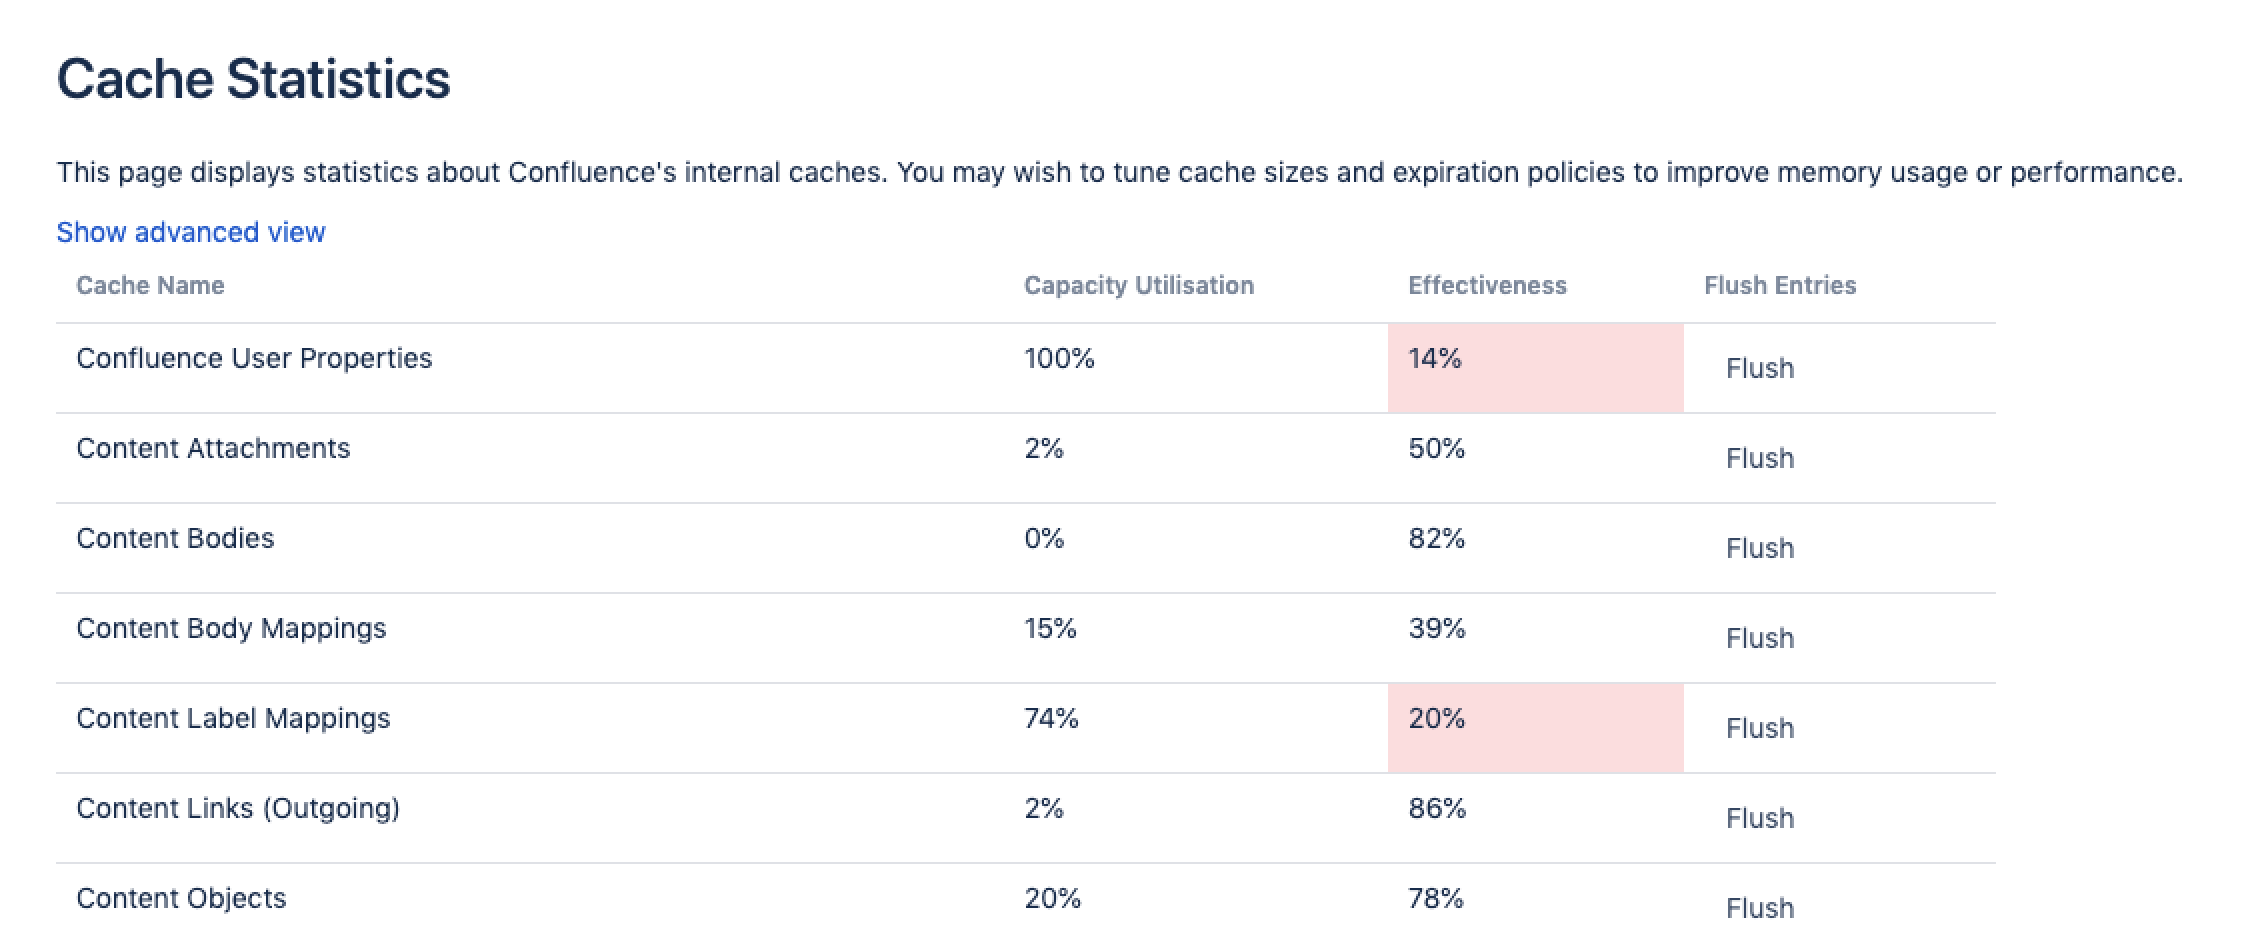
Screenshot: Cache statistics screen showing the utilisation and effectiveness of a selection of caches.
View cache statistics in a cluster
If you're running Confluence in a cluster, this screen shows the statistics for the node you're currently on.
To view cache statistics for another node in the cluster:
- Go to Administration menu , then General Configuration > Clustering.
- Select More options> Cache statistics next to the node you want to view.

You will only be able to view the statistics. To flush a cache or adjust the size, you'll need to access the Cache Management screen on each node directly.
What the statistics mean
Here's some information on how each number is generated.
Capacity Utilization | =(Objects)/(Size) For example Percent Used = 4023 / 5000 = 80% |
|---|---|
Effectiveness: | =(Hits)/(Hits + Misses) For example Effectiveness = 374550 / (374550 + 140460) = 73% |
Current / Max Entries | The number of entries in the cache / the number of total possible entries allowed (this is the size of the cache). |
| Current Heap Size | Heap memory (in MB) allocated to this cache (if applicable) |
Hit / Miss / Evicted | The number of reads accessing cache where required content was found / the number of reads accessing cache where required content was not found / the number of objects evicted from the cache. |
Adjust Size | Use this option to specify a different maximum cache size. |
Flush | Flushes the cache. |
Cache types
When running in a cluster, Confluence has three types of caches:
- local - cache data is replicated on each node.
- distributed - cache data is evenly partitioned across all Confluence nodes in the cluster (known as replicate-via-copy).
- hybrid - cache data is replicated on each node, and invalidated remotely by other nodes when things change (known as replicate-via-invalidation).
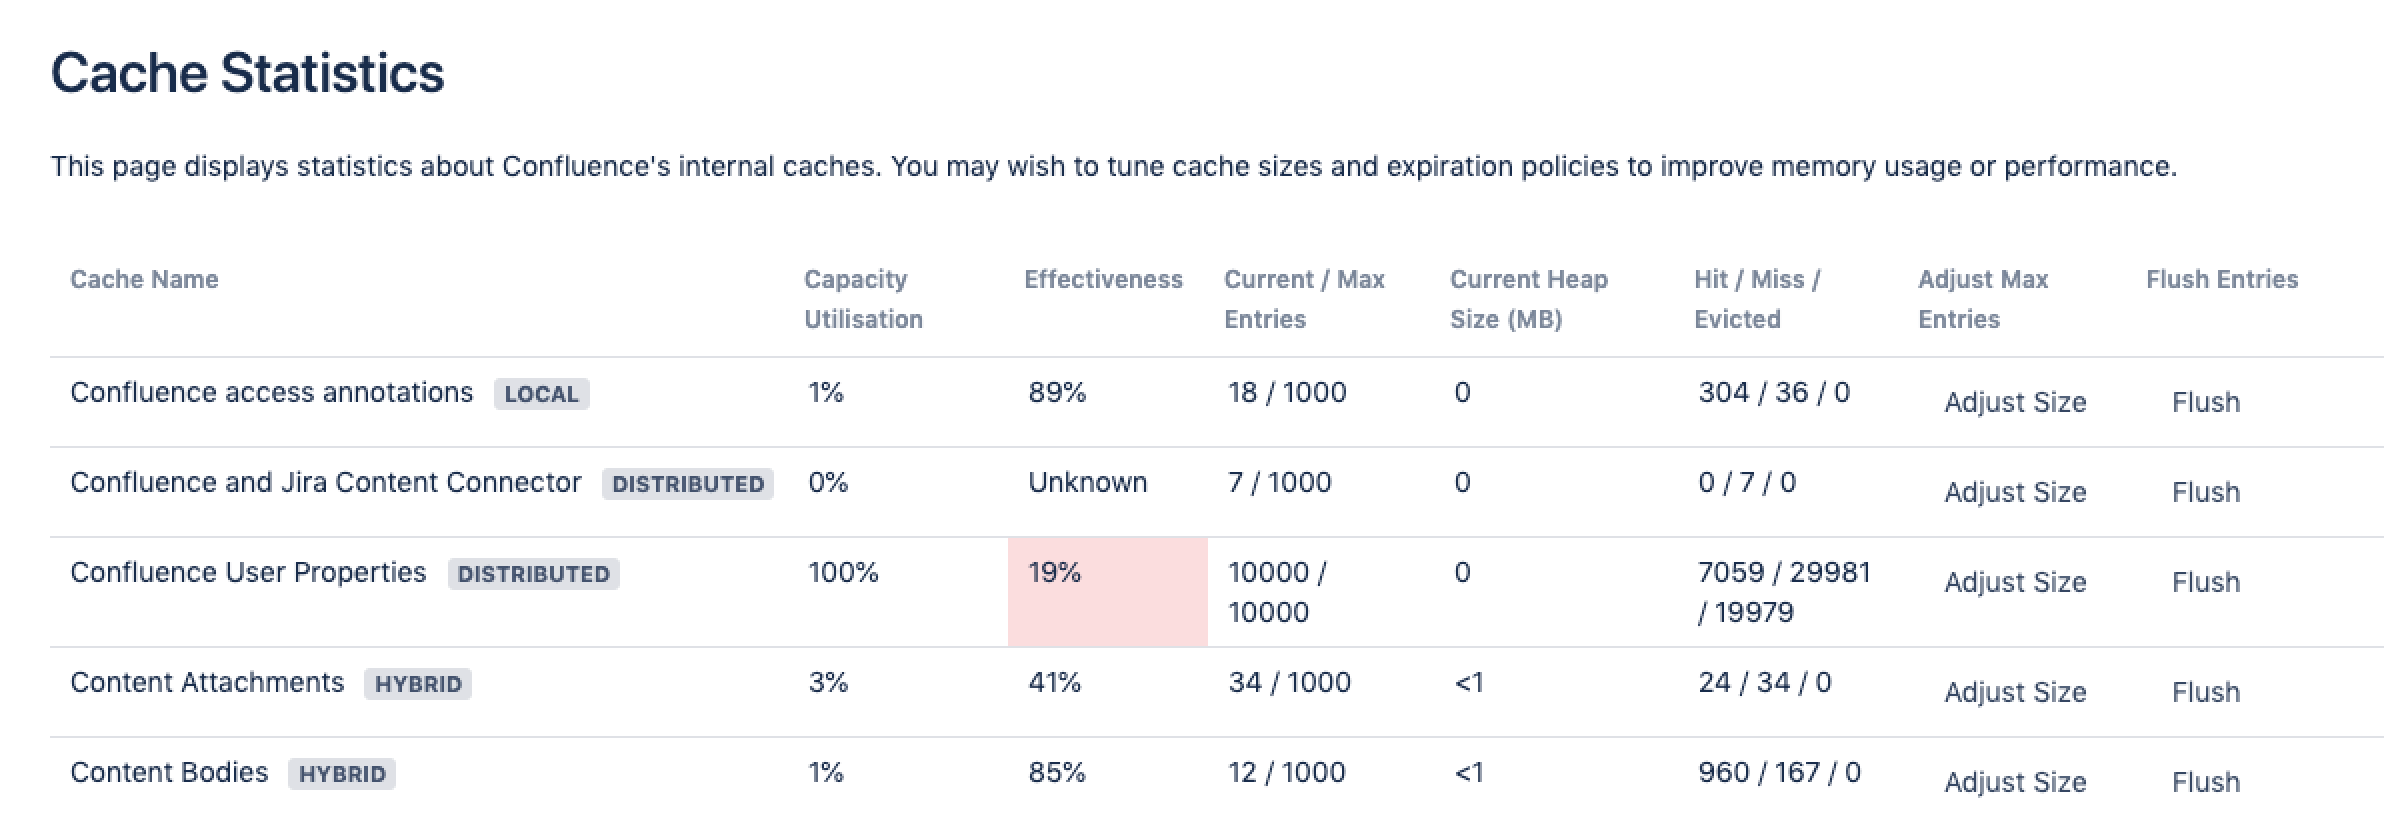
The cache type is indicated with a lozenge beside the cache name in the advanced view.
Screenshot: Cache statistics advanced view showing the full details of each cache, including the cache type.
Change the size of a cache
Tuning the size of a cache can speed up Confluence (if the caches are too small), or reduce memory (if the caches are too large). Larger caches will require more memory at runtime, so make sure you review the memory allocation of the Confluence Java process and the physical memory available on your server.
You need System Administrator global permission to change the size of a cache.
To change the size of a cache:
- Go to Administration menu , then General Configuration > Cache Management.
- Select Show Advanced View.
- Select Adjust Size next to the cache you want to change.
- Enter the maximum number of items to be stored in the cache and select Submit.
The changes will take effect immediately. You don't need to restart Confluence.
Any changes to cache sizes are recorded in:
<home-directory>/shared-home/config/cache-settings-overrides.propertiesif you run Confluence on a single server.-
<shared-home>/config/cache-settings-overrides.propertiesif you run Confluence in a cluster.
To reset the values back to the default, you can delete the cache-settings-overrides.properties file and restart Confluence.
See Performance Tuning for a more general overview of tuning in Confluence.