Query user names for managed and unmanaged accounts
The “Account” table in the Atlassian Data Lake includes data for both managed and unmanaged accounts in your Atlassian organization. The steps laid out below show how you can bring in user names for accounts in your Atlassian organization.
Querying user names
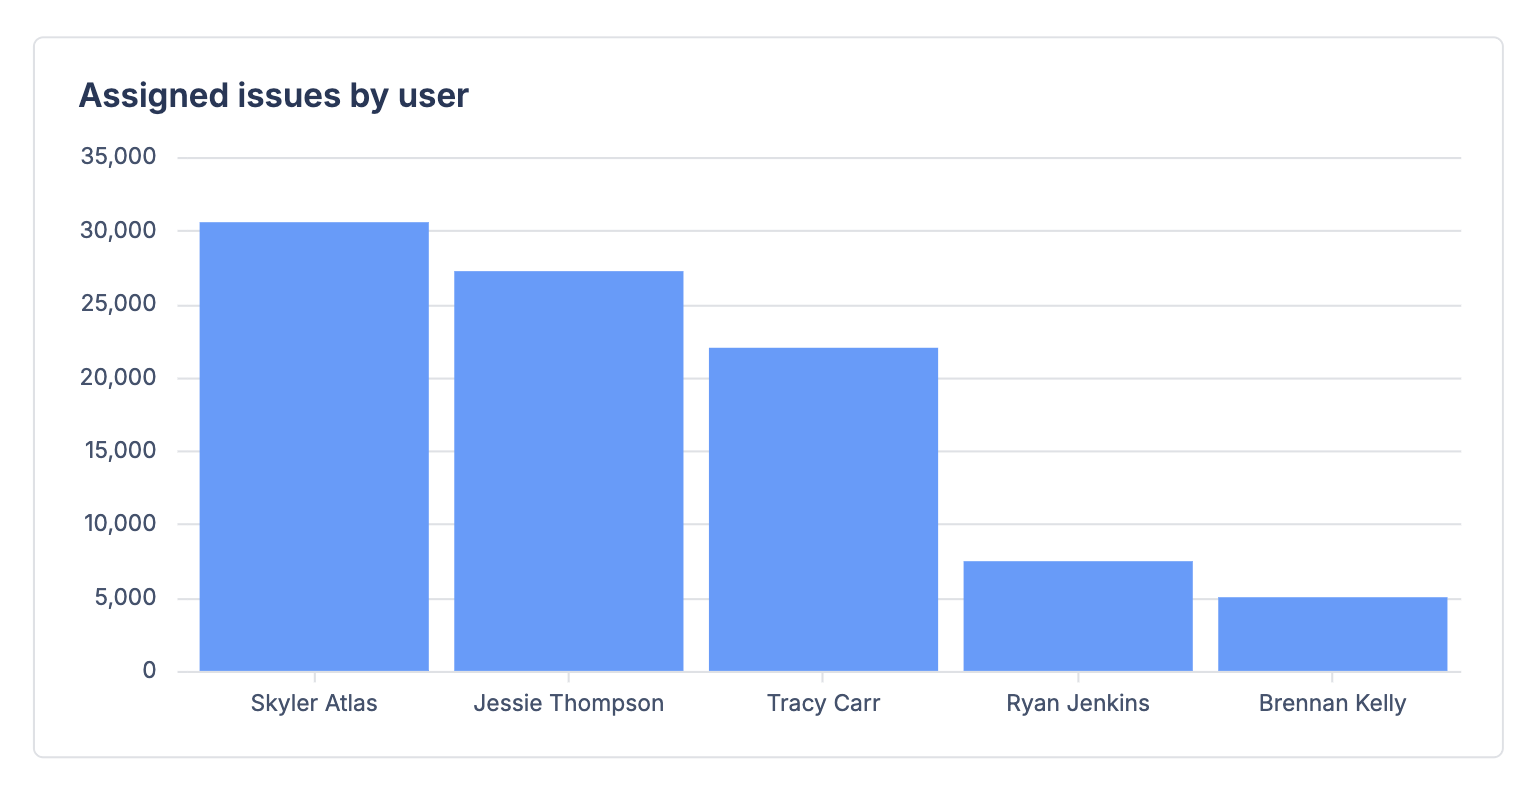
In this example, we’ll build a chart that displays a count of Jira issue’s assigned to users in our Atlassian organization.
From your dashboard, select Add chart to enter the Visual SQL chart editor.
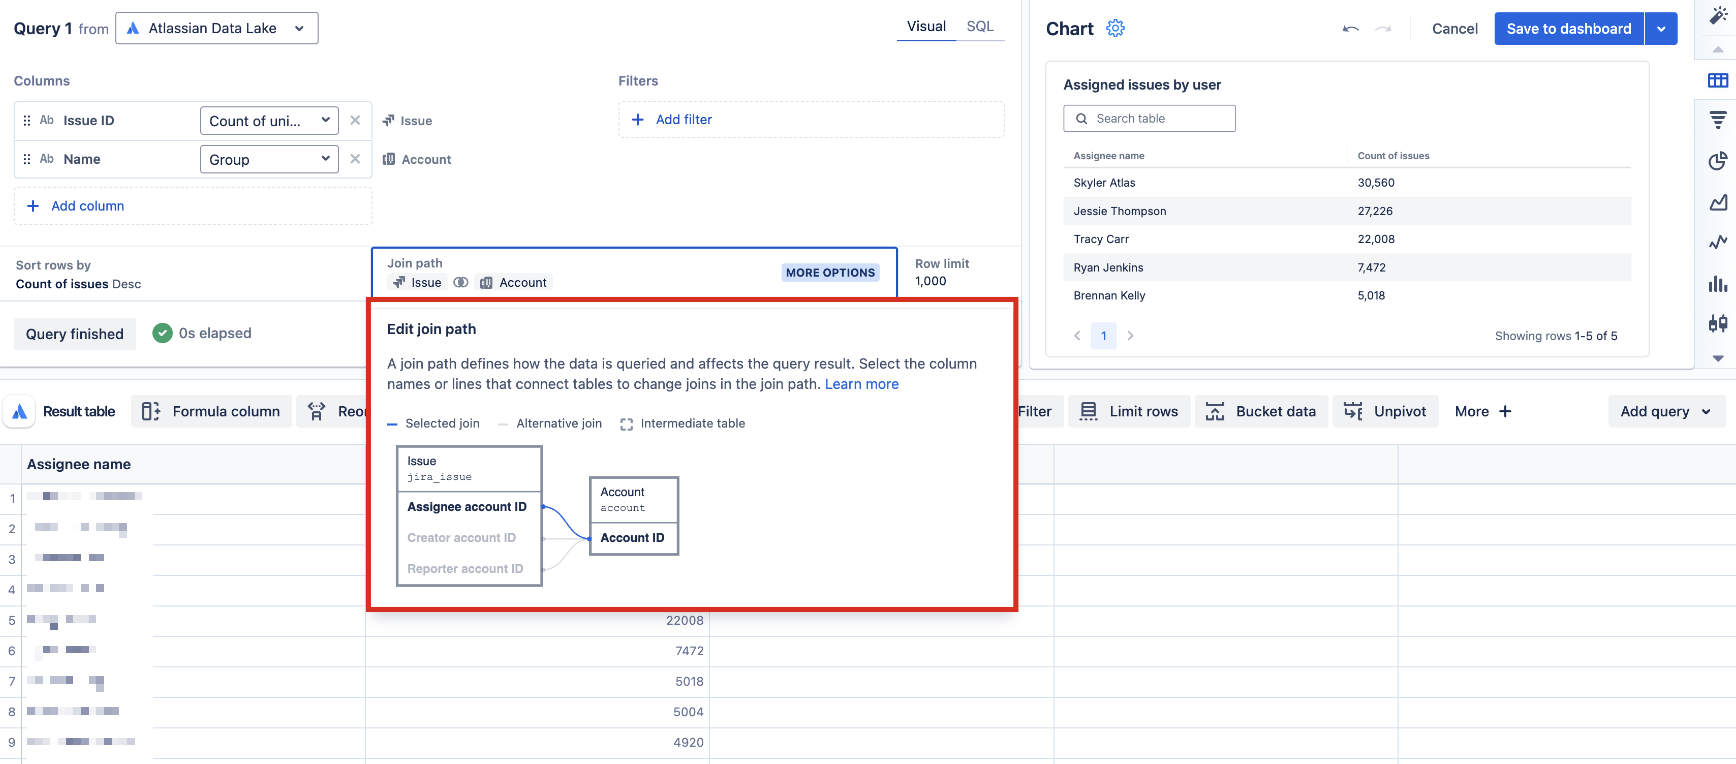
The visual mode query should bring in the Assignee names for users in your organization, and a count of unique issue ID’s assigned to them. To do this, add the following columns to the query:
Group the “Name” column from the Organization “Account” table
Count of Unique “Issue ID” from the Jira “Issue” table
Before running the query, check the join path to ensure that
jira_issuetable andaccounttable are being joined on the “Assignee account id” and “Account id” columns:The join path defines how the data is queried and affects the query result. If you were to edit the join path to use the “Reporter account ID” column, then the query would return a count of issues reported by each user. Similarly, if you edit the join path to use the “Creator account ID” column, then the query would return a count of issues created by each user.
- Once the correct join path is confirmed, select Run query.
- Optionally rename the two columns for clarity. In this example, we rename “Name” to “Assignee name”, and “Count of unique Issue Issue ID” to “Count of issues”.
- Optionally sort the rows by “Count of issues” descending to show users with the most issues assigned to them at the top.
- Add a filter step to exclude rows matching all conditions where “Assignee name” is null.
- Optionally, limit the rows to show only the top five users with the highest count of issues assigned to them.
- Select Save to dashboard.

