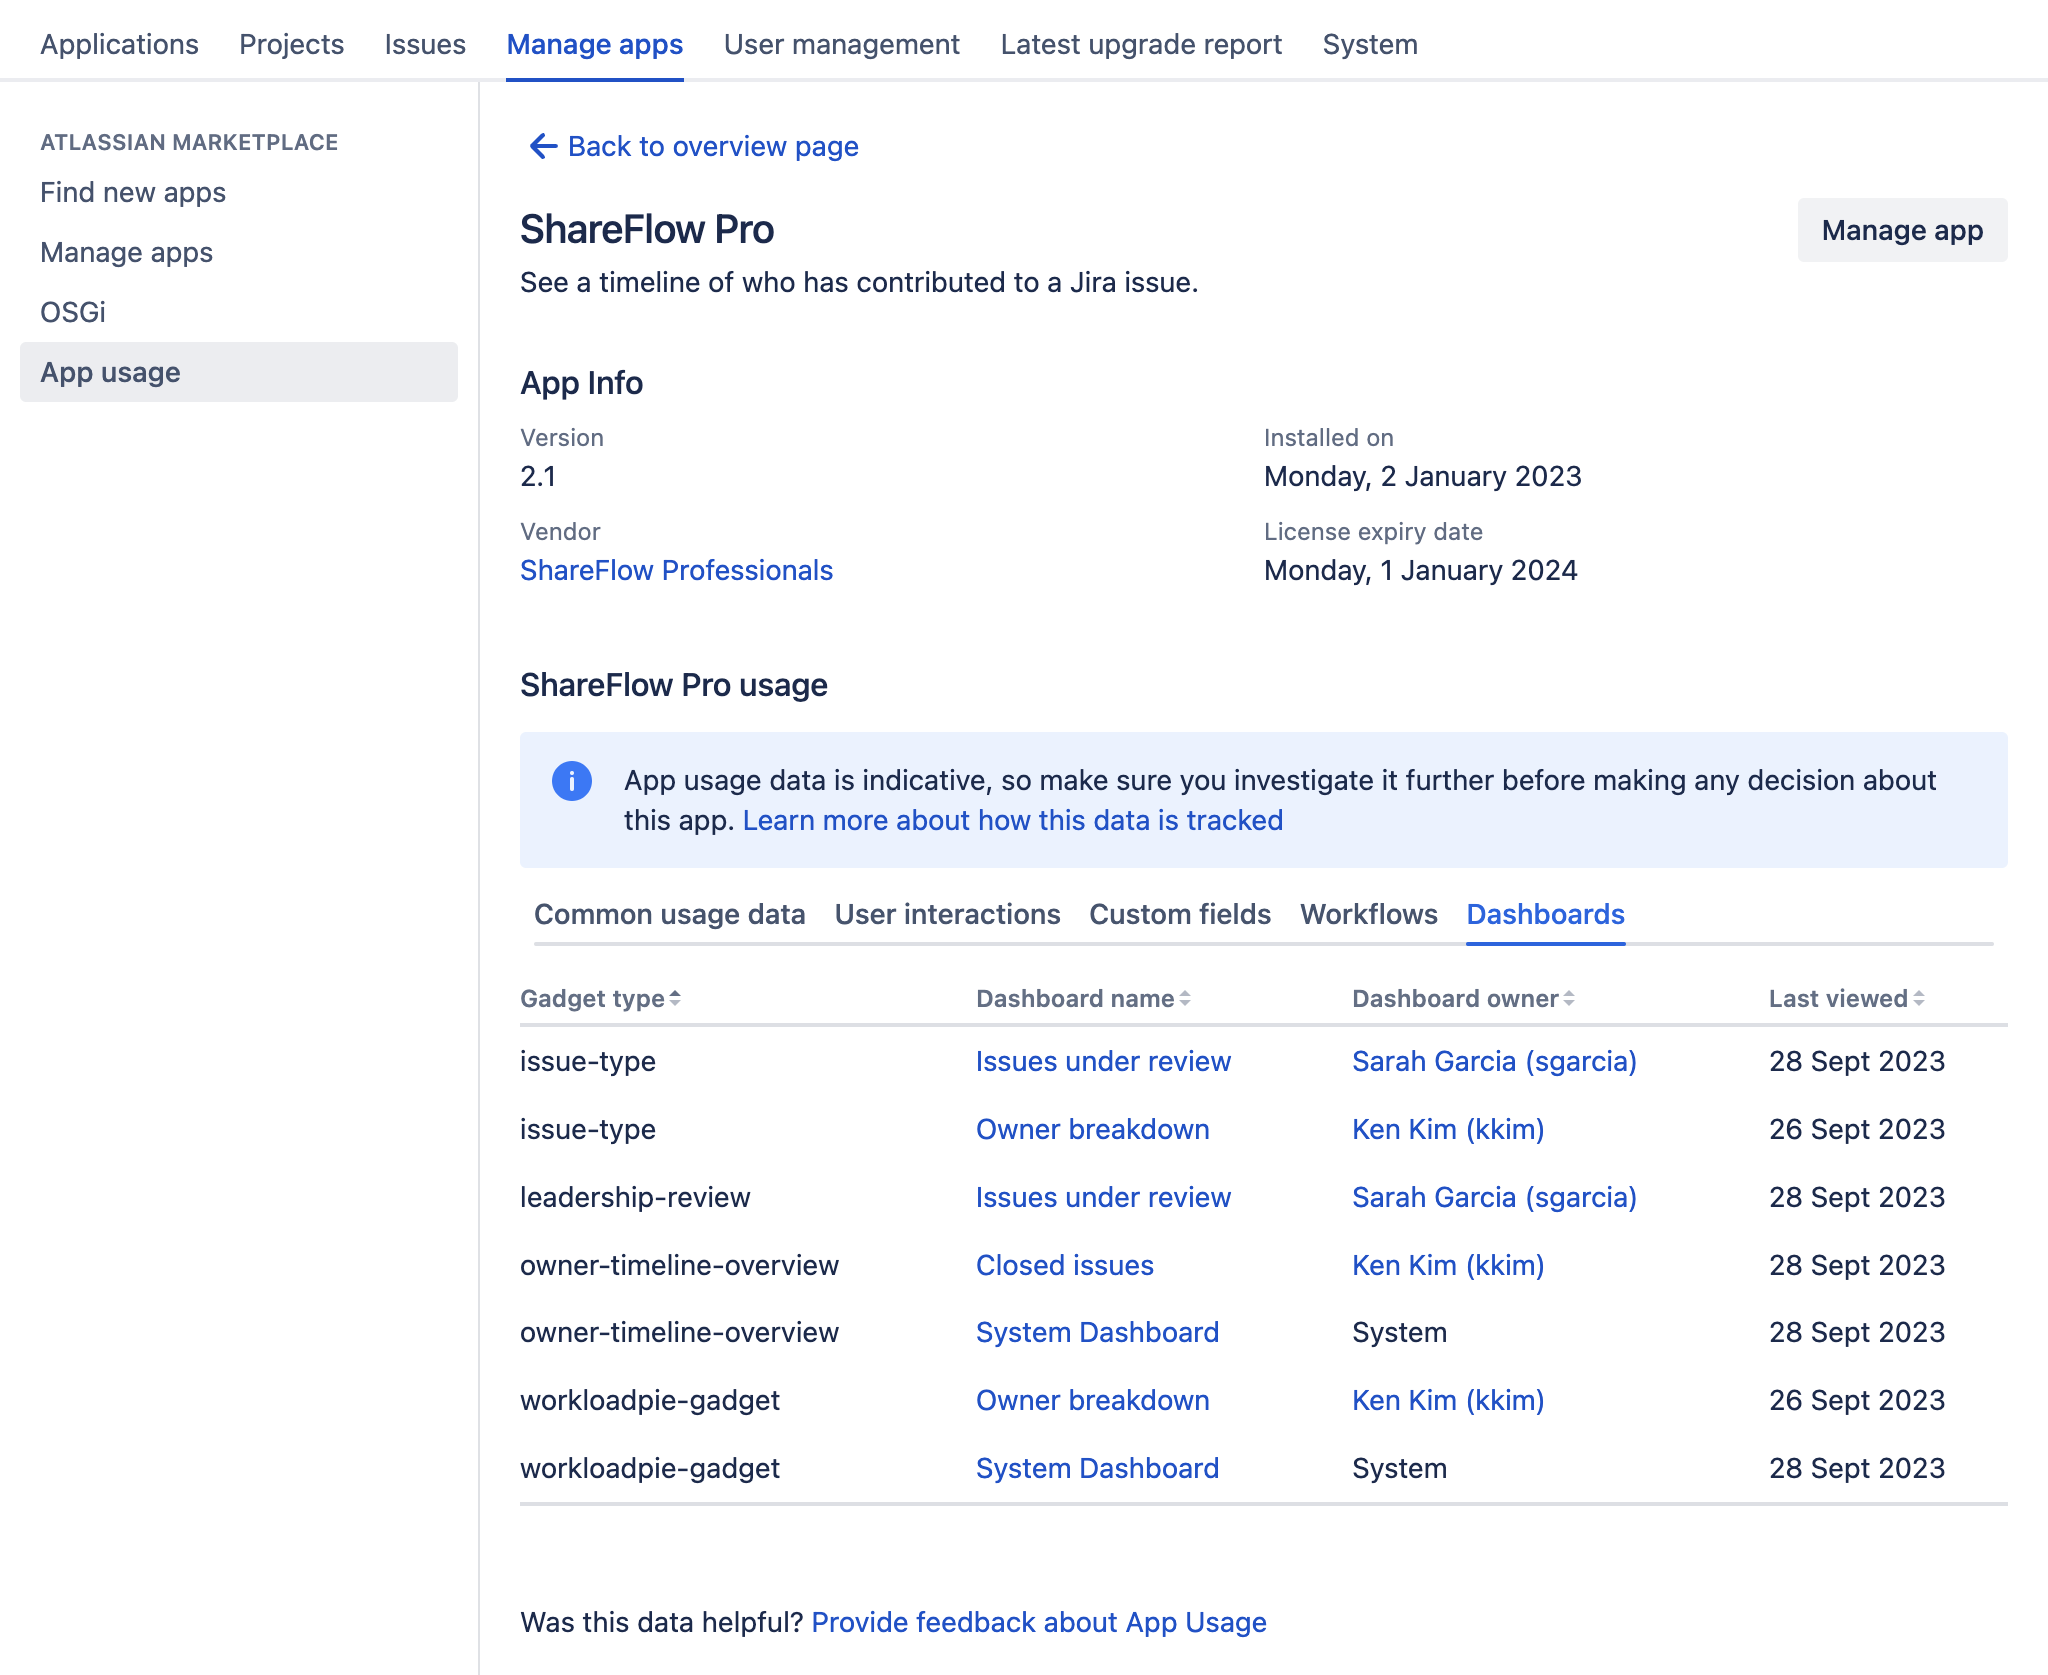
Explore App Usage
Common usage data tab
The Common usage data tab is split into sections:
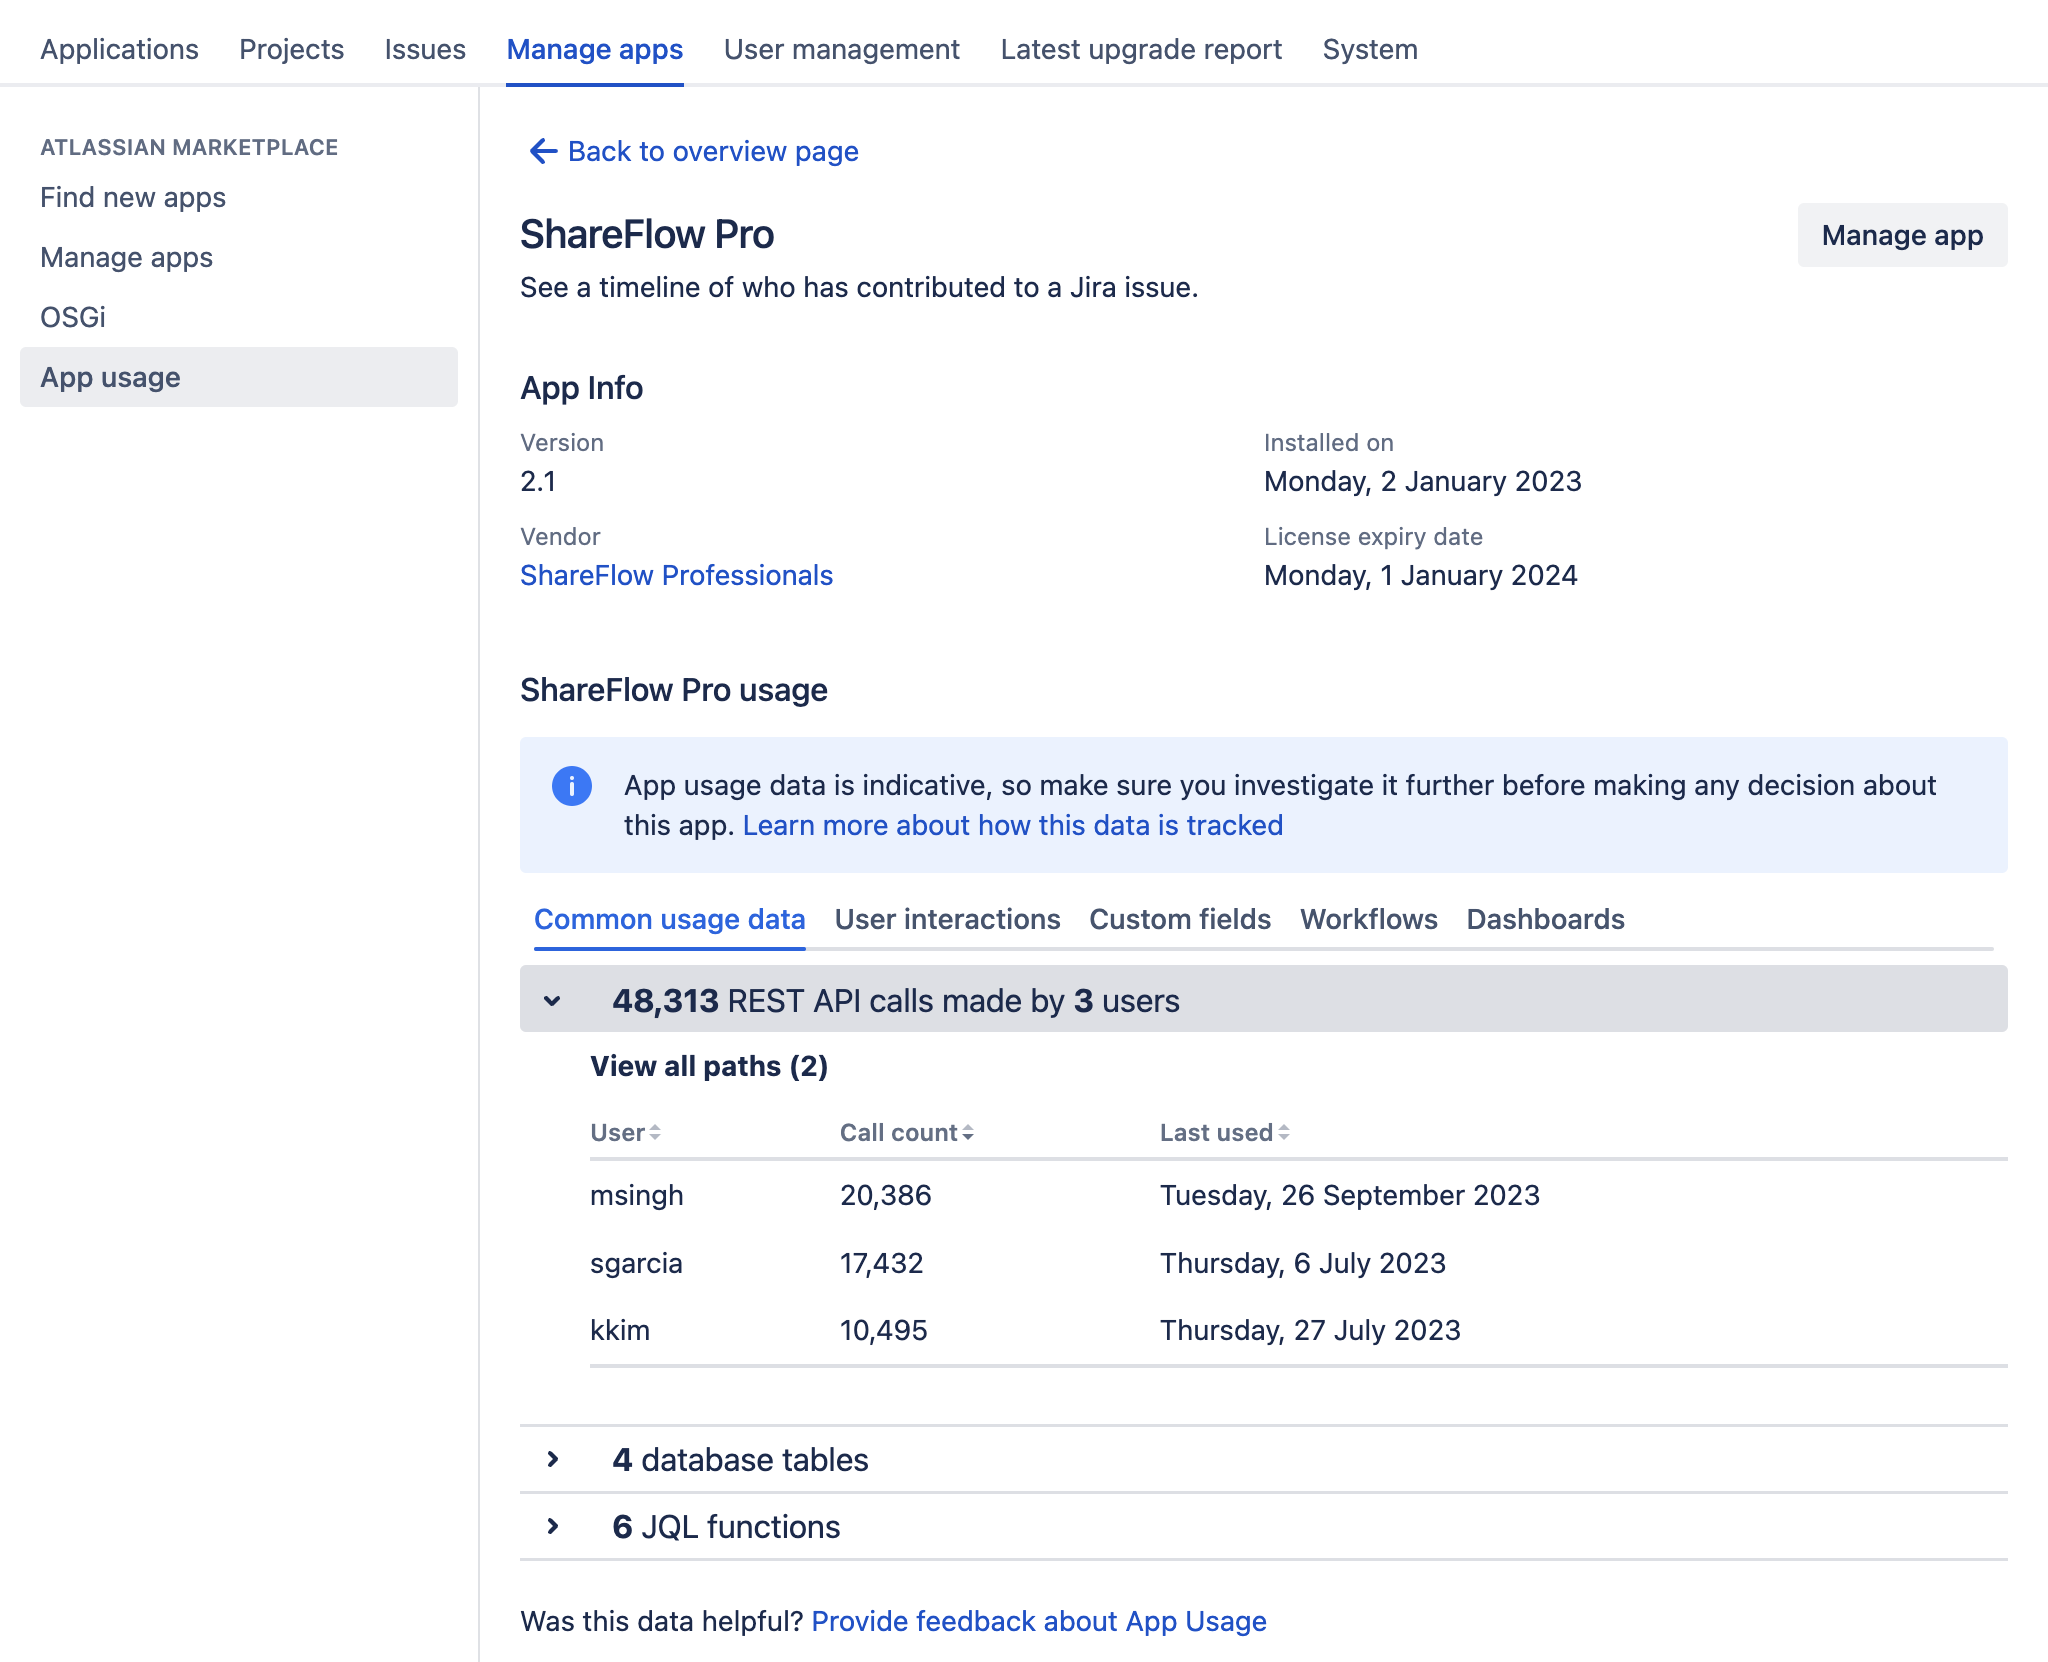
REST API usage
Database tables
JQL function
REST API usage
From version 1.5.0, App Usage tracks the usage of REST APIs added by your apps.
When an app implements the REST plugin module, this section will display any calls made via that module. This REST API usage section can't capture calls that aren’t made specifically to that REST plugin module, such as external calls. In addition, in some rare cases where app vendors have chosen to use servlets for REST APIs, you may see REST API usage on the User interactions tab.
If a REST API path changes, App Usage will display only the most recent path. It will still display usage data from the old path combined with usage data from the new path. The latest data is collected every five minutes.
The following table describes what each column means for each row of data.
Term | Description |
|---|---|
X REST API calls made by X users | The total number of REST API calls made, and how many users made them since tracking began. Note that tracking only begins after you’ve installed and enabled App Usage. It therefore can’t display data about any API calls from the days, weeks, and months before App Usage was enabled. |
User | Any person who intentionally or unintentionally interacted with this app’s REST API. |
Call count | The number of times this particular user has made this particular API call. |
Last used | The last time this particular user made this particular API call. |
Disable REST API tracking
You can use a feature flags to disable or re-enable this feature. Learn more about feature flags in App usage for Jira.
Database tables
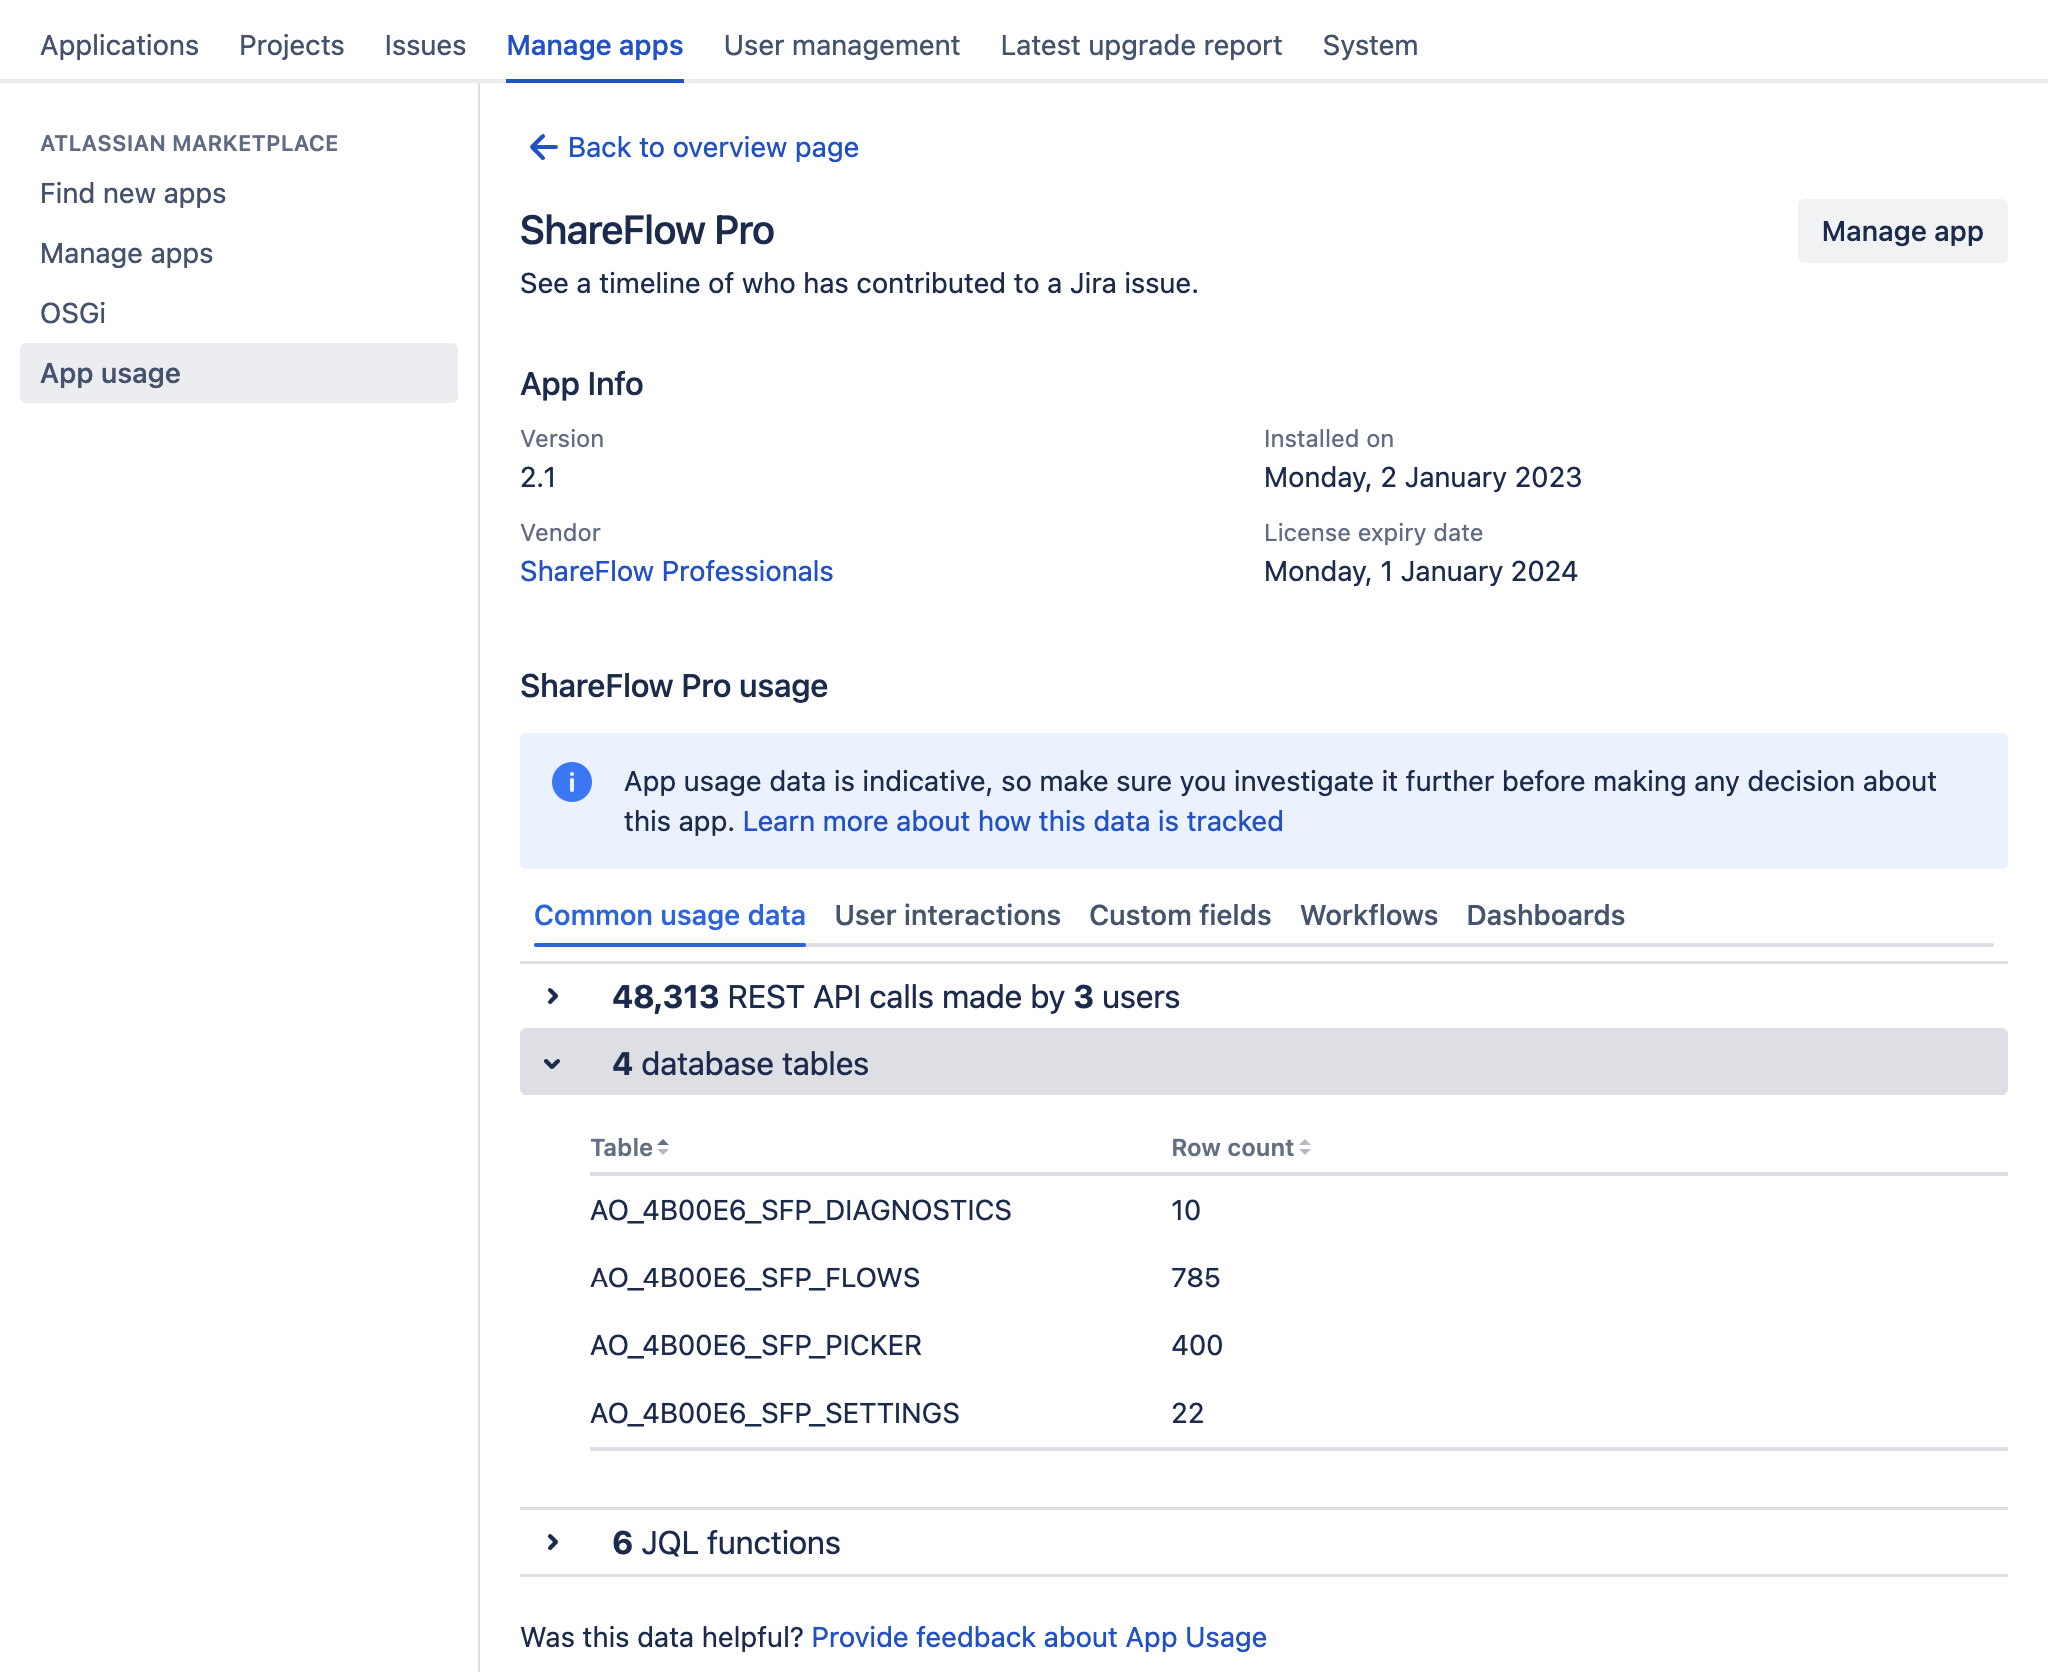
You can see how many tables an app has introduced, along with a snapshot of the current number of rows. App Usage shows the tables implemented via the Active Objects framework only. If an app uses Active Objects tables that it hasn’t defined or a different data persistence platform, the tables won’t be displayed.
The following table describes what each column means for each row of data.
Term | Description |
|---|---|
X database tables | The total number of database tables an app has introduced. |
Table | The name of this particular table. |
Row count | The current number of rows in this particular table. Note that this may take a few minutes or hours to refresh when the row count changes. |
Jira Query Language (JQL) functions
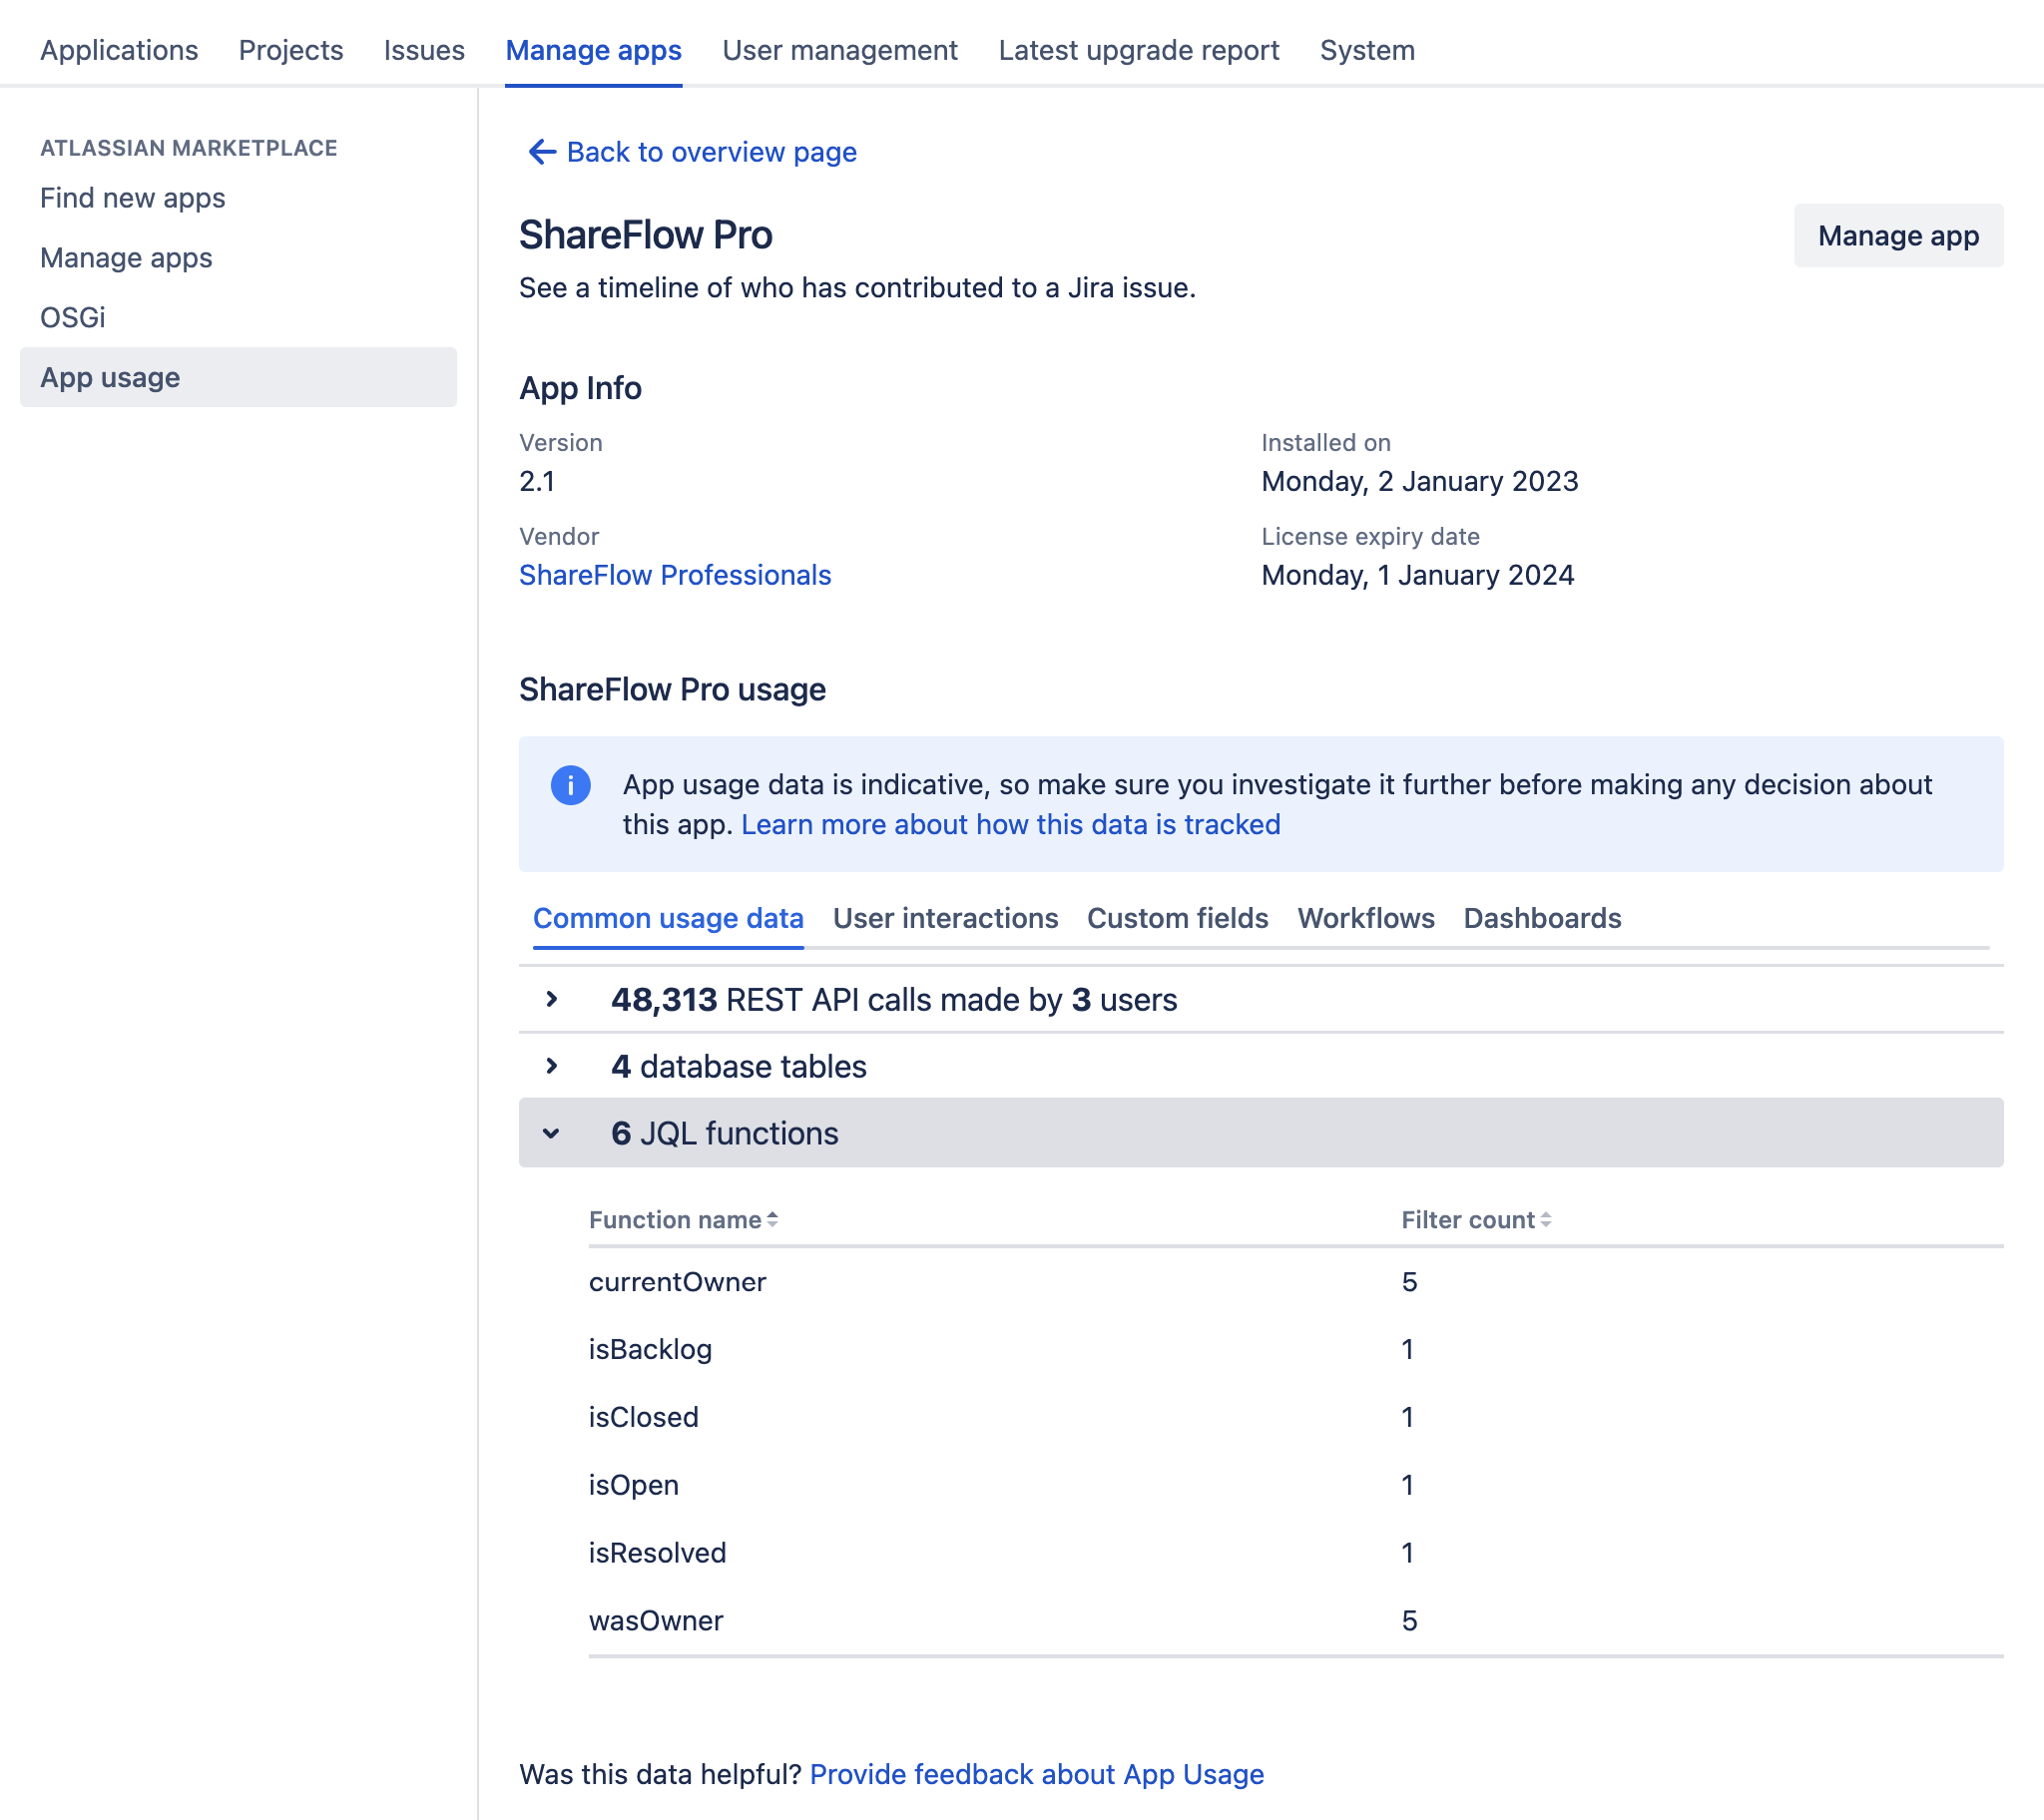
JQL functions are designed to enhance the search capabilities of Jira. This table outlines their names and how many search filters have been created using the custom JQL functions that the app has introduced. Note this doesn't track manual searches using the JQL functions.
You can view all saved filters via this URL:<BASE_URL>/secure/admin/filters/ViewSharedFilters.jspa
The following table describes what each column means for each row of data.
Term | Description |
|---|---|
X JQL functions | The total number of JQL functions an app has introduced. |
Function name | The name of this particular function. |
Filter count | The number of filters that this particular function has been saved in. |
JQL functions with the same name
Currently, if two apps introduce a JQL function with the same name, the usage of the function will count towards both even though only one JQL function is being used in reality. Be careful when you evaluate JQL function usage and compare different apps to look for potential conflicts.
User interactions tab
The User interactions tab is split into sections:
Page module views
Web panels (note that this has been deactivated in 1.7.2 and removed in 1.8.5)
Page module views
The Page module views section is available from version 1.6.1 (with entry points added in 1.8.0). It shows the number of pages an app has introduced that have had one or more views. For each field, it displays which servlet/WebWork action and path that page belongs to, how many times and how many users viewed the pages, and when it was last viewed. The latest data is collected every five minutes.
The following table describes what each column means for each row of data.
Term | Description |
|---|---|
X page module views | The total number of views of all page modules since tracking began. |
Page module | The servlet/WebWork action name. If an app vendor doesn’t include a dedicated name, App Usage will display its description, if it exists. If neither exists, it will display its key. |
Entry points | A list of links to this page module. It includes the display text of the link and its location within Jira. |
Path | The partial path pattern of the viewed page. The asterisk (*) means it could be any word or character; for example, |
Views | The total number of visits to this particular page module. If a page module has never been viewed, it won’t be displayed in this list. |
Unique views | The total number of unique user views for this particular page module. Note that if anonymous views are allowed, all anonymous views of this particular page module will be treated as one user. |
Last viewed | The date when this particular page module was last viewed. |
Disable page view tracking
You can use a feature flags to disable or re-enable this feature. Learn more about feature flags in App usage for Jira.
Web panels
We recommend you update your version to 1.8.0, where we have reintroduced web panel action tracking as an opt-in feature. You can still, by default, see web panel views, and this won’t cause any breakages. You can opt in via the Web Panels section of the UI. We recommend you check for UI elements that may break after enabling the feature. If issues do arise, you will be able to turn off the feature via the Web Panels section of the UI immediately.
The Web panels section shows user interactions with web panels that an app has introduced. Sometimes, web panels are grouped together (for example, when an app developer has provided the same template file — such as a soy or velocity file — for multiple web panels, which leads to technical challenges).
Although this section is useful for monitoring the adoption rate and frequency of an app’s web panel, if the web panel is not interactive, it is unlikely to show any user interactions.
For example, web panels that are static, embedded, or represent a class may not include any interactivity. In these cases, App usage will display a dash to indicate that this information is not tracked. In contrast, web panels that are interactive but haven’t had any interactions will display a count of zero, and their empty date fields will display a dash.
The latest data is collected every five minutes.
The following table describes what each column means for each row of data.
Term | Description |
|---|---|
Name | The web panel name. If an app vendor doesn’t include a dedicated name, App usage will display its description, if it exists. If neither exists, it will display its key. If two or more web panels share the same resource location file, the web panels will be grouped in this table, as there’s no way to determine individual web panel interactions. |
Location | The section of the screen that the web panel appears within. |
Actions | The total number of user interactions with this particular web panel. Not all web panels are clickable or tapable, so some web panels might not show any interactions (unless a user clicks on the area, which will be counted as an interaction even if it doesn’t do anything). If a user clicks or taps on the same web panel more than once while a page is open, it's counted as a single interaction. If a user refreshes the screen, or visits another page and then returns to the first page, any further clicks or taps will be counted as one more interaction. Note that anonymous users are not counted. |
Unique actions | The total number of unique users who have interacted with this particular web panel. Note that anonymous users are not counted. |
Last actioned | The date when this particular web panel was last interacted with. |
Views | The total number of views for this particular web panel. If a web panel has never been rendered on screen (due to a display condition or invalid permissions, for example), it won’t be displayed in this list. |
Unique views | The total number of unique user views for this particular page module. Note that all anonymous views of this particular web panel will be treated as one user view. |
Last viewed | The date when this particular web panel was last viewed. |
Disable web panel tracking
In versions 1.8.0 to 1.8.3, you can use the button shown on the Web Panels section of the User Interactions tab to enable or disable web panel tracking. Note that web panel tracking was removed in 1.8.5 to ensure a more robust implementation at a later date.
You can also use a feature flags to disable or re-enable this feature in all versions of App Usage for Jira. Learn more about feature flags in App usage for Jira.
Custom fields tab
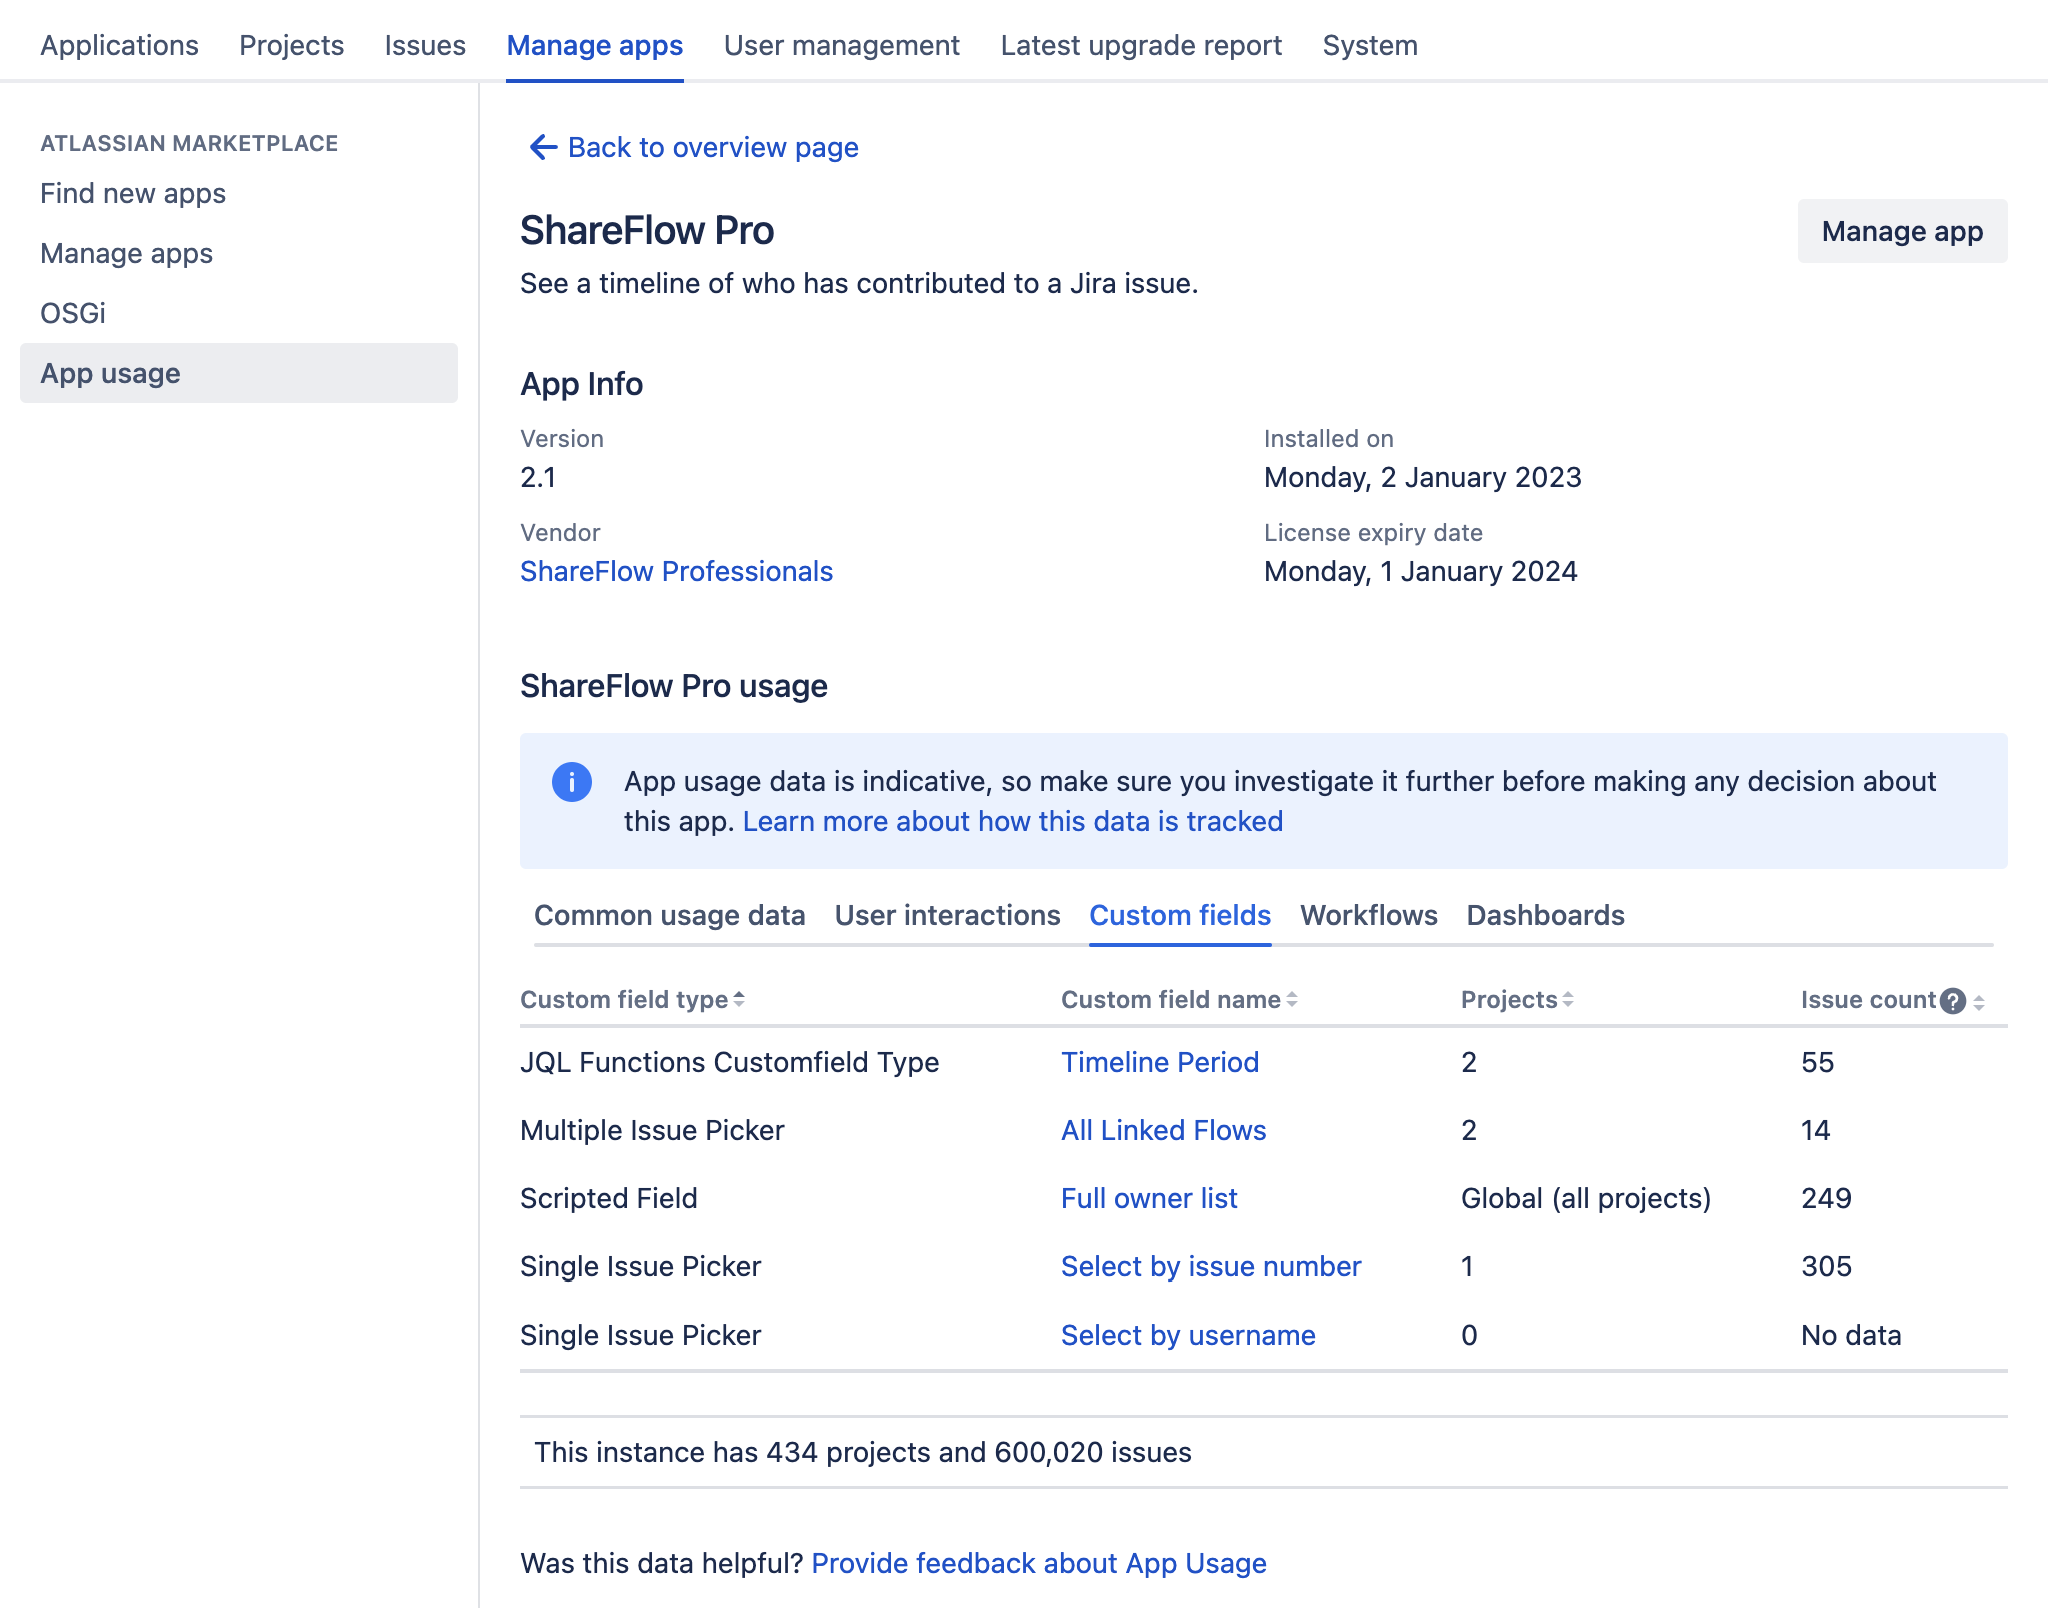
The Custom fields tab shows how many custom typed custom fields are introduced by an app. Note that these are the field types introduced by an app, and not what an app is interacting with. For example, an app can use many custom fields within Jira, but this is not tracked: this table shows only the custom field types that will most likely stop working if you remove or disable an app.
The following table describes what each column means for each row of data.
Term | Description |
|---|---|
Custom field type | The field type of this particular custom typed custom field. |
Custom field name | The name of this particular customer typed custom field. |
Projects | The total number of projects the custom field is enabled for. If Global (all projects) is displayed, the custom field is enabled for all projects. |
Issue count | he total number of issues that have a value for this field. For example, if this field is displayed on ten issues, but only two issues include a value in this field, the count would be 2. |
Workflows tab
Apps may introduce conditions, validators, and post functions, which enhance the way issues move through workflows. The Workflows tab shows a list of workflows, and how many times the conditions, validators, and post functions introduced by an app are used by the workflows.
The following table describes what each column means for each row of data.
Term | Description |
|---|---|
Active workflow | The name of this particular workflow. Select it to go to the workflow diagram. |
Transition (ID) | The name and the ID of the transition where this app has introduced any conditions, validators, or post functions. |
Conditions | The number of conditions introduced by this app on this transition. See Configure advanced issue workflows | Atlassian Support for more information. |
Validators | An app might have just one validator, but may use it hundreds of times across various workflows. We show the number of times it’s used. This column shows the number of validators introduced by this app on this transition. See Configure advanced issue workflows | Atlassian Support for more information. |
Post functions | The number of post functions introduced by this app on this transition. See Configure advanced issue workflows | Atlassian Support for more information. |
Dashboards tab
Dashboards can include gadgets, which are panels of information. The Dashboards tab outlines the names of the gadgets that the app has introduced, and which dashboards they're being used in. The latest data is collected every 10 minutes.
The following table describes what each column means for each row of data.
Term | Description |
|---|---|
Gadget type | The identity of this particular gadget introduced by this app. |
Dashboard name | The name of the dashboard that contains this particular gadget. |
Dashboard owner | The name of the person who owns the dashboard that contains this particular gadget. |
Last viewed | The date when this particular dashboard was last viewed. Wallboard views are not included. This field is available from version 1.7.0. |
Disable dashboard view tracking
You can use a feature flags to disable or re-enable this feature. Learn more about feature flags in App usage for Jira.
