Generate a time series in Visual SQL
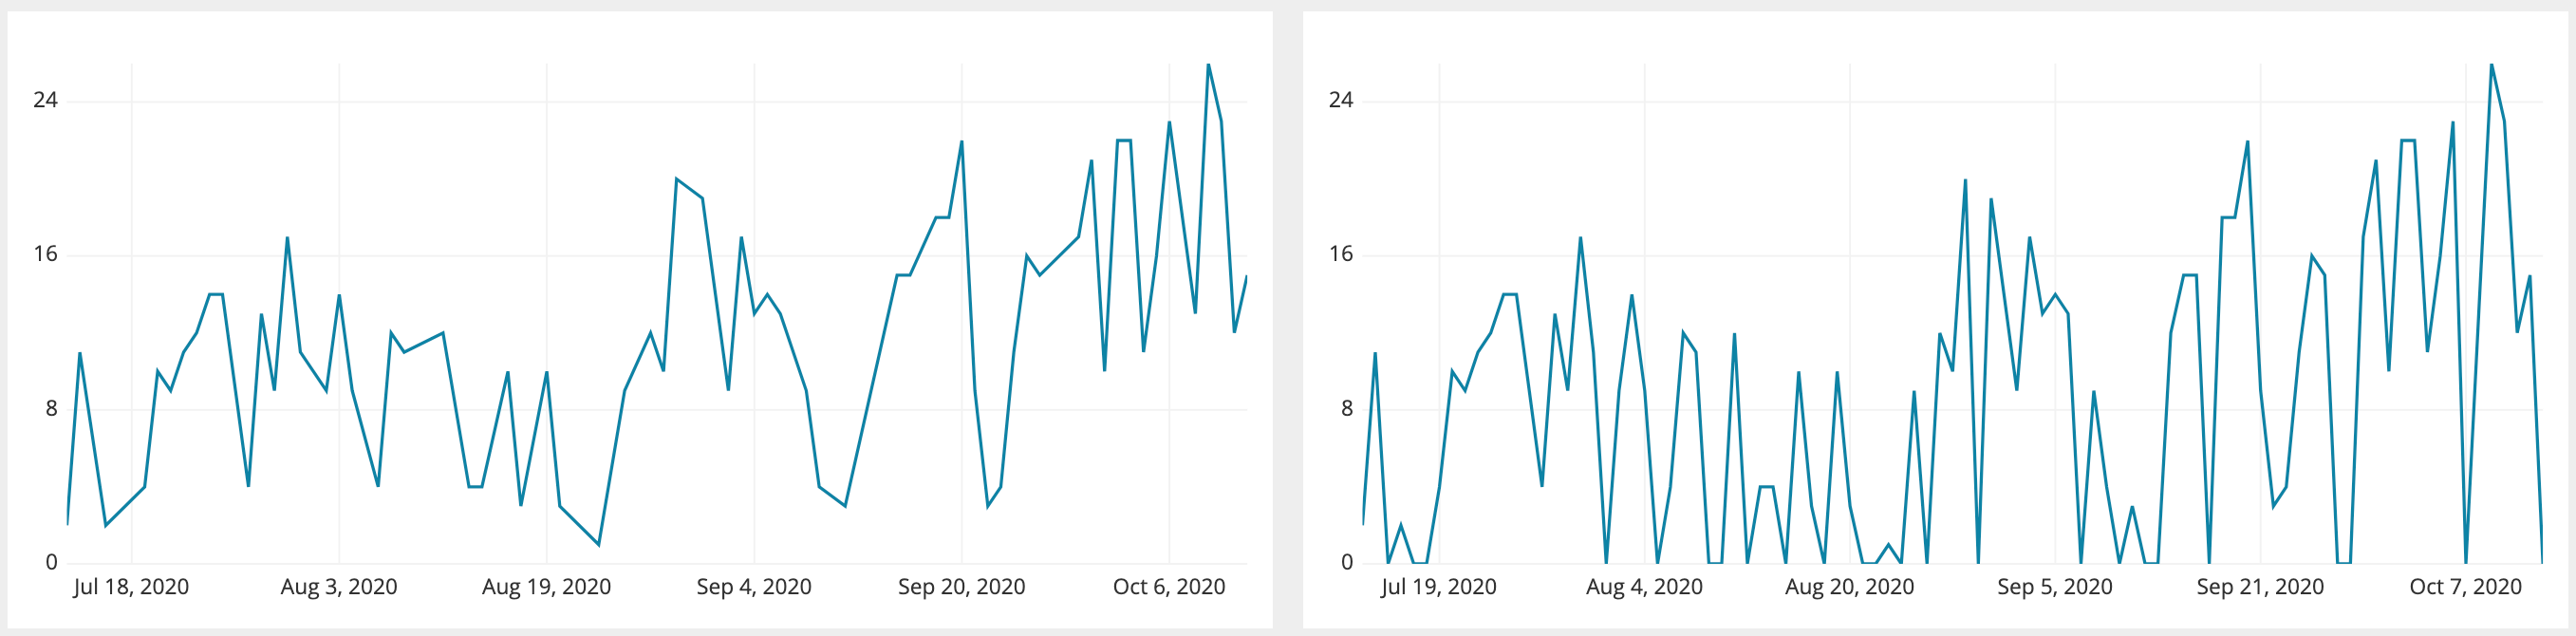
Charts that include time series are great for visualizing data over time and quickly recognizing trends. But an incomplete time series can result in a misleading representation of your data. For example, take a look at the time series below:
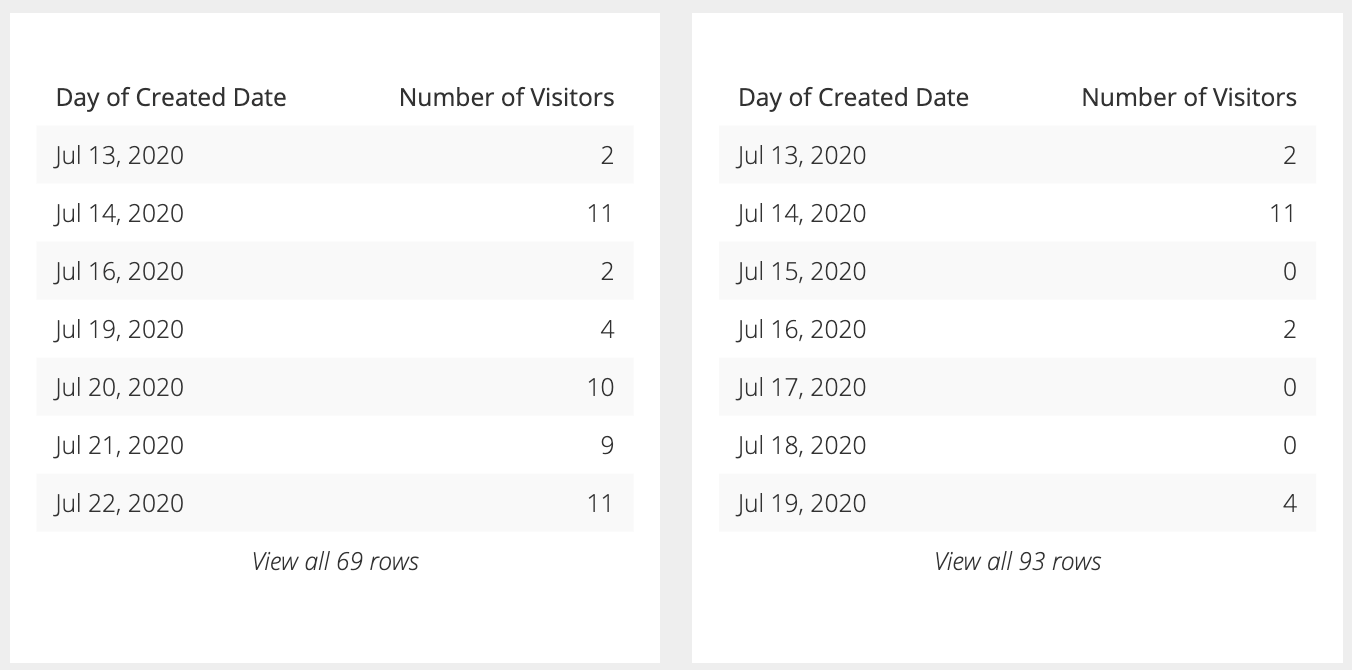
On the left, the series looks like it always has a consistent non-zero count. On the right, after adding in the missing dates, you can see the series does drop to zero on some dates, showing a more drastic variation between each day.
An easy way of fixing an incomplete time series is to join it with a complete list. So how do you do this? There are a few options:
Use a “Zero fill” step
Use the
SEQUENCEfunction for Spark SQL data sourcesUse the
GENERATE_SERIESfunctionGenerate a series without the
GENERATE_SERIESfunctionUse window functions
Use a “Zero fill” step
This method generates a time series that always starts at the earliest date contained in the date column. For example, if the earliest date in your date column is January 1, 2022, then you can’t use this method to generate a time series that starts earlier than January 1, 2022.
You can use a “Zero fill” step to add missing dates to your incomplete time series. The added dates will have values of 0.
In this example, we have a visual mode query that returns a count of distinct Jira issues created on each day contained in our “Created at” column from the “Jira issue” table.
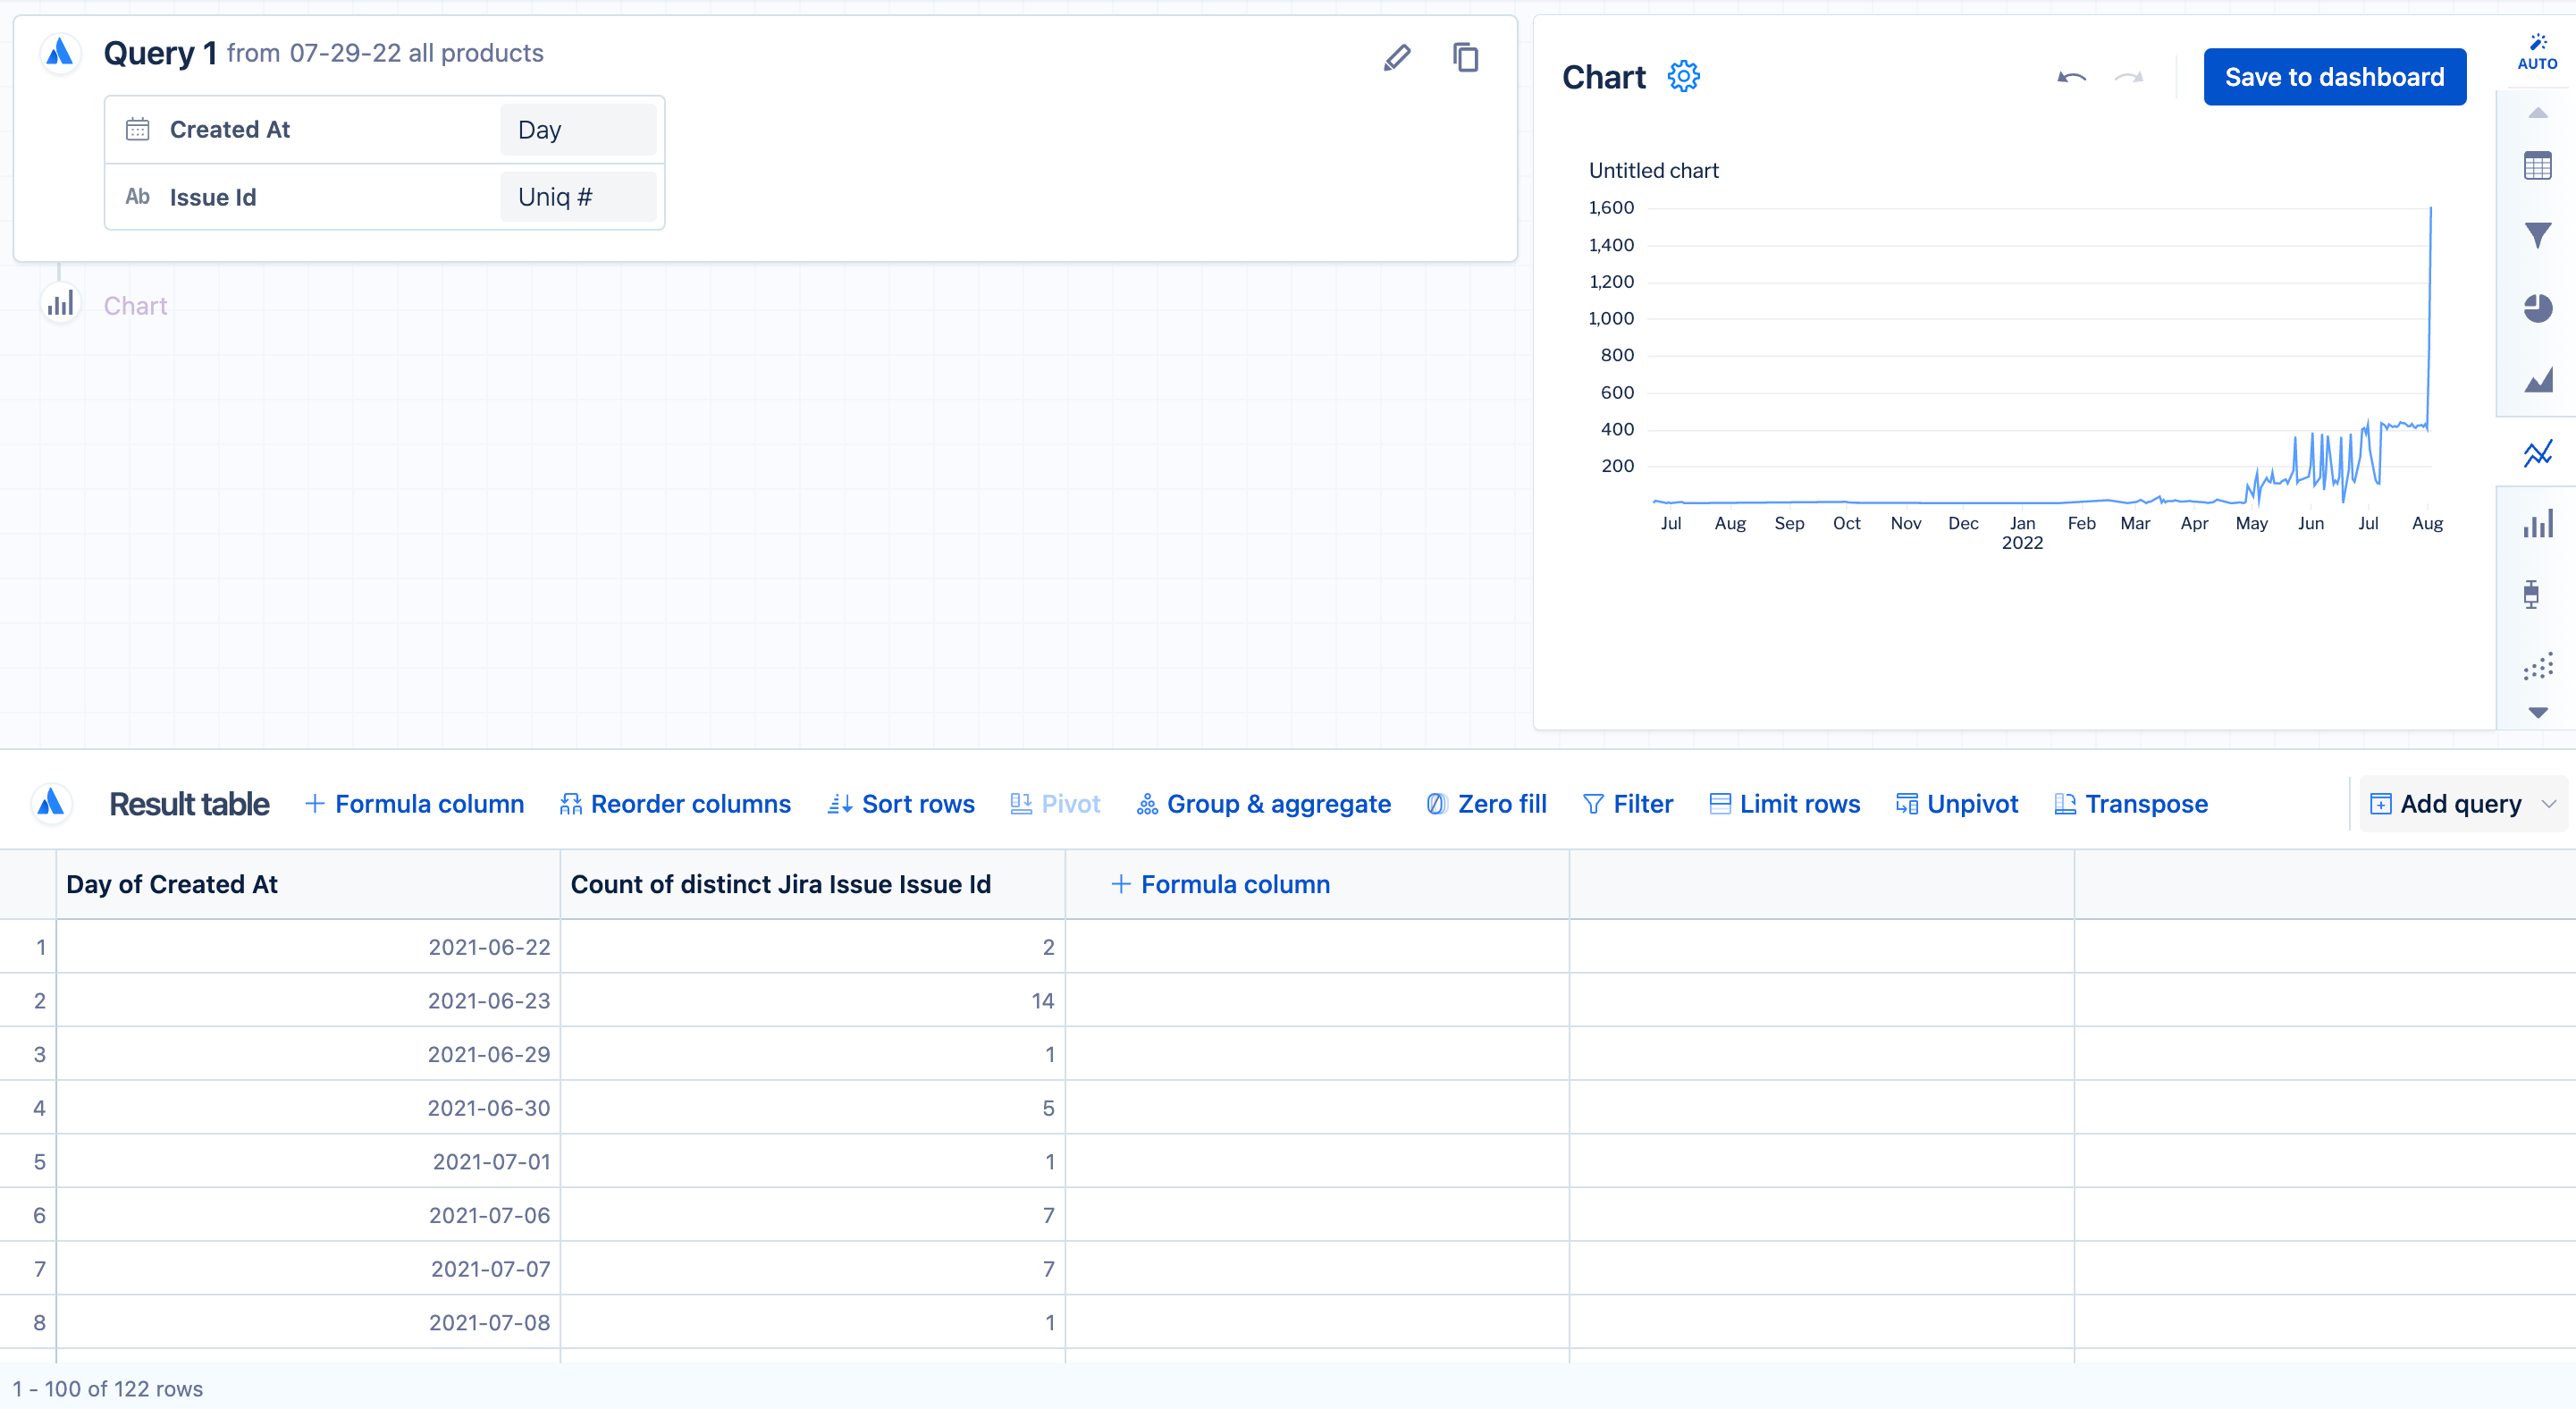
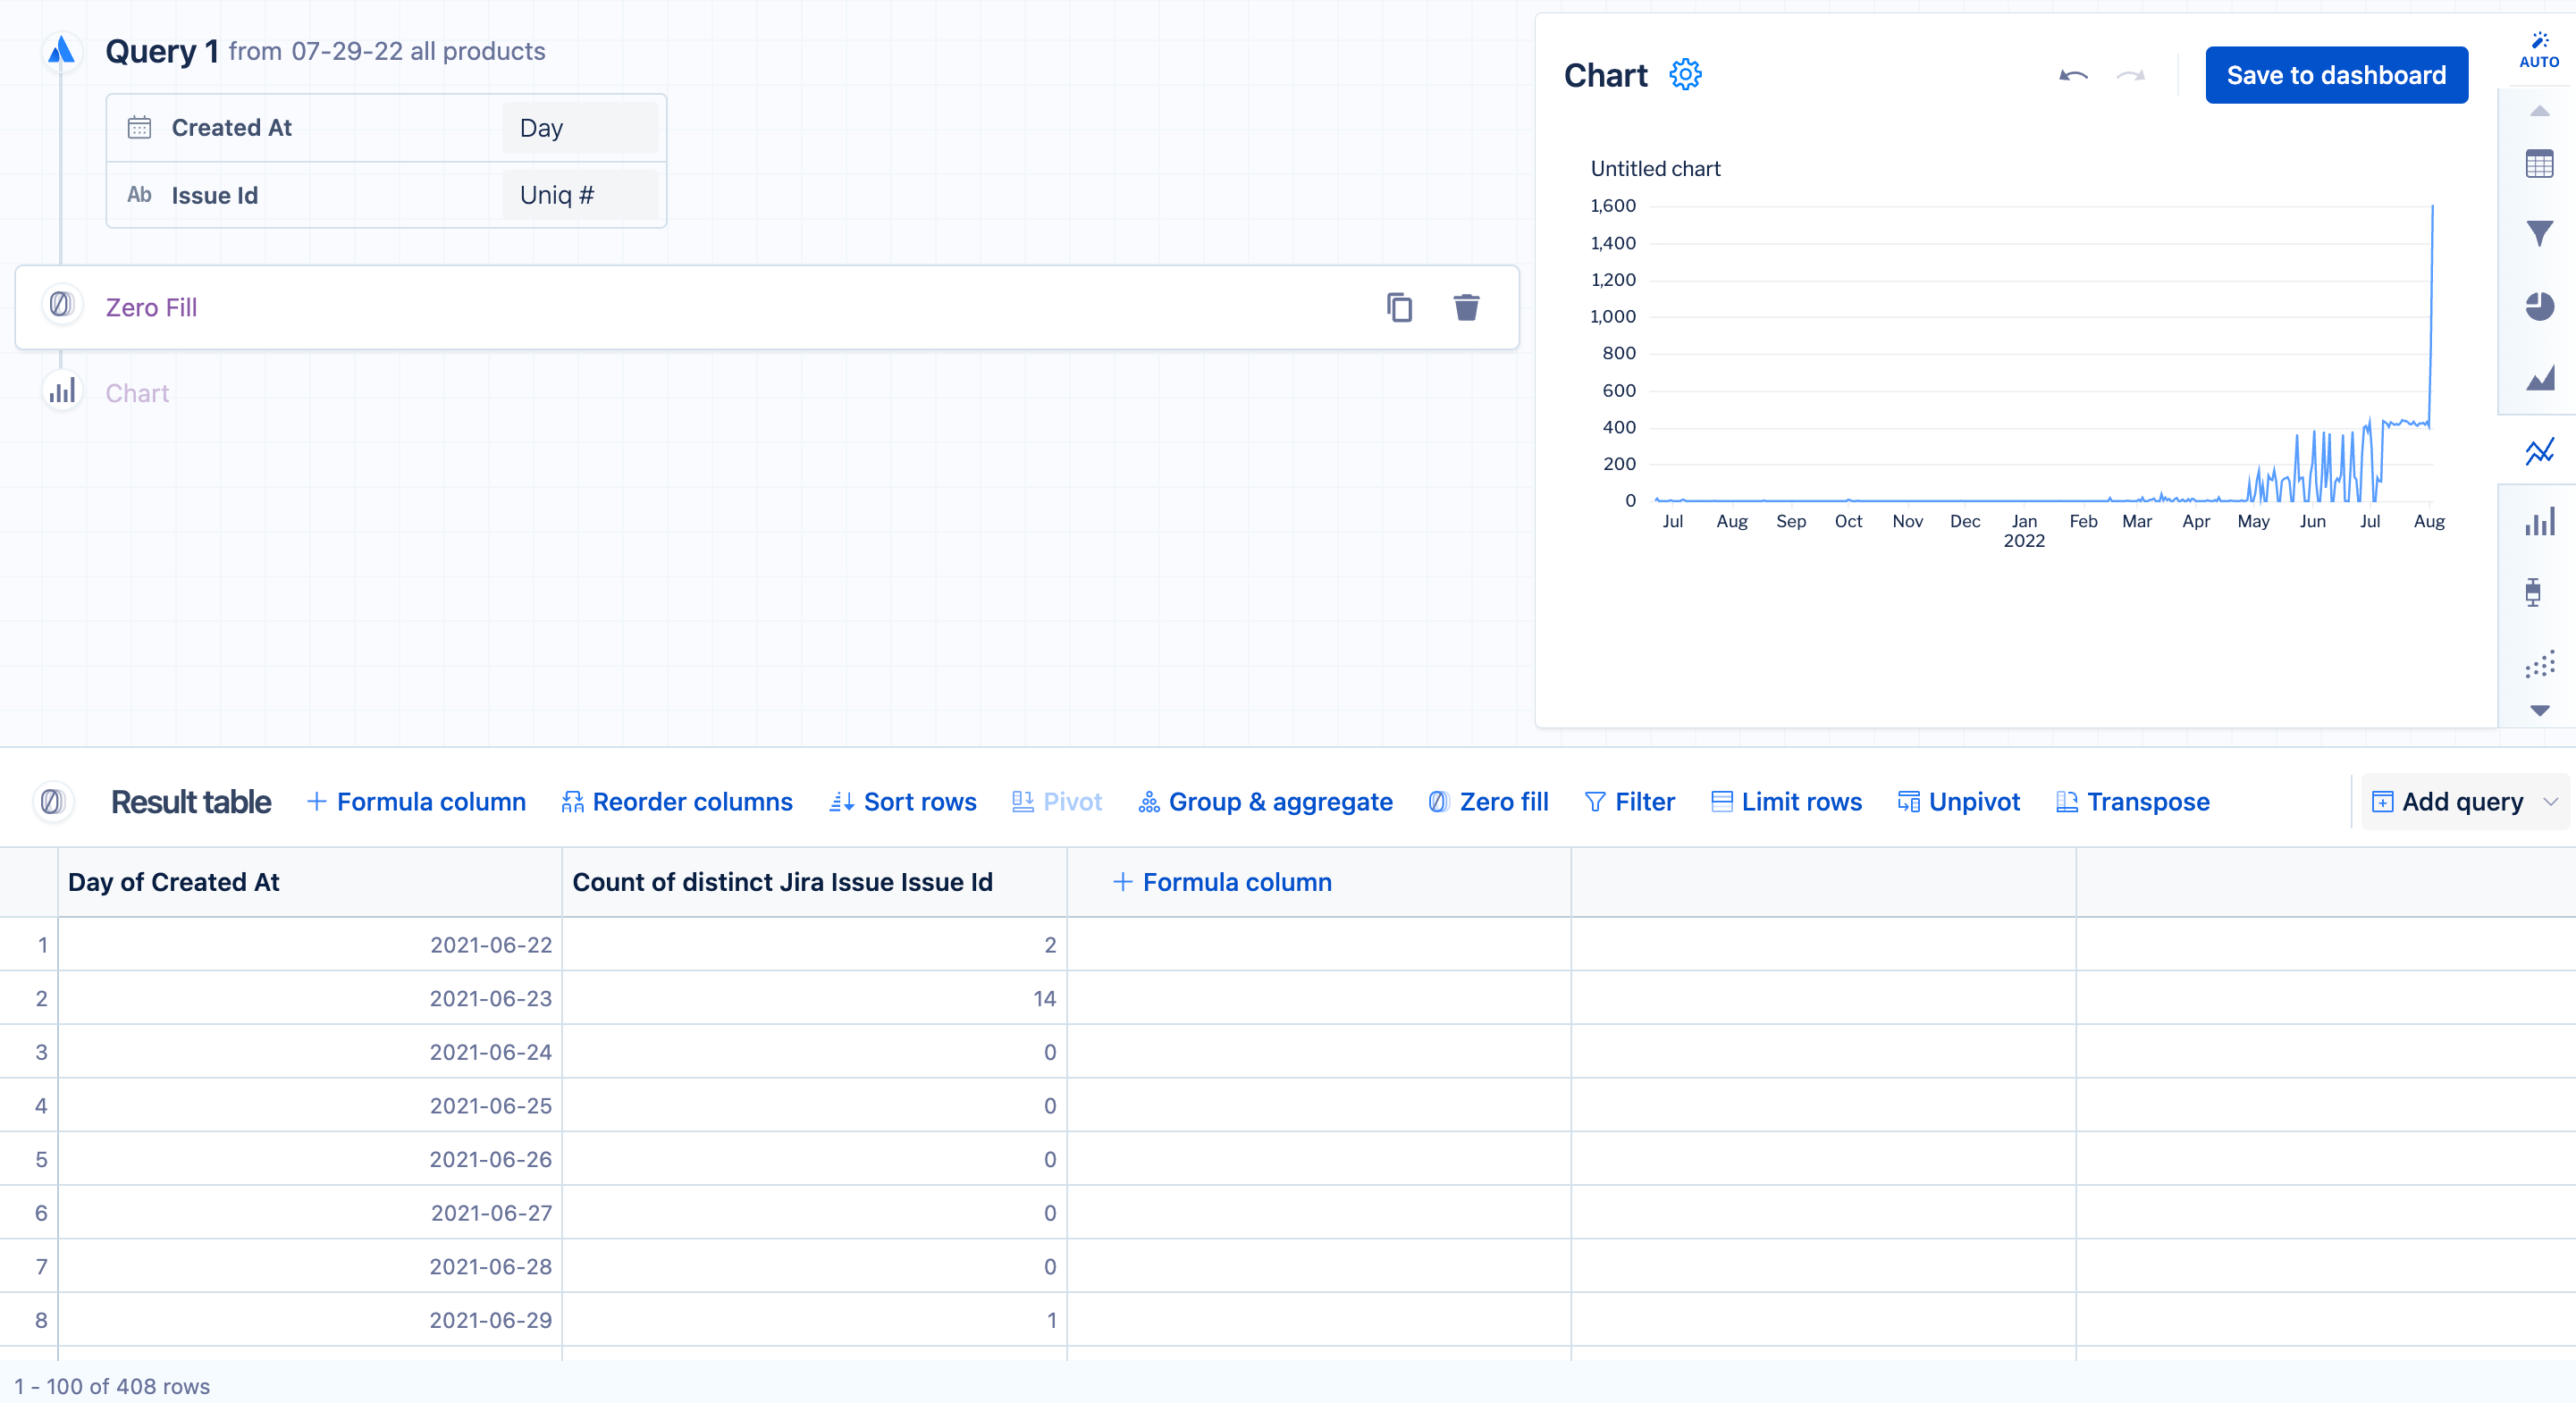
The result table in the image above shows that there are some days when Jira issues were not created. To add those missing dates and complete the time series for our line chart, we need to add a “Zero fill” step after the initial query. The image below shows what the time series looks like after adding a “Zero fill” step:
Use the SEQUENCE function for Spark SQL data sources
Spark SQL offers a function to generate an array of elements from start to stop, incrementing by step: SEQUENCE. This function takes in three arguments:
Argument 1 is the start expression, or the start of the range
Argument 2 is the stop expression, or the end of the range
Argument 3 is the step interval, or the step of the range. For sequences of time, the default step is 1 day, or -1 day if the start expression is greater than the stop expression.
You can use SEQUENCE() with any two timestamps, including Atlassian Analytic’s built-in relative date variables.
For example, if we want to generate a series of dates from January 1, 2022, through July 1, 2022, where the step interval is one month, we’d use the following:
WITH dates AS (SELECT sequence(TO_DATE('2022-01-01'), TO_DATE('2022-07-01'), INTERVAL 1 MONTH) AS months)
SELECT EXPLODE(months) FROM dates
The SEQUENCE function creates the array of dates, and the EXPLODE function pulls out the elements of the array.
If we use the above example in a SQL mode query, we get seven rows in our final result: 2022-01-01, 2022-02-01, 2022-03-01, 2022-04-01, 2022-05-01, 2022-06-01, and 2022-07-01.

Use the GENERATE_SERIES function
PostgreSQL
PostgreSQL offers a convenient function to generate a continuous time series: GENERATE_SERIES(). This function takes in three arguments:
Argument 1 is the starting timestamp
Argument 2 is the ending timestamp
Argument 3 is the step interval
You can use GENERATE_SERIES()with any two timestamps including PostgreSQL’s built-in function that returns timestamps (for example, CURRENT_TIMESTAMP) or Atlassian Analytic’s built-in relative date variables (for example, {TODAY}::TIMESTAMP).
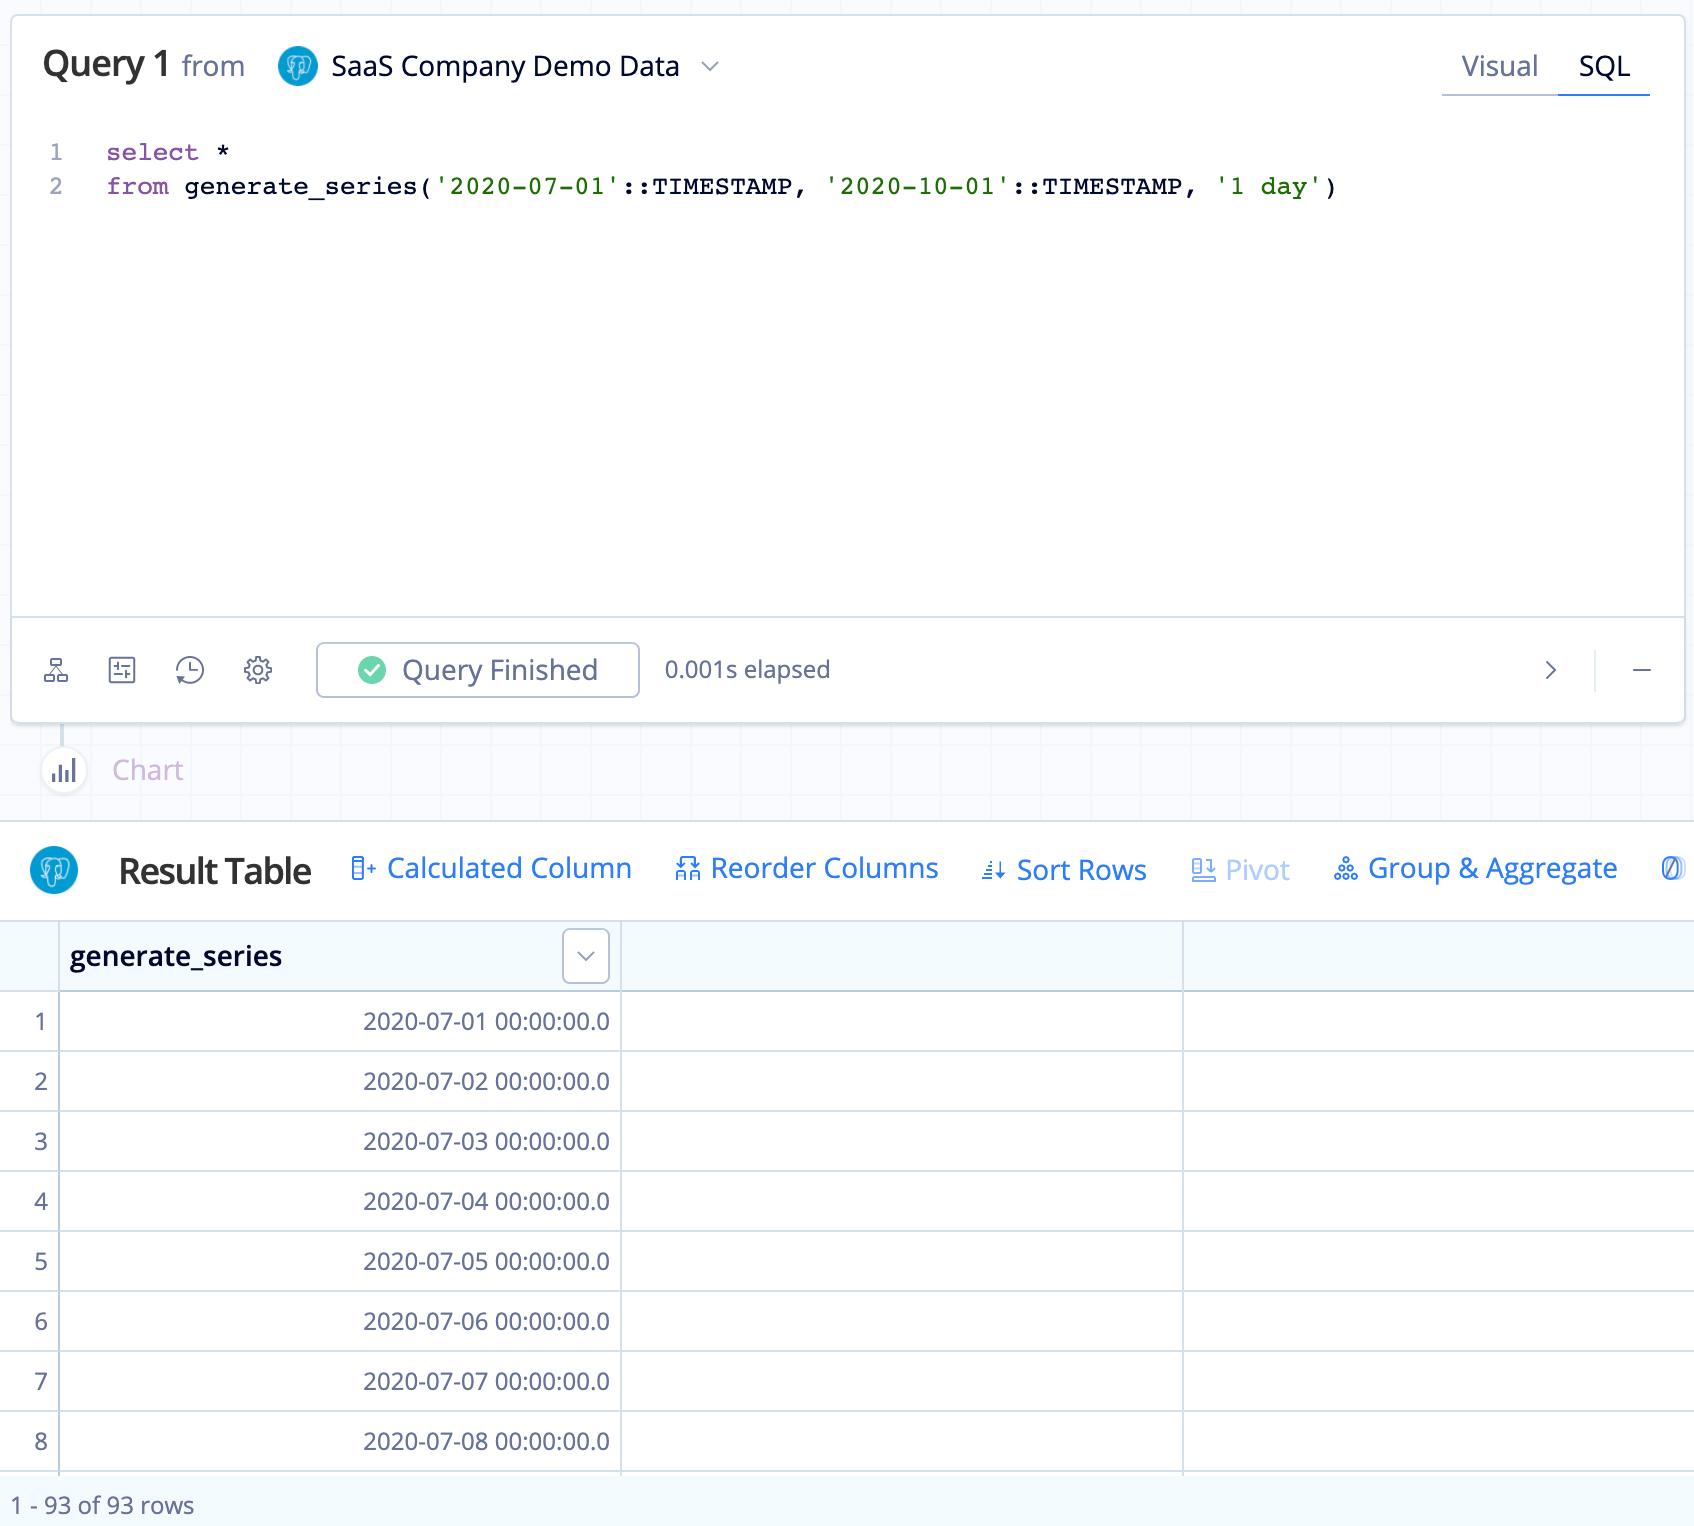
Here’s an example:
SELECT *
FROM GENERATE_SERIES('2020-07-01'::TIMESTAMP, '2020-10-01'::TIMESTAMP, '1 day')
The above example outputs the following:
Here’s an example of how to generate a time series of dates, rather than timestamps:
SELECT GENERATE_SERIES::DATE
FROM GENERATE_SERIES('2020-07-01'::TIMESTAMP, '2020-10-01'::TIMESTAMP, '1 day')
Here’s another example using relative date variables and date and time functions as the start and end timestamps:
SELECT *
FROM GENERATE_SERIES({TODAY.SUB(3, 'months')}::TIMESTAMP, {TODAY}::TIMESTAMP, '1 day')
Amazon Redshift
Some Postgres functions are available in Redshift and GENERATE_SERIES() happens to be one of them, but the arguments it takes are slightly different:
Argument 1 is the starting number; use 0 if you want to include the starting date
Argument 2 is the number of dates you want to return
Argument 3 is the step interval; optional
Here’s an example:
SELECT (GETDATE()::DATE - GENERATE_SERIES)::DATE AS series
FROM GENERATE_SERIES(0,30,1)
ORDER BY series ASC
GETDATE() returns the current date, but you can always replace it with a specific date to better fit your use case (for example, '2020-10-01'::date).
Generate a series without the GENERATE_SERIES function
If you’re not using PostgreSQL or Amazon Redshift, there are other options for databases that don’t natively support GENERATE_SERIES().
An easy alternative that can work with any database is using a continuous list of numbers starting at zero that can be converted into a sequence of dates. You can either create this table or use an existing column in a table if that table contains a column with sequential row IDs and no deleted rows. You can then convert each number into a date by subtracting the current date with the numbers column to build a continuous list of dates.
For the following examples, numbers_column is the column that contains a continuous list of numbers starting at zero and numbers_table is the table that contains the numbers_column column.
You can replace CURRENT_DATE in any of the following examples with any date value you want your time series to start from using the following format: 'YYYY-MM-DD'::date or 'YYYY-MM-DD HH:mm:ss.S'::TIMESTAMP. You can also apply a LIMIT clause to specify how many dates you want to generate.
Amazon Redshift
SELECT (GETDATE()::DATE - numbers_column)::DATE FROM numbers_tableIf you don’t have an existing column with the necessary values, you can instead use a common table expression (CTE) to create it:
-- Use a CTE to create the numbers column and numbers table
WITH numbers_table AS (SELECT ROW_NUMBER() OVER () AS numbers_column
FROM table_name
LIMIT 100)
-- Generate your series of dates
SELECT (GETDATE()::DATE - numbers_column)::DATE FROM numbers_table
MySQL
SELECT DATE_SUB(CURDATE()), INTERVAL 1 DAY) FROM numbers_tableIf you don’t have an existing numbers column or table in your MySQL database, you can create one using variables to generate a numbers column. Ensure the table you replace any_table with has at least as many rows as the number of dates you want to generate. For example, if you want a series of ten dates, the table you use for the following query needs to have at least ten rows. Apply a LIMIT clause to specify how many dates you want to generate.
SET @n:=CURDATE() + INTERVAL 1 DAY;
SELECT (SELECT @n:= @n - INTERVAL 1 DAY) number_column
FROM any_table
LIMIT 100
Google BigQuery (standard SQL)
SELECT DATE_SUB(CURRENT_DATE, INTERVAL 1 DAY) FROM numbers_tableGenerate a series with window functions
Another option for generating a continuous series is to use a window function to create one. Ensure the table you replace any_table with has at least as many rows as the number of dates you want to generate. For example, if you want a series of ten dates, the table you use for the following query needs to have at least ten rows. Apply a LIMIT clause to specify how many dates you want to generate.
Amazon Redshift
SELECT (GETDATE()::DATE - ROW_NUMBER() OVER (ORDER BY TRUE))::DATE AS series
FROM any_table
LIMIT 100
Google BigQuery
SELECT DATE_SUB(CURRENT_DATE, INTERVAL ROW_NUMBER() OVER () DAY)
FROM any_table
LIMIT 100
Now that you’ve generated a complete list of dates, you can use an outer join to merge this with your original dataset to create a complete time series. If you’re experiencing weird date labels for your charts, you can also use this method to fix your x-axis date labels.