504 Gateway error when triggering specific large requests
Platform Notice: Data Center - This article applies to Atlassian products on the Data Center platform.
Note that this knowledge base article was created for the Data Center version of the product. Data Center knowledge base articles for non-Data Center-specific features may also work for Server versions of the product, however they have not been tested. Support for Server* products ended on February 15th 2024. If you are running a Server product, you can visit the Atlassian Server end of support announcement to review your migration options.
*Except Fisheye and Crucible
Summary
Depending on how long the server takes to respond to the request, the load balancer/proxy may throw a "504 Gateway Timeout" error in your browser.

Environment
- Confluence Data Center.
- Traffic being handled by a load balancer or reverse proxy.
Diagnosis
When you request a report to be exported in Confluence, a background task is typically initiated to process the requested information. If the server takes too long to respond, the load balancer or proxy might return a 504 error.
To help illustrate this let's check the example of the analytics report below:
- While analyzing web requests or recording a HAR file, you request a report to be exported in Confluence Analytics.
- A minute later it errors out with code 504 Gateway Timeout. You should see something like the images below in your browser dev tools:
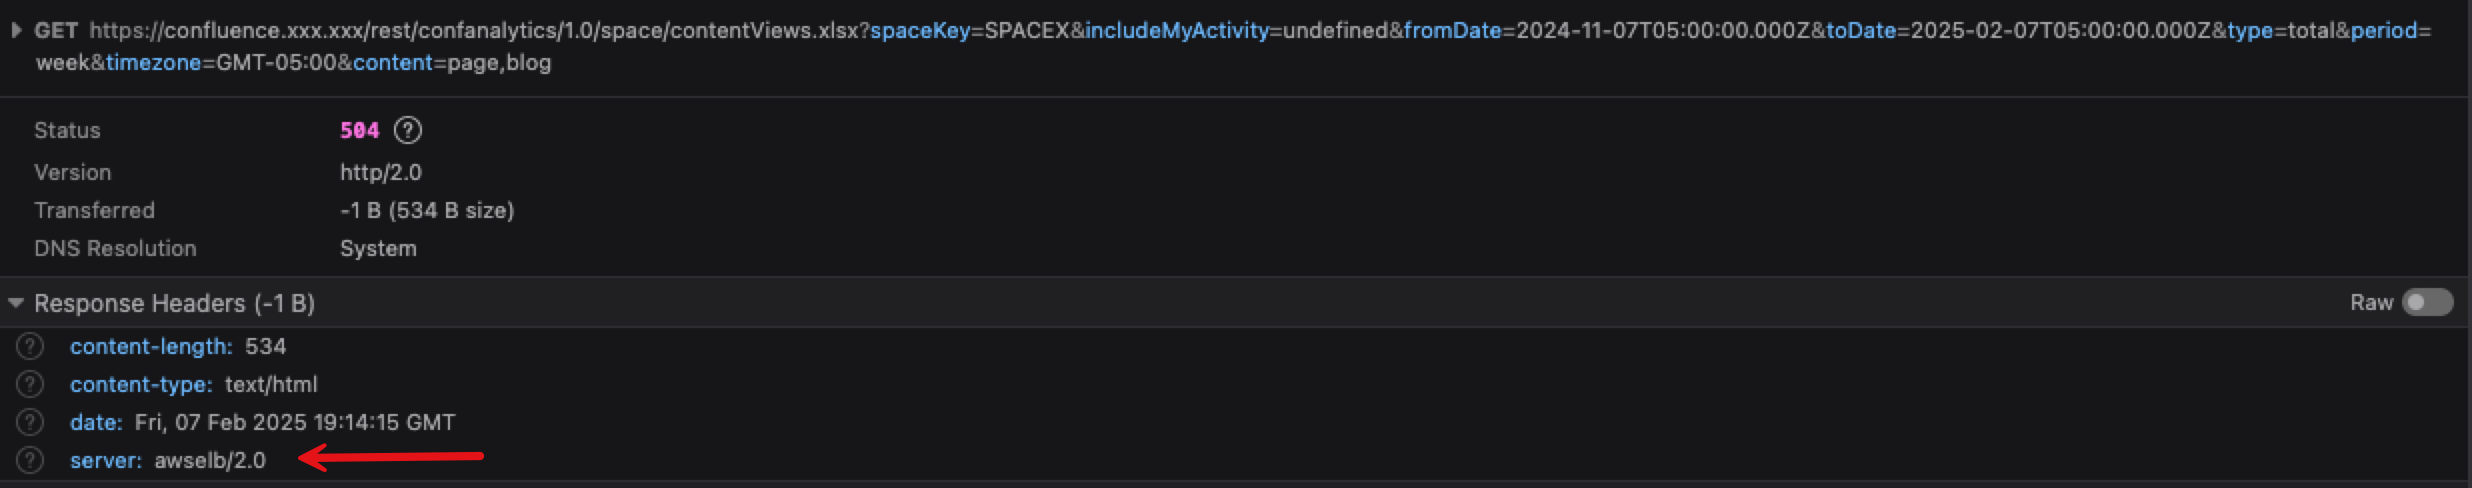
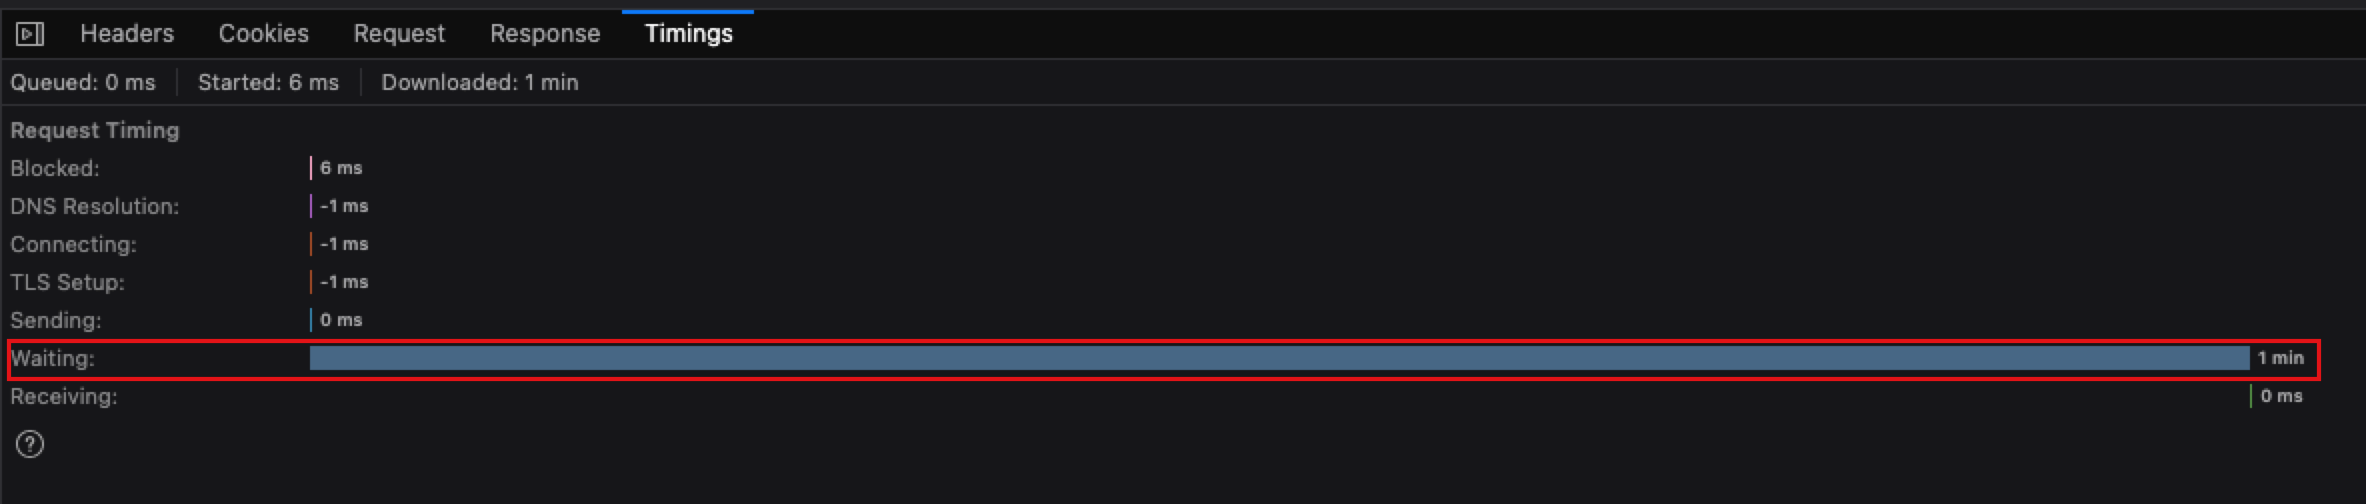
![]() Notice that the status 504 was returned by the load balancer AWS ELB and the timings shows that the browser waited for 1 minute. The 1 minute here is the load balancer/proxy connection timeout.
Notice that the status 504 was returned by the load balancer AWS ELB and the timings shows that the browser waited for 1 minute. The 1 minute here is the load balancer/proxy connection timeout.
- While the browser is waiting, usually we can see that the stuck thread detection valve records that the request took almost 6 minutes to complete (348,432 milliseconds).
07-Feb-2025 14:05:04.487 WARNING [Catalina-utility-4] org.apache.catalina.valves.StuckThreadDetectionValve.notifyStuckThreadDetected Thread [http-nio-8090-exec-498] (id=[87601]) has been active for [60,570] milliseconds (since [2/7/25 2:04 PM]) to serve the same request for [https://confluence.xxx.xxxx/rest/confanalytics/1.0/space/contentViews.xlsx?spaceKey=SPACEX&includeMyActivity=undefined&fromDate=2024-11-07T05%3A00%3A00.000Z&toDate=2025-02-07T05%3A00%3A00.000Z&type=total&period=week&timezone=GMT-05%3A00&content=page%2Cblog] and may be stuck (configured threshold for this StuckThreadDetectionValve is [60] seconds). There is/are [1] thread(s) in total that are monitored by this Valve and may be stuck.
	java.lang.Throwable
...
07-Feb-2025 14:09:54.665 WARNING [Catalina-utility-2] org.apache.catalina.valves.StuckThreadDetectionValve.notifyStuckThreadCompleted Thread [http-nio-8090-exec-498] (id=[87601]) was previously reported to be stuck but has completed. It was active for approximately [348,432] milliseconds. There is/are still [1] thread(s) that are monitored by this Valve and may be stuck.
Cause
A "504 Gateway Timeout" error occurs when the load balancer or proxy, does not receive a timely response from an upstream server. This is usually a consequence of another underlying issue.
![]() In Confluence context, this can happen for a few reasons:
In Confluence context, this can happen for a few reasons:
Long Processing Times:
When a report export is requested, a background task is initiated to compile and process the necessary data. If the dataset is particularly large or complex, this task may take a significant amount of time to complete.
During this period, if the server does not respond within a predefined time limit, the load balancer or proxy server will terminate the request, resulting in a 504 error.
Server Slowness:
If the Confluence server is handling a high volume of requests or is under heavy load, it may struggle to allocate resources to process the report export in a timely manner. This can lead to delayed responses and eventual timeouts.
Network Latency:
High network latency between the load balancer/proxy and the Confluence server can contribute to delayed responses. If the delay is too long, it can cause a timeout.
Configuration Issues:
Misconfigured timeout settings on the load balancer, proxy, or the Confluence server itself can lead to premature termination of requests. Ensure that all components are configured to handle expected processing times.
Resource Bottlenecks:
Insufficient server resources, such as CPU, memory, or I/O, can slow down data processing. This is particularly relevant for resource-intensive export operations.
Solution
The solution will depend of the causes above, but they usually are:
- Reduce the amount of data requested. In our example above, we were exporting 3 months worth of data, reducing it to 1 month was enough for the server to respond in less than 1 minute.
- Adjust the timeout settings on both the proxy/load balancer and server to accommodate longer processing times if necessary.
- Upgrade server resources or distribute load among multiple servers to handle high demand more effectively.
- Monitor server performance and network latency to identify and address potential bottlenecks.