Reporting on SLAs
Track success with percent of SLAs met
By default, Jira Service Management includes an SLA goals report that shows how your team performed against its goals during the past week. This report shows the big picture.
But, if you're interested in trends, want to see a different timeframe or are just more of a visual person, you may find creating a custom report more useful.
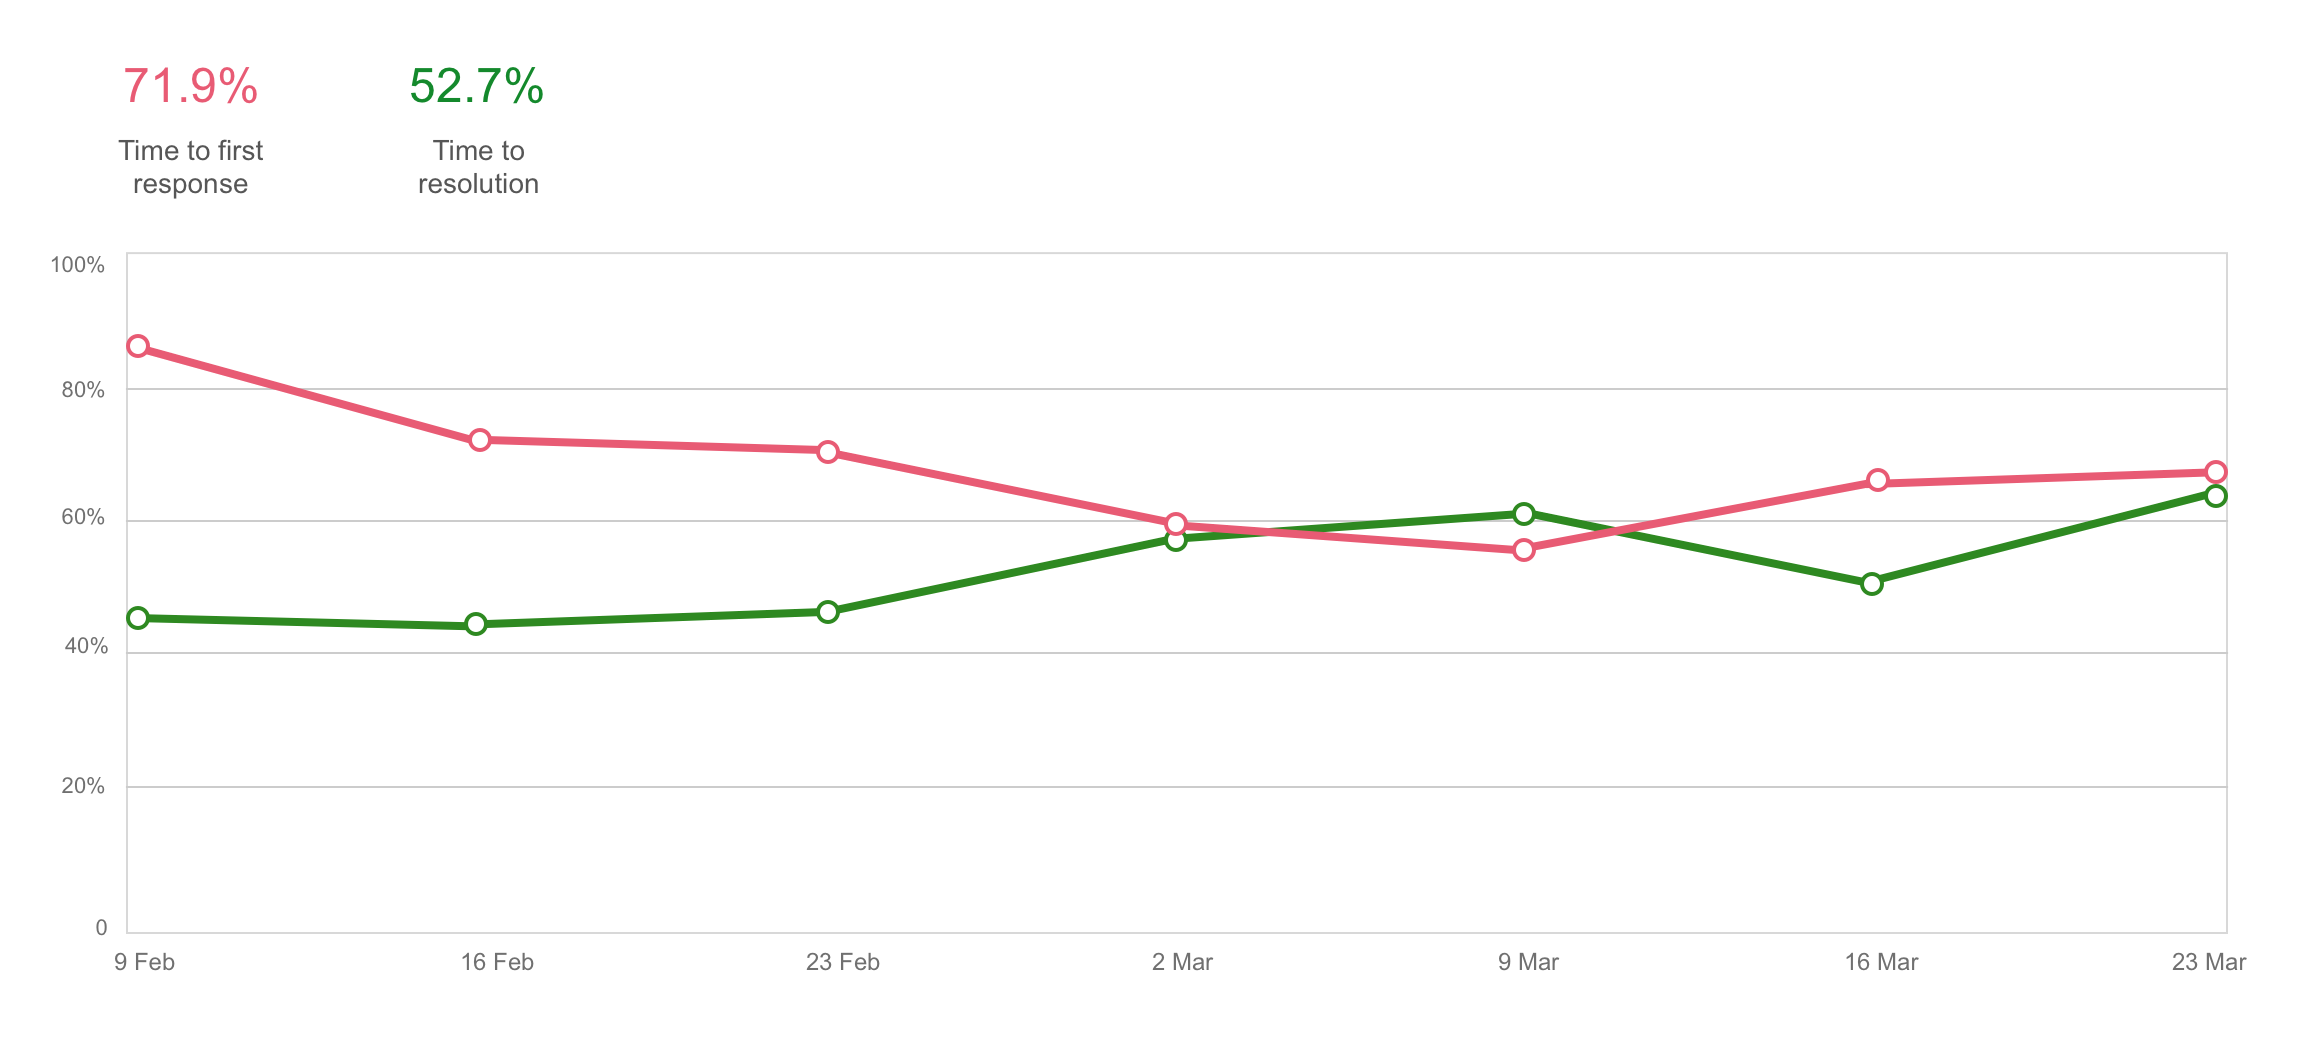
For example, you can create reports to see how well your team performs per request type. Create a report with the following series to drill into how your team is doing on each of your SLA goals for IT help requests:
- Series = Time to first response % met
- Label = Time to first response
- Filter by (advanced) = "Customer Request Type" = "Get IT help"
- Series = Time to resolution % met
- Label = Time to resolution
- Filter by (advanced) = "Customer Request Type" = "Get IT help"
You may find your team is speeding up on responding to customers with these requests but slowing down on resolving these issues. Looking at the details, you might see issues that are breaching your SLA goals feature words like "wi-fi" or "access".
Maybe you need to consider more reliable network hardware or you may need to train your organization about how to properly use the network. You may consider creating a knowledge base article that you can use to quickly answer these questions and increase the percentage of SLA goals met for resolving these requests.

Select a data point on the chart and view all of the issues that were used to calculate the % met metric. We calculate the total from issues that successfully met the goal and those that breached the goal, regardless if they are paused or ongoing.
Get insight into an agent's performance per SLA
Line managers and other stakeholders may wish to view individual agent performance trends to help determine when agents are being stretched too thin or ensure work is being distributed appropriately.
Use the assignee field and make some reports for your agents to see how they are keeping up with their workload and where their strengths lie.
- Series = Time to first response % met
- Label = Time to first response
- Filter by (advanced) = assignee = agentUserName
- Series = Time to resolution % met
- Label = Time to resolution
- Filter by (advanced) = assignee = agentUserName
You may find that an agent is slow to respond but very quick to resolve requests. Working with the agent, you may be able to strategize how to better notify them about requests when they are raised.