Jira Enterprise Scale Assessment Tool
JESAT end of support notice
We're ending support for the Jira Enterprise Scale Assessment Tool (JESAT) on September 1, 2023. The functionality of JESAT will be available as part of the Jira Cloud Migration Assistant from version 1.9.14 onwards.
The Jira Enterprise Scale Assessment Tool (JESAT) is an app for Jira Server and Data Center platforms. It collects database and browser metrics, which helps Atlassian assess if your data and setup will be successful when moving to the cloud.
It's designed to capture the data we need to better understand your data and usage and speed up the process of collecting the information Atlassian has to review before you can move to the cloud. It's important for you to understand the purpose of this app, the data it collects, and any performance impact. This will help you decide if installing this app is appropriate for your Jira instance.
Currently, the tool is compatible with: Jira Software Data Center and Server 8.13.0 to 9.4.0. and Jira Service Management Data Center and Server 4.13.0 to 5.4.0.
Prerequisites
The app utilizes and depends on the Atlassian Troubleshooting and Support Tools (ATST app. You'll need to be running ATST version 1.33.2 or higher, or the Jira Enterprise Scale Assessment Tool app won't be able to operate. Learn more about Atlassian Troubleshooting and Support Tools
How it works
You will need to install the Jira Enterprise Scale Assessment Tool app from Marketplace as it's not bundled with Jira.
To install the app:
- Install the Jira Enterprise Scale Assessment Tool app from Atlassian Marketplace. Learn more about installing Marketplace apps
- Once installed, it will automatically start collecting browser metrics, unless you opt out.
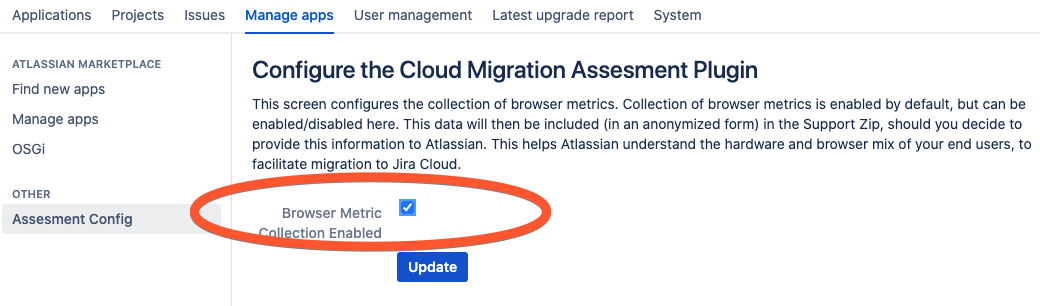
To opt out of user browser metrics collection:
- In Jira, go to Administration
 > Manage apps > Assessment config.
 - Deselect the Browser metric collection enabled checkbox.
- Save your changes.
From then onwards, browser metrics will not be collected unless you enable it again.
On that same page, Jira admins can check the summary of the collected browser metrics to date and review their data shape.
Stale data will be regularly removed. Everything older than 14 days will be automatically deleted. This only applies to browser metrics collected and stored in the database.
The app only collects browser metrics once every 24 hours per user, when and if the user accesses one of the following Jira experiences:
- Issue view
- Browse projects
- Browse project
For every browser metrics information, we collect the user key against it. Personally Identifiable Information (PII) is protected during this process. User keys are heavily hashed on export, and never exposed to Atlassian teams. It is only used for grouping, clustering, and creating themes for research and analysis purposes.
What data does it capture?
There are two spectrums the app taps into, back-end and front-end metrics. Back-end metrics are accurate numbers on specific Jira items, components, and elements that are collected by querying the database. Front-end metrics are a collection of JSON objects where every object is a representation of the user's device setup. Front-end metrics thus will have a range of different entries, depending on each user’s situation. For clarity and accuracy, let’s break it down.
Database metrics
Jira Software
- Count of different users
- Count for every project role actor
Count for every project role actor with deactivated users
- Average count of users per groups
- Maximum count of users per groups
- Total count of child issues for all issues
- Maximum count of child issues for one parent issue
- Total count of issues
- Total count of issue types
- Total count of custom fields
- Total count of projects
- Total count of active users
- Total count of inactive users
- Total count of groups
- Total count of workflows
- Total count of comments
- Total count of attachments
Jira Service Management
- Total number of active agents
- Total number of help keepers
- Total number of queues
- Total number of queues per project
- Request creation channel usage
- Total number of rules per project count
- Number of Executions per day
- Total number of goals per project
- Total number of metrics per project
- Total number of calendars per project
- Total number of insights schemas
- Total number of insights objects
Browser metrics
- Round Trip Time (RTT)
- Downlink network speed
- Network effective connection type
- Number of processors (CPU)
- Device memory size
- Web Browser and its version (userAgent)
How data will be used
As previously mentioned, Personal Identifiable Information (PII) is protected during this process, and users' usernames are never exposed to Atlassian. All towards assessing customer’s status for Cloud which is divided into:
- Loading browser metrics stats into an analytical tool
- Grouping data to get numbers or percentages for every metric and its every possible type
- Assessing each metric based on the expertise that Atlassian has with migrating large customers to cloud
At the very end of the migration process, the L1 assessment data that was collected and shared with Atlassian will be disposed of.
Exporting data
Allow this app to collect data for at least three days (ideally a week) before exporting.
Collected metrics and detailed data shape information can be exported to share with Atlassian teams by creating a support zip. You need to be a Jira administrator to do this. Learn more about creating a support zip
To export collected data:
- Go to Administration > System > Troubleshooting and support tools (under System support)
- Select Create support zip.
- Customize your zip as needed.
- Select the L1 assessment checkbox. You can deselect any other items that you don't want to include.
- Select the Create zip button and follow the prompts to download the file.
Once you've downloaded the zip we recommend sending it to Atlassian via https://transfer.atlassian.com/. You'll need to open a support ticket to do this.