Monitoring database connection usage
Accessing the Database Monitoring page
- Choose Administration () > System.
- Select Database Monitoring, which can be found under System support to display the Database Monitoring page.
Interpreting the database monitoring graphs
Connection Pool graph
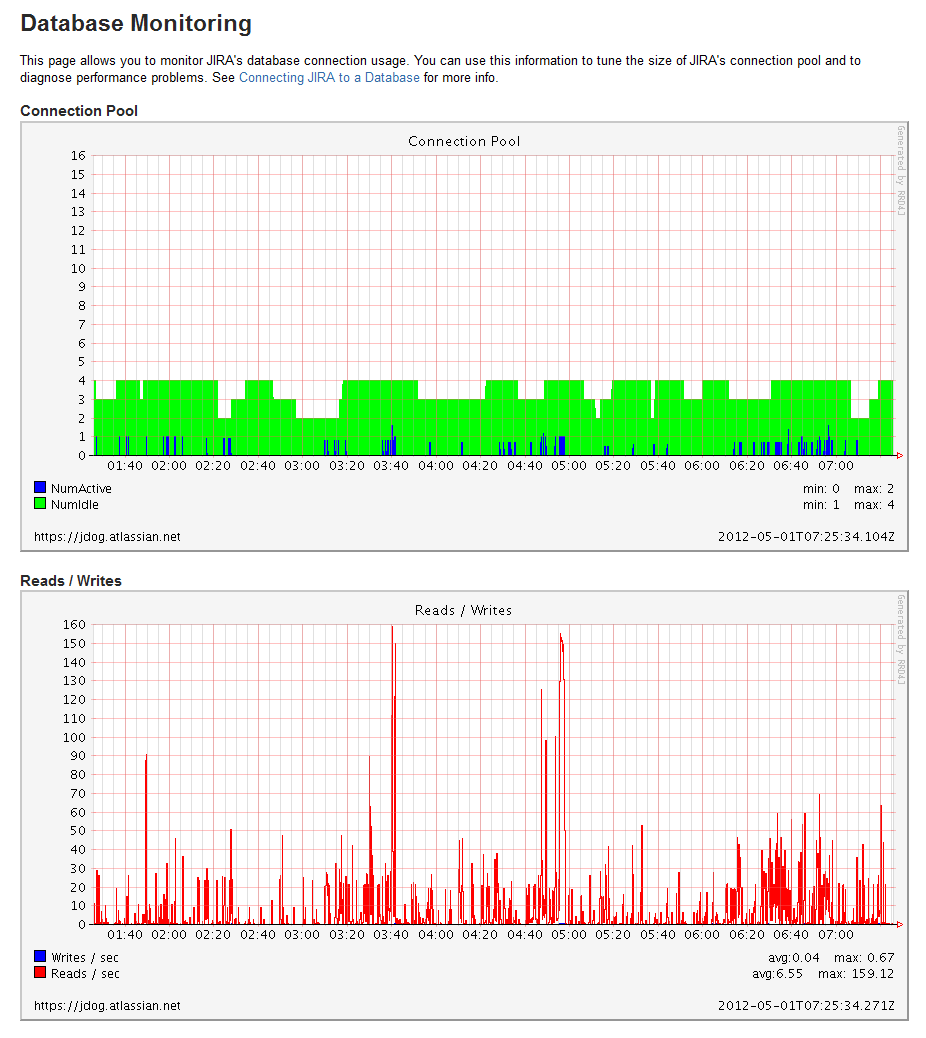
The 'Connection Pool' graph shows the activity in the connection pool for the last 6 hours.
- This graph shows the number of active and idle connections, as well as the maximum and minimum for the period.
- The scale of the vertical axis is equal to the maximum number of connections.
- The readings are averages over a period of 5 minutes.
This information can help you to optimize database connection usage. For example, if the number of active connections is consistently or frequently near to the maximum available, then you may need to raise the maximum connections available in the pool. Conversely, if the number of active connections is consistently low compared to the maximum available, then you may want to lower the maximum connections available in the pool. For more information on how to tune database connections, see Tuning database connections.
Reads / Writes graph
The 'Reads / Writes' graph shows the frequency of reads and writes to the database over a period of time. It can be helpful to correlate database usage with connection pool usage. Whenever Jira needs to access (i.e. read from or write to) the database, a database connection is required. If there are regular spikes in the reads / writes, you may need to consider raising the maximum connections available in the pool.
