Calculate a rolling sum
You can calculate a moving average in Atlassian Analytics by using our “Moving average” guided formula using a “Formula column” or “Apply formula” steps. In the event you’d like to calculate a rolling sum (or moving sum), you can easily edit the “Moving average” to multiply it by the selected period.
In the example below, we create a chart that pulls the count of Jira issues per day. Here, we also want to include a column that calculates the rolling sum of the count of Jira issues in the last seven days. This is different from a standard running total because it only includes the sum of the previous seven rows of data.
To do this, follow the steps below:
Start by building a chart for the count of Jira issues per day.
Here we use an Atlassian Data Lake data source and add the “Created At” and “Issue Id” columns from the “Jira Issue” table to our query, keeping the grouping and aggregation as Day and Count of distinct, respectively. Select Run query.
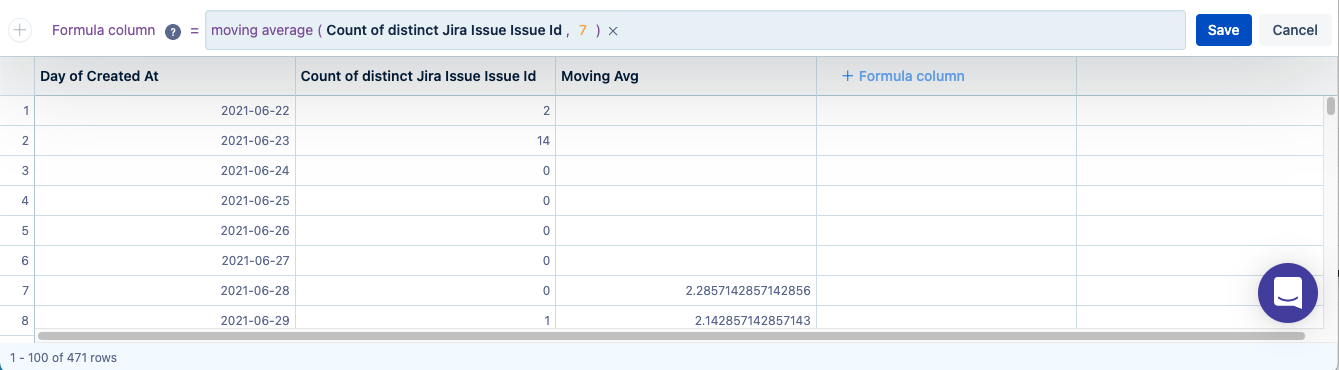
Add a new column to your result set to calculate the moving average.
Select + Formula column above the “Result table”, select Moving average from the list of guided formulas. For the parameters, choose “Count of distinct Jira Issue Issue Id” as the input column and type 7 for the number of trailing rows to calculate the moving average for the last seven days. Select Save.If you don’t have rows for every day and want to make sure you calculate null values for the last week, add a “Zero fill” step before the “Formula column” step.
The moving average is simply the sum of the last seven values divided by 7. Therefore, we can get our rolling sum by multiplying the moving average by seven.
Add another “Formula column” step to do exactly that. Simply select Custom as the formula type and use the following formula, replacing “Moving Avg” with your custom column name from Step 2:"Moving Avg" * 7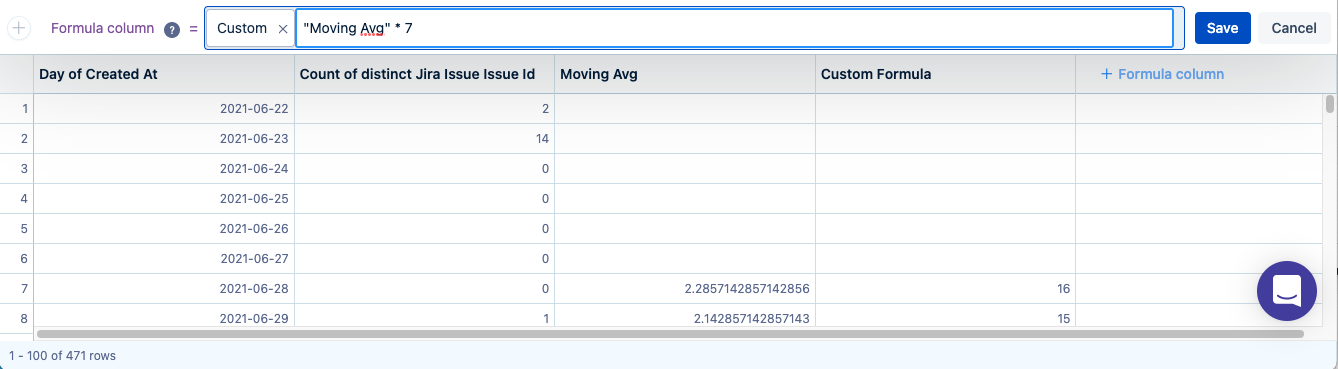
For clarity, rename this column to “Rolling Sum”.
Since it’s no longer necessary, hide the “Moving Avg” column from your result set.
Switch your chart to a line chart from the chart types to visualize your daily Jira issue count compared to the 7 day rolling sum of Jira issues. Don’t forget to save your chart to your dashboard when done.
