Calculate row number in a table chart
It can often be handy to have row numbers when viewing data in tabular form to display information or to use in calculations.
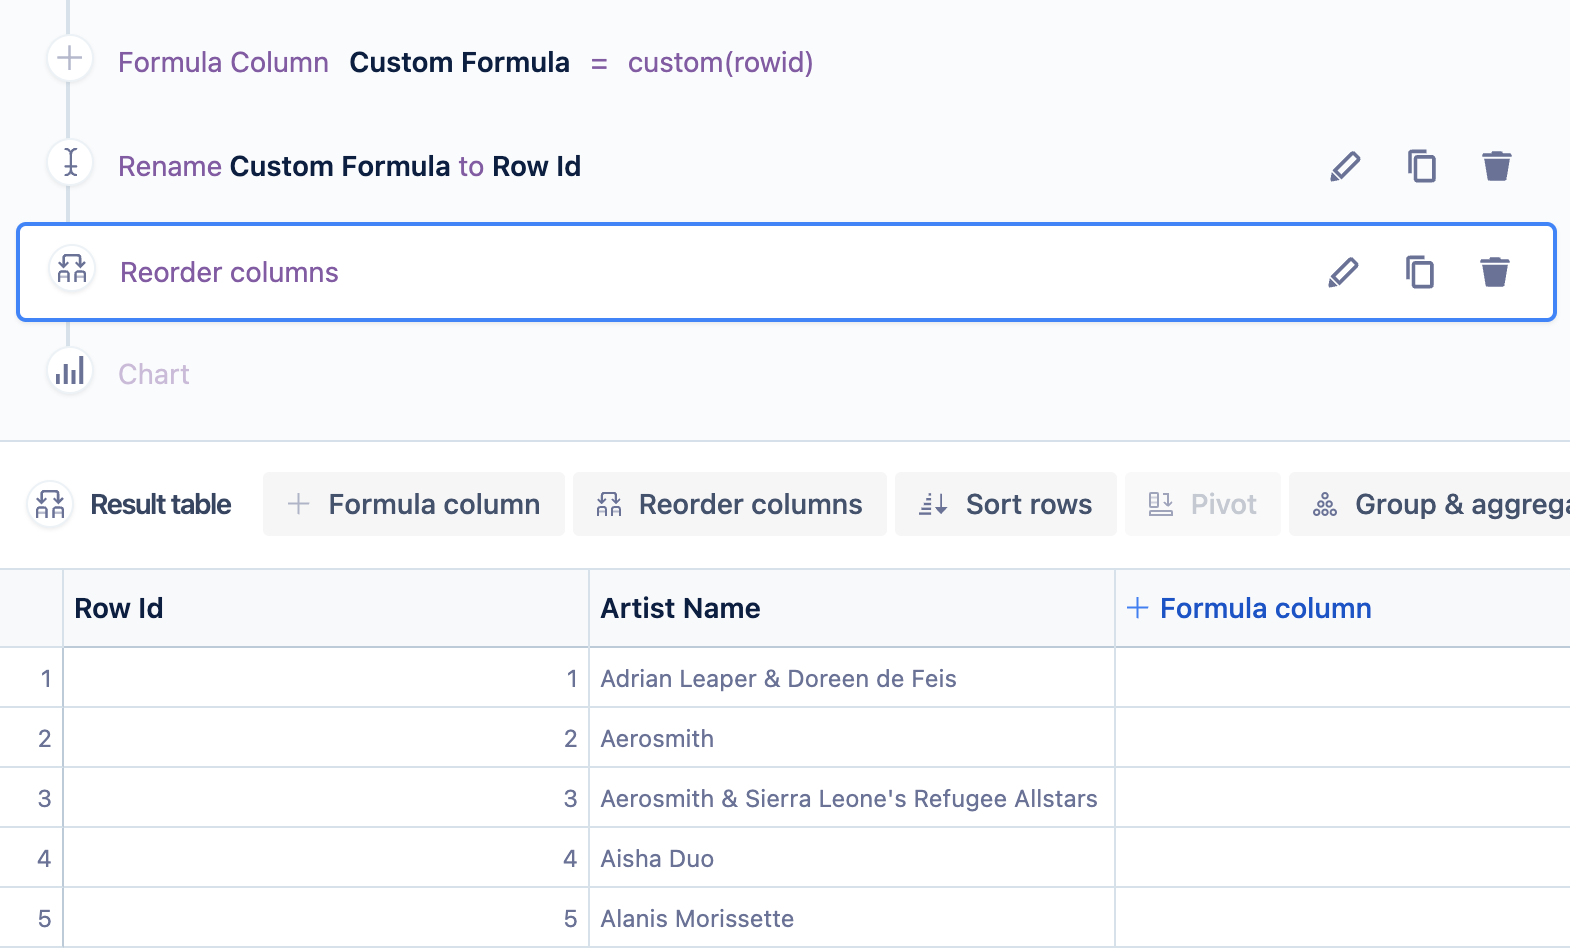
Let’s take a look at how we can calculate row numbers in Visual SQL in order to generate a table chart similar to the one below:
To add a column with the row numbers to your chart, add a “Formula column” step, select Custom for the formula type, then use the following formula:
rowidClick Save to add the new column to your result set.
The newly added Formula column is given the name “Custom Formula” by default, but you can rename it—for instance, to “Row Id”—for clarity.
If you want your new “Row Id” column to be the leftmost column in your table chart, simply use a “Reorder” step to quickly move it.
Now you have a table chart with a row number column!
Your row ID values will start at 1 and are calculated according to the order of your rows at the time you add the Formula column. If you want your Row Id values to populate based on a different row order, just add a “Sort rows” step before adding the Formula column to reorder your results.
Tip - You can use this "Row Id" column in a number of ways, for example as part of a "If...then" step to set conditions depending on the row ID value or in a "Filter" step to include or exclude some rows from your result set.


