Embedding an Atlassian Analytics chart with Smart Links
Atlassian Analytics charts and dashboards can be embedded into Confluence pages, Jira issues, Trello cards, and other Atlassian products through Smart Links. Smart Links allow an individual Atlassian Analytics chart or an entire dashboard to be viewable within a different Atlassian product. This can help the viewers of your Atlassian Analytics charts and dashboards to reduce their context switching.
To allow a user to view the embedded chart or dashboard, you’ll need to first ensure the user has been granted permission to view the dashboard in Atlassian Analytics.
Watch the video below to learn how to embed Atlassian Analytics charts and dashboards, or continue reading the article.
Embedding a chart using Smart Links
You can use the following steps to embed a single chart in a different Atlassian product:
Open Atlassian Analytics and open the dashboard that has the chart you want to embed.
Copy the link of the individual chart.
Open the Atlassian product you want to embed the chart in using Smart Links. For this example, we’ll embed the chart within a Confluence page.
Paste the chart link then choose the ‘Embed’ Smart Link option to have the Atlassian Analytics chart visualized in your Atlassian product of choice.
Embedding a dashboard using Smart Links
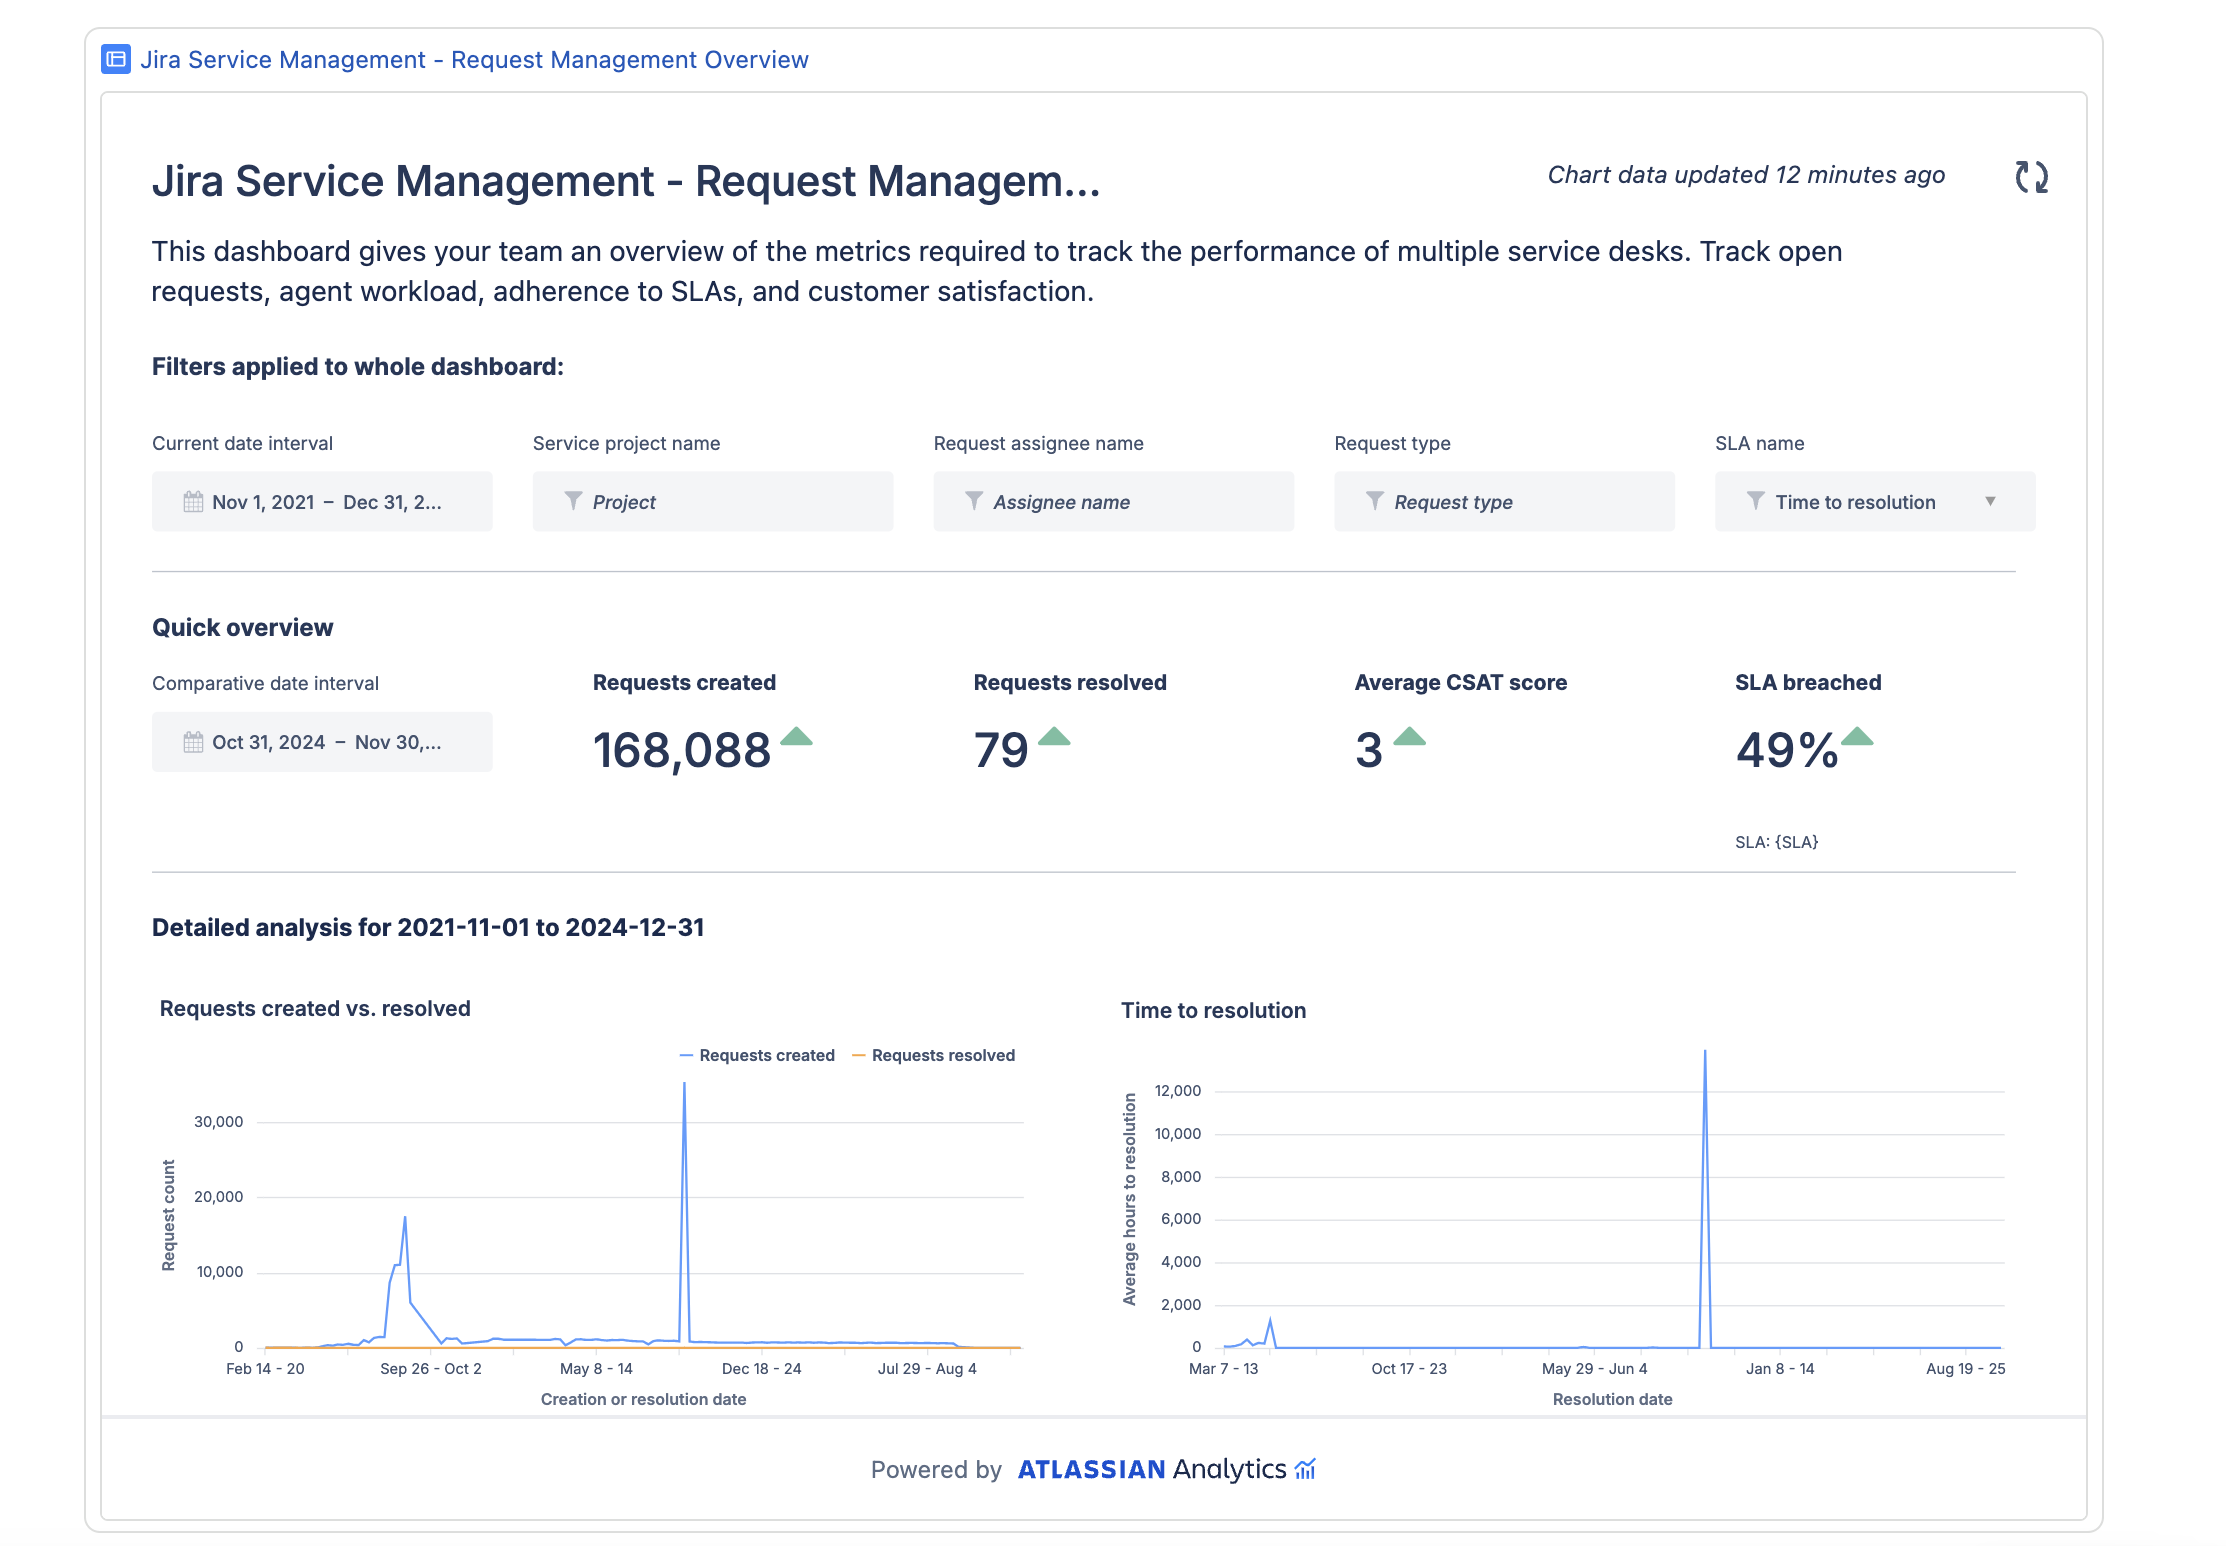
To embed an entire dashboard in a different Atlassian product we’ll use similar steps to the ones used to embed an individual chart, with the exception being that the dashboard link will be copied.
Open Atlassian Analytics. Then open the dashboard that you want to embed.
Copy the link of the dashboard.
Open the Atlassian product you want to embed the chart in using Smart Links. For this example, we’ll embed the dashboard within a Confluence page.
Paste the dashboard link then choose the ‘Embed’ Smart Link option to have the Atlassian Analytics dashboard visualized in your Atlassian product of choice.
When an entire Atlassian Analytics dashboard is embedded with Smart Links users will be able to select values in the dashboard controls, hover over the chart to have a tooltip appear with values, scroll up and down to view all the charts on the dashboard, and click any hyperlinks within charts on the embedded dashboard.

