Tips to improve query performance for third-party data sources
This article covers query performance related to third-party data sources. For Atlassian Data Lake performance, this article details features within Atlassian Analytics that can help.
Atlassian Analytics runs its queries on the databases it’s connected to, so the server will take the additional load of those queries. Atlassian Analytics opens a connection to your database for every query that it sends, and it does this concurrently up to a query rate limit. Each connection and query takes a certain amount of server resources (RAM, CPU time, Input/Output, etc.) to process the request.
Database servers have a limited amount of resources. As more queries are sent, each individual query has to compete with all of the other running queries for the limited resources. Additionally, complex queries can tie up more server resources for a longer period of time.
The number of concurrent queries can increase when more users are viewing different dashboards at the same time, or with an increase in the number of charts per dashboard.
We do many things to minimize that potential load:
All queries are dirty unlocking reads
Caching of results at your set interval (default five minutes)
Queuing of query results if multiple people are requesting the query at the same time
If you are concerned about an additional load to your database, we recommend adding more memory, creating a replica or running off of a backup database if you are not already. For more information, see our tips for improving query performance below.
What if my queries seem to take longer in Atlassian Analytics than against my database directly?
If your queries seem to take longer in Atlassian Analytics than when you run them directly against your database, the cause can generally be attributed to the fact that Atlassian Analytics is running many queries at once.
To test this, try refreshing one query at a time in Atlassian Analytics, and check the query log duration. The query log will show you whether there are any other running queries - be sure to cancel any running queries before you begin the test. Compare the query duration in Atlassian Analytics against the same query when executed from another workbench outside Atlassian Analytics.
Suggestions for improving query performance
The following are merely suggestions and may not all apply to your database. You will need to review the options and determine which suggestions are applicable.
Upgrade your database
Upgrading your database is the recommended option. This can involve upgrading your memory and/or CPU. This gives your server more resources to work with and is the fastest, easiest way to improve query performance.
Identify long-running queries
Identify long-running queries and either optimize them, or ask your data engineer to incorporate it into a materialized view in the database if data freshness is not as crucial.
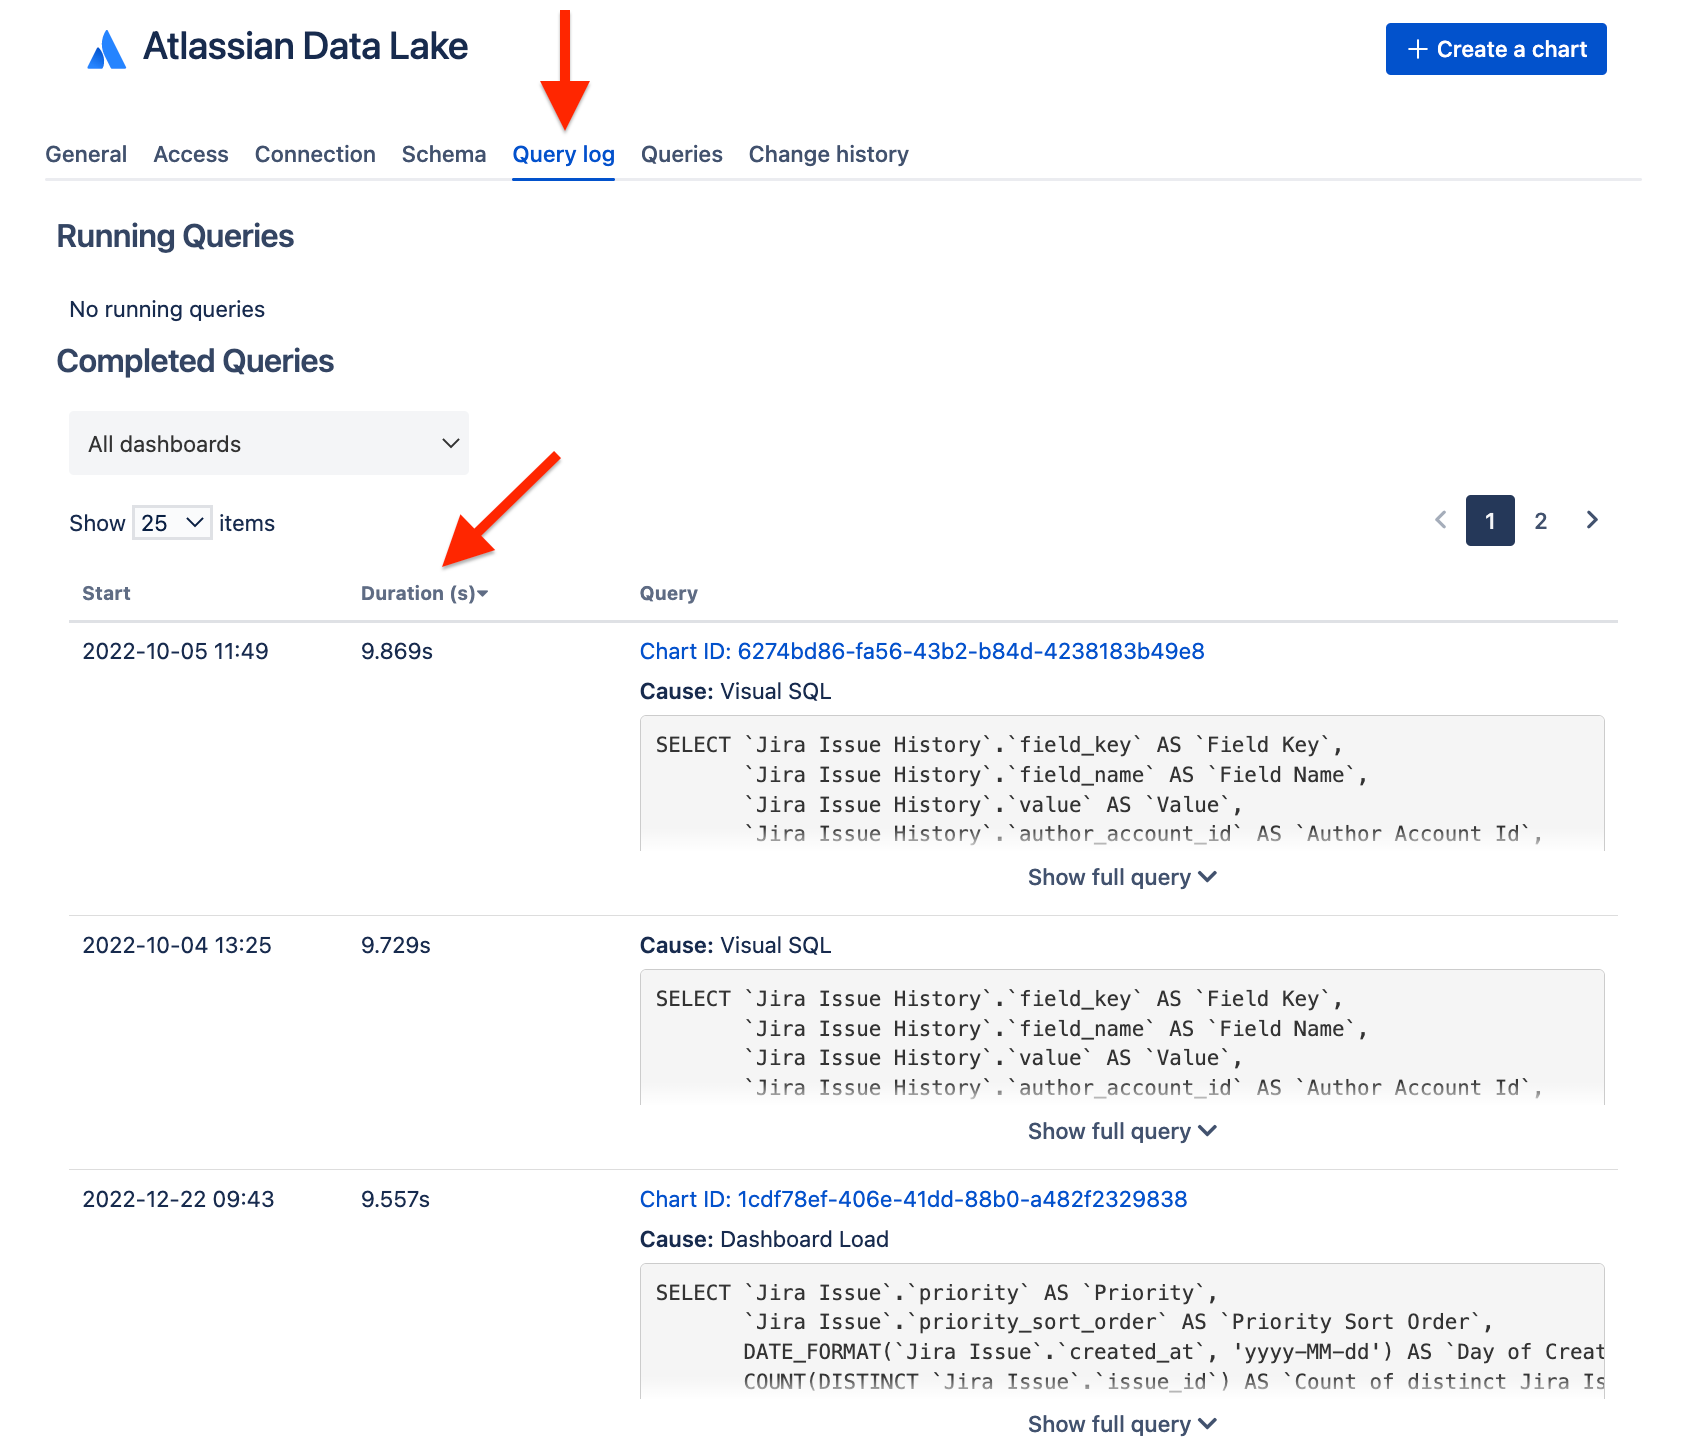
To locate long-running queries, you can sort your query log results by Duration descending.
Optimize queries
If you find that certain queries take longer to run, there are steps you can take to limit the load they put on your database.
Return a smaller subset of data (e.g. setting a limit on the query, aggregating the data)
Limit use of
WHEREclauses - especiallyINfilters with a long list of values (this includes variable controls such as categorical "Dropdown" controls)If you find yourself writing similar aggregated queries across multiple charts, consider creating one or more summary tables in your database. This way, the query results are already aggregated and/or filtered, and are saved to a table you can query directly.
Lower maximum query duration
In your data source settings, there is a maximum query duration setting. Any queries that take longer than the amount of time specified will be canceled. This can prevent long-running queries from tying up resources on your database server and slowing down other queries.
Increase cache duration
The cache duration is a dashboard setting that specifies how long query data is considered “fresh”. For dashboards that are currently open in a browser, new queries are sent to the database at this frequency. Increase this value to send queries to your database less often.
Create indexes
Create indexes or clustered indexes in your database. Indexes are like a table of contents for your database rows, which allows for faster data lookup.
Use the chart performance analysis
From Atlassian Analytics, you can check a chart’s performance data to see it’s query statistics over time.
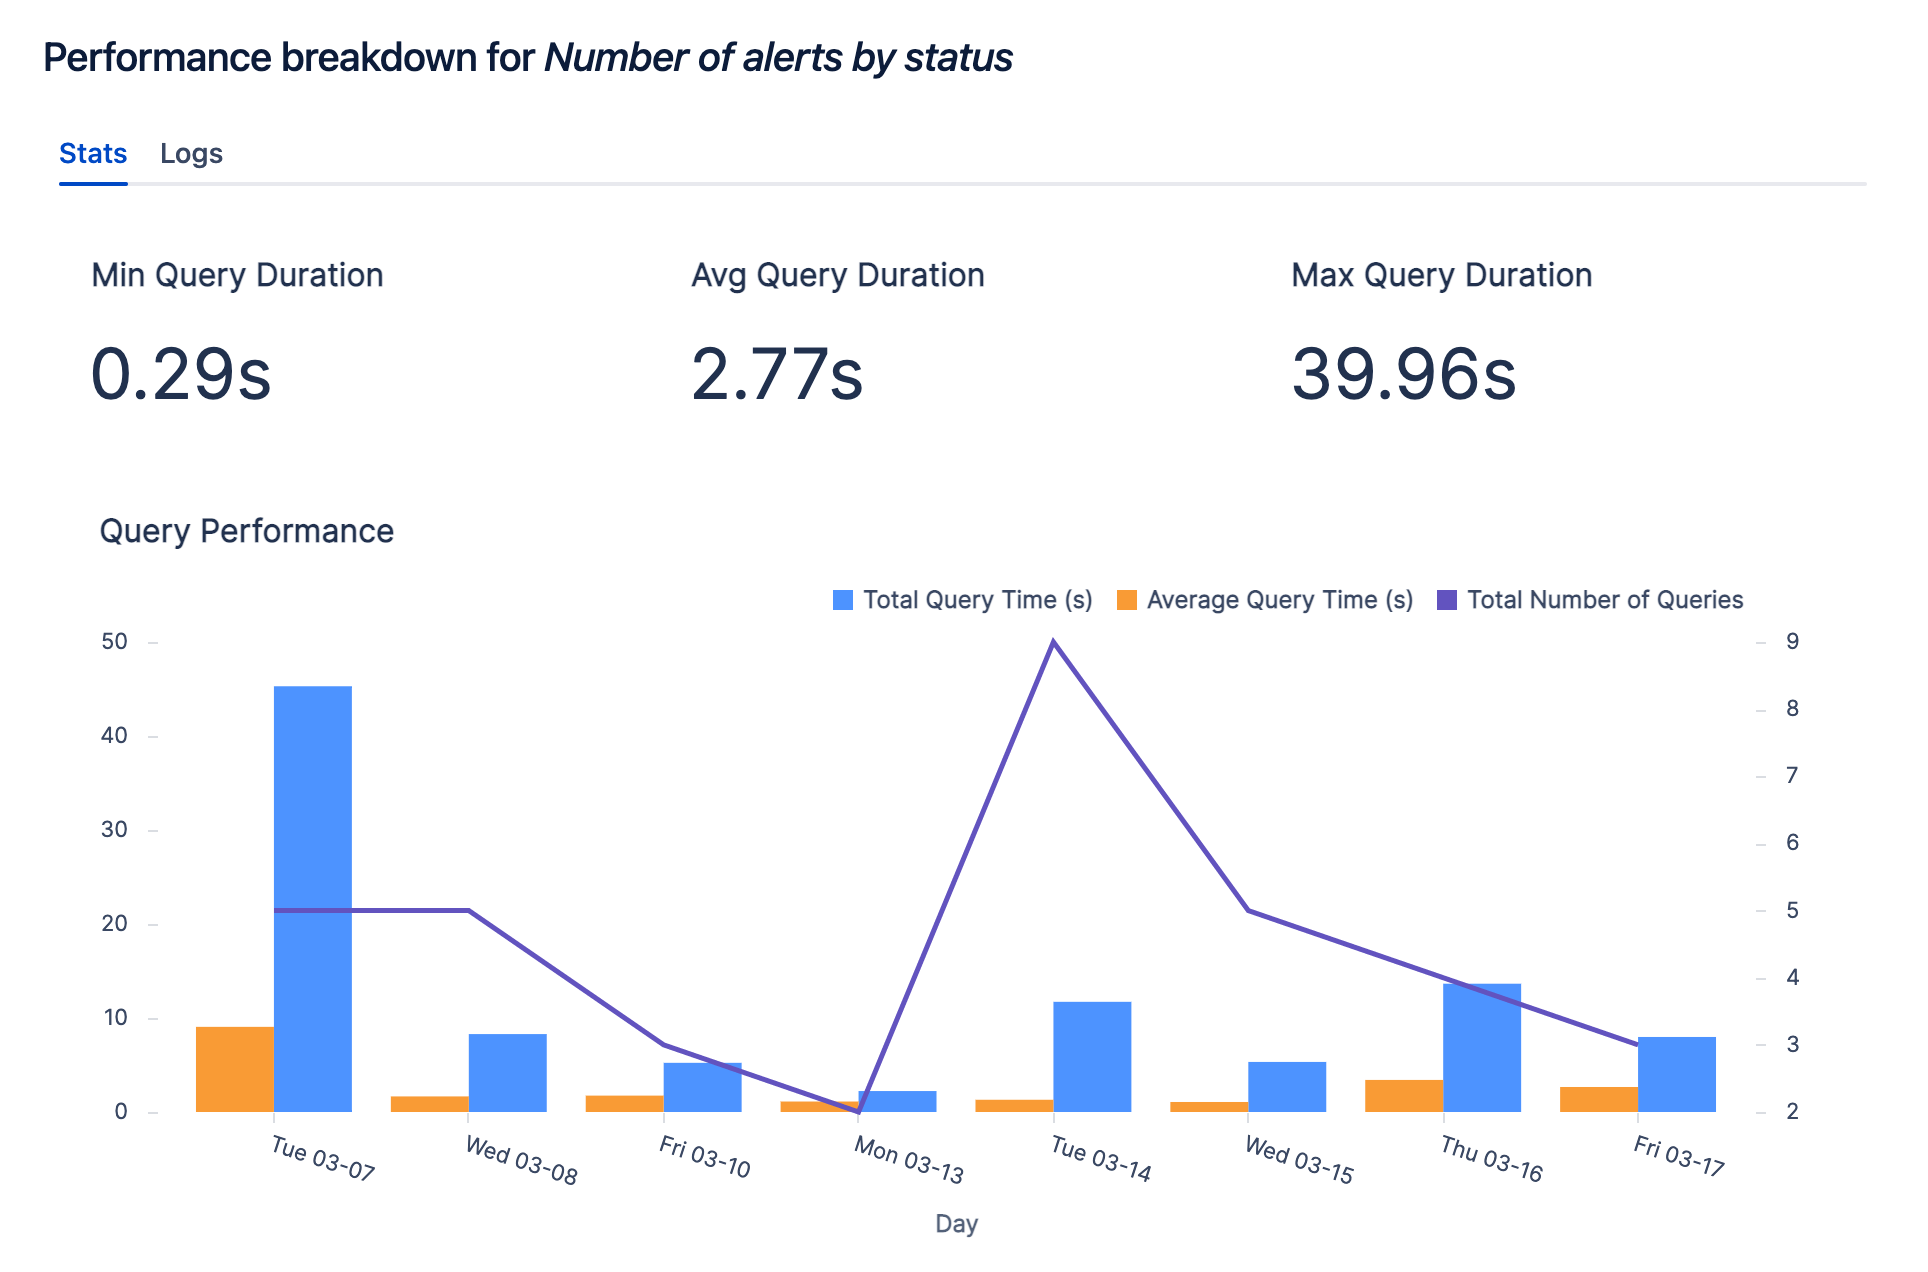
Hover over the chart which you would like to see the stats for. Click the ellipsis in the top right corner and select Review performance. This opens the Query Performance chart which sums up the stats from the last two weeks. Provided are the minimum query duration, average query duration, and maximum query duration.
The number on top can be used to identify the cause of the error message regarding data fetching. The biggest indicator is the average query duration; the minimum and maximum will help to provide context around the average query duration.
If both your average query duration and the minimum and maximum query durations are high, then your chart is taking too long to load because of the query itself. This can be alleviated by improving query performance or creating materialized views/summary tables.
If your average query duration and the maximum duration are high but the minimum duration is low, then this could indicate that the problem is related to your database’s performance. For example, at certain times of day, the database load can be high which causes your query to run slow as compared to when the database load is light, allowing queries to run efficiently.
The line over the bar chart shows the consistency of the performance.
If the numbers are consistently high, this likely means that the chart’s interaction with the data source(s) is long and could be due to the query being too complex or the underlying data being too large to sift through. One way to solve this is by simplifying or optimizing your query.
If the line is not consistent and you see spikes throughout the time outlined, consider your database load. At the times that correspond with the spikes there could be an additional load on your data source. We recommend looking at the data source’s query log to troubleshoot further.
Note: You must have permission to edit or manage the dashboard to view its charts’ performance data.

