Triaging dashboard performance issues
If you experience slow-loading dashboards and charts, there are changes you can make within Atlassian Analytics to address this. We recommend investigating and taking action on these key areas:
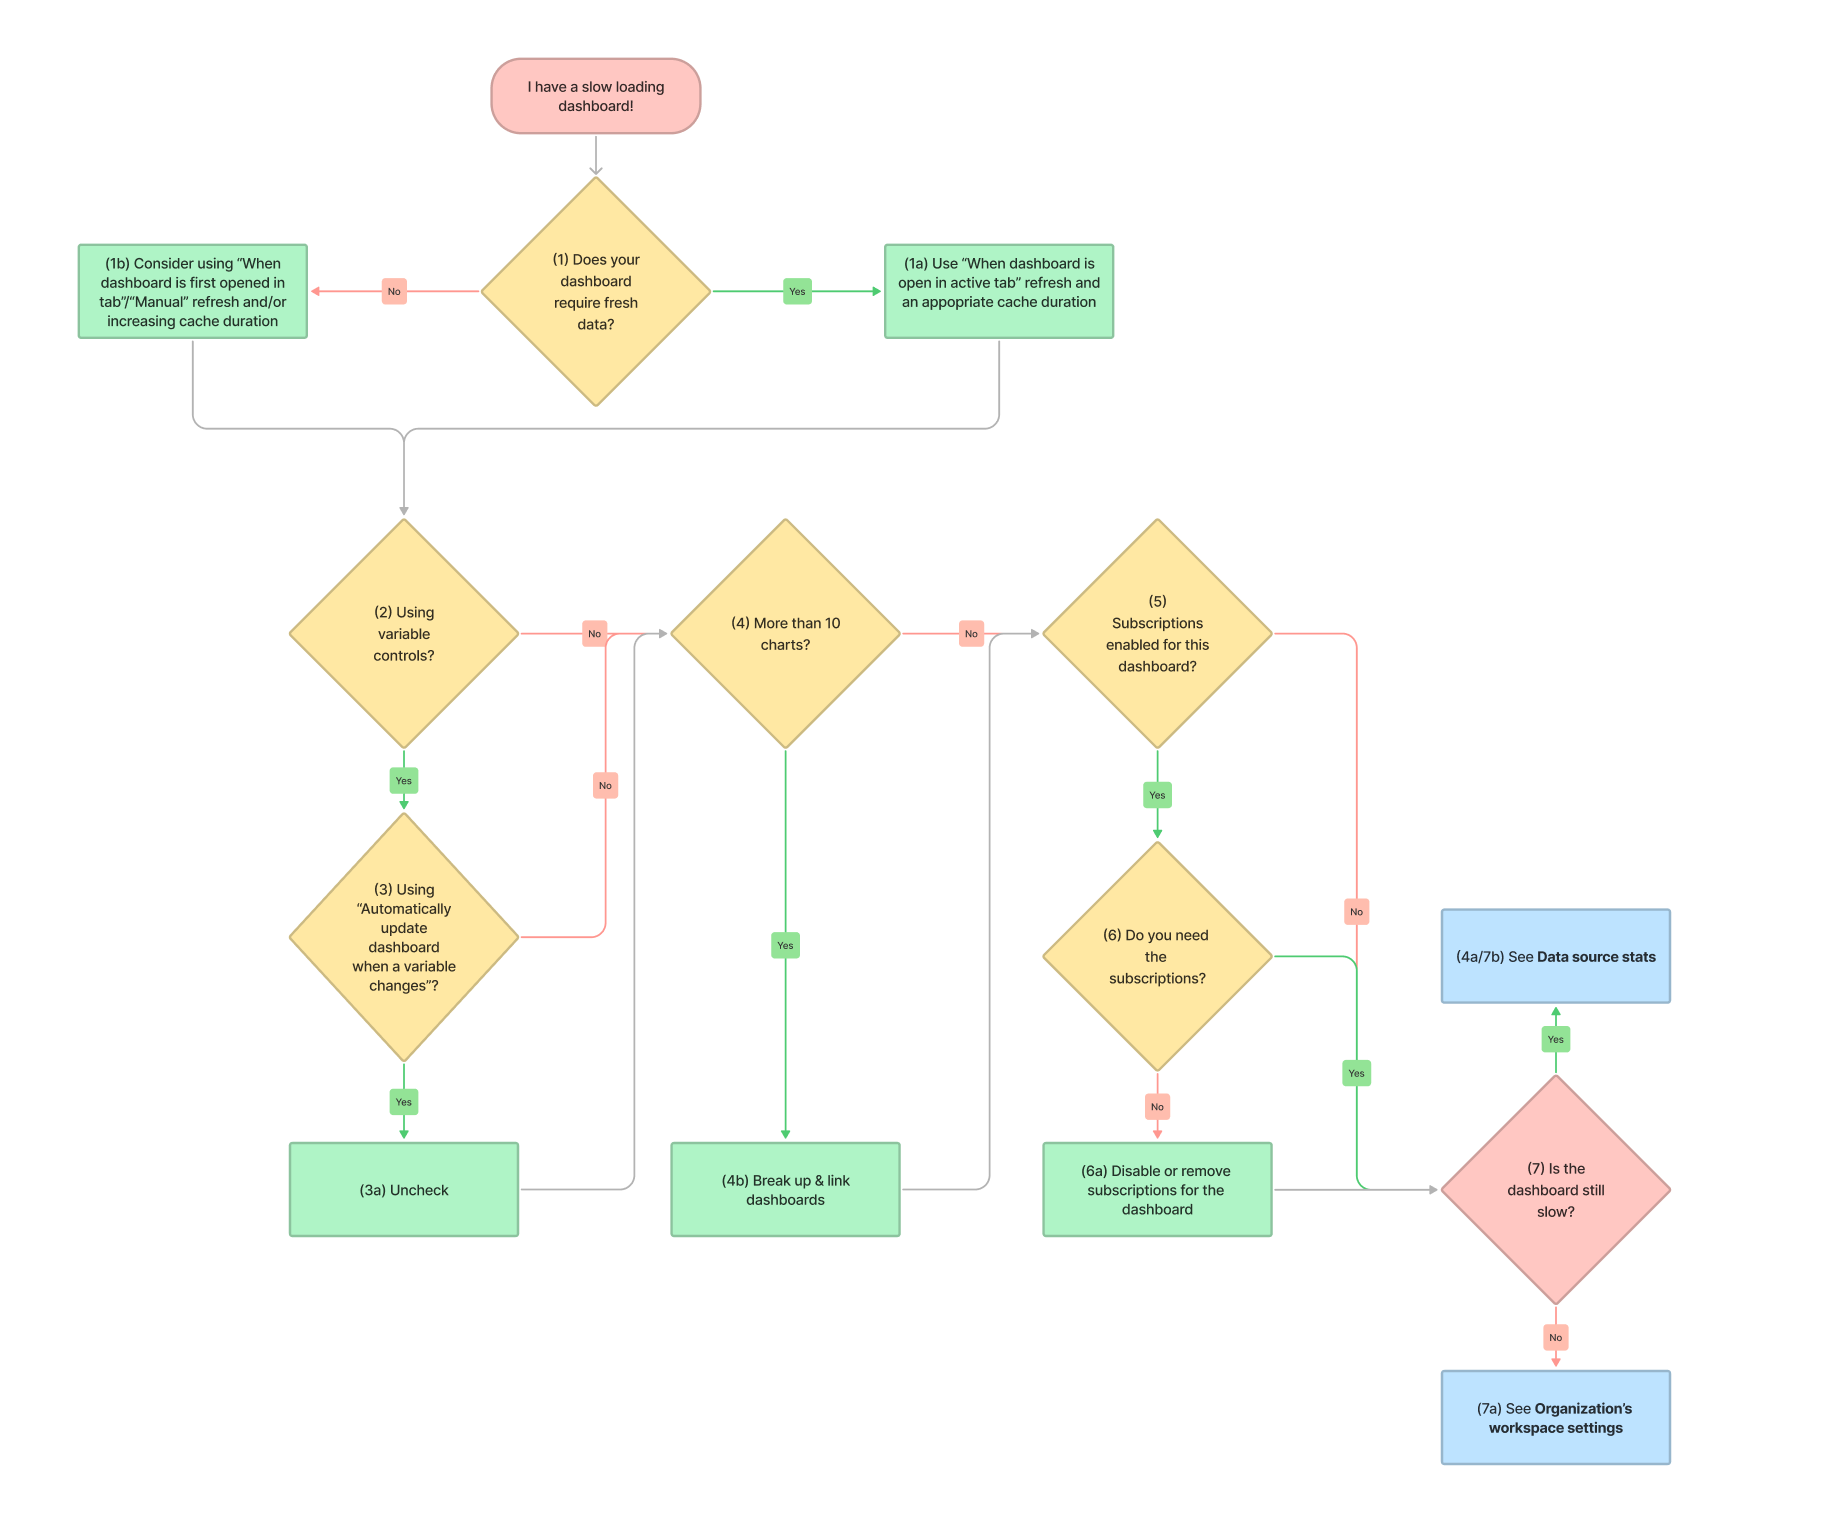
Follow our performance decision tree below to guide you through your performance optimization. We highly recommend going in the order we’ve set above.
Performance issues can seem daunting at first, so we also recommend bookmarking this page so you can easily reference it when needed.
When does Atlassian Analytics send queries to my data source?
Before we get to the weeds of performance optimization in Atlassian Analytics, it’s important to know when Atlassian Analytics sends new queries to your data sources. Sending new queries requires using your data source’s resources, and if your data source receives too many queries at one time, some or many of those queries may time out, leading to the performance issues you’re experiencing.
I. Check the dashboard features
If there’s a specific dashboard with slow loading charts, we recommend checking its dashboard features as the first step in your performance optimization journey. Modifying these settings may help alleviate your performance issues.
Does your dashboard require fresh data?
Yes, I need my data to be up-to-date often!
Update your If cache is expired, refresh dashboard setting to be When dashboard is open in the active tab and set an appropriate Cache duration.
Continue to Step 2.
No, I can deal with stale data for a bit.
Consider using the When dashboard is first opened in a tab or Manual refresh method and/or increasing the Cache duration.
Remember—if you ever need fresher data before the next refresh, you can always manually update a dashboard or individual chart’s data.
We’ve got more optimization recommendations though, so keep reading!
Does your dashboard have any Variable controls?
Check if Automatically update dashboard when a variable changes is selected in the dashboard settings.
It’s not. I’m ahead of the game.
Nice! Continue to Step 4.
It is. What should I do?
Deselect it.
If you have any variable controls on your dashboard, you can reduce the number of queries to a single query by deselecting Automatically update dashboard when a variable changes in the dashboard’s settings. Otherwise, a query is sent upon every variable control change, which could impact your data source.
Do you have more than 10 charts?
Nope, I’m a minimalist.
Not a lot of charts but your dashboard is slow? Interesting! Let’s continue to Step 5.
Yes, I’ve got a bunch of charts.
It’s best to have your most important charts at the top of the dashboard for quick and easy accessibility—we also prioritize loading those first. If you have any charts below the fold (i.e., you need to scroll down to see them), you should assess whether the charts are needed or if you can break the dashboard down then link them together.
This minimizes the number of queries a dashboard sends when refreshing, freeing up your data source resources. Overloading your data source leads to performance issues as your data source resources are taken up.
Do you have any Dashboard subscriptions for this dashboard?
Are those dashboard subscriptions necessary?
No, I don’t really need them anymore.
As we mentioned in the beginning, new queries are sent to your data source when you have dashboard subscriptions enabled for your dashboard. If you no longer need them, it’s best to remove them. If you don’t need them but don’t want to remove them in case you want to enable them again in the future, you can simply disable them:
Yes, I still need them.
No problem. We’ve got some best practices for using dashboard subscriptions, but we’ll get to those later. For now, just continue on to Step 7.
After making the recommended changes we’ve discussed so far, is your dashboard still slow to load?
Yes! What do I do now?
Time to check your Data Source Stats.
No, my issues were resolved!
That’s awesome! We’ve still got some recommendations for you though, so please check your organization’s workspace settings.
II. Check your Data Source Stats
Atlassian Data Lake
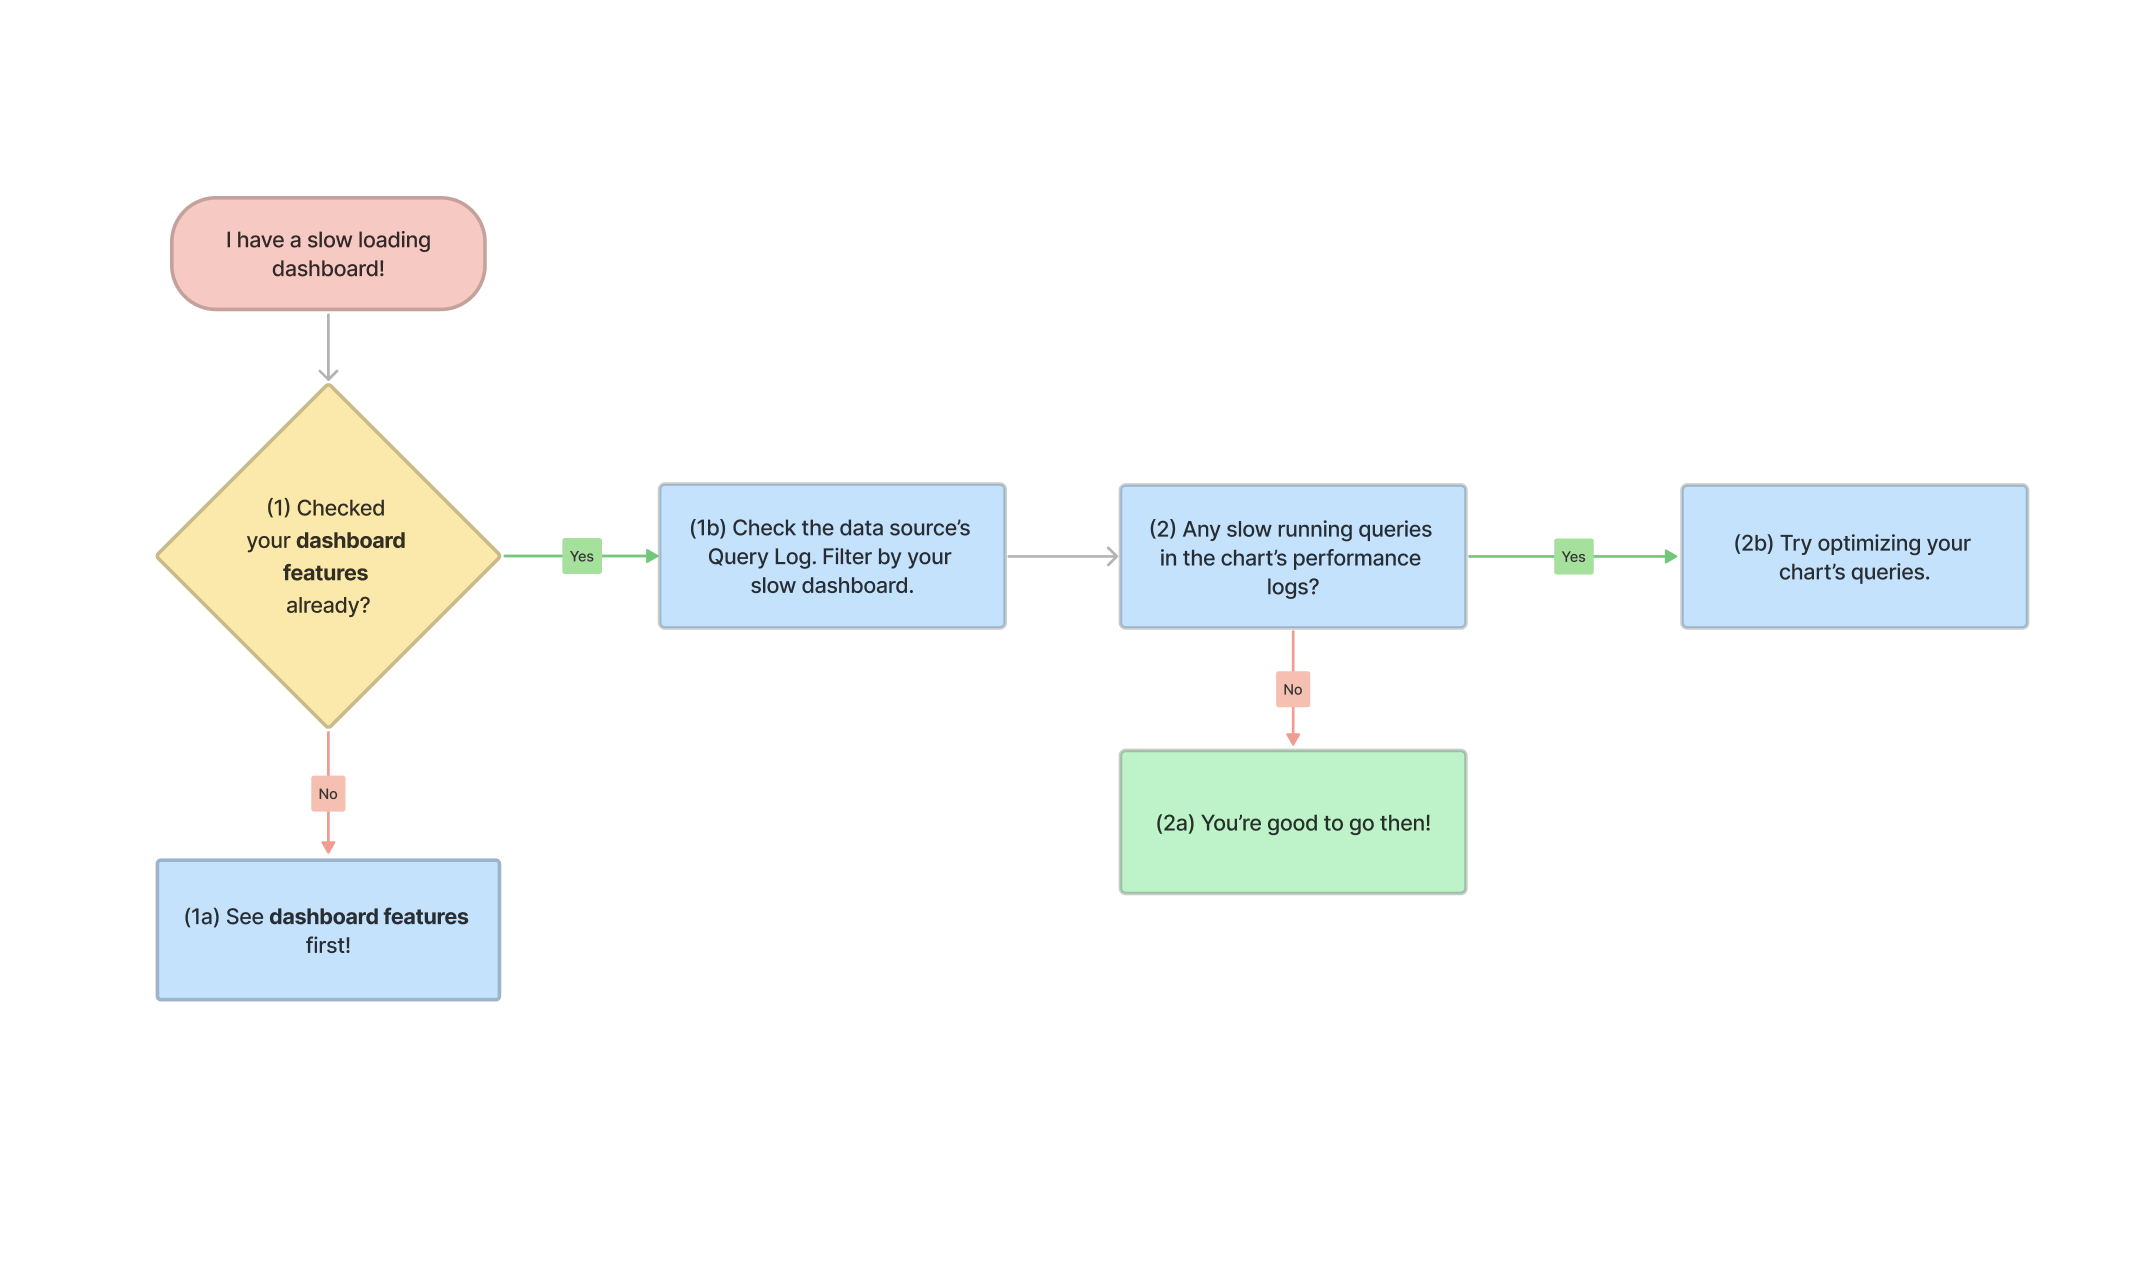
Have you checked your dashboard features already?
No, I skipped it!
We highly recommend you check your dashboard features first.
Yes, yes, I’ve already checked them. What’s the next step?
Every data source has a Query log, which provides a breakdown of the queries run against the data source and their performance. You can filter the Query log by your slow loading dashboard to see the query durations for the dashboard’s queries. The Query log can be sorted in ascending or descending order by the day the query was run or by the query duration.
For every data source queried by your dashboard, check if charts from your slow dashboard are displaying error messages or long query durations listed in that data source’s Query log.
If a chart from your problematic dashboard is slow running or has errors, review the chart’s performance. Does it have any performance-related errors (e.g., timeout errors) or long-running query durations?
I don’t see any performance-related issues.
Try to resolve the non-performance errors (e.g., syntax errors, relation errors, etc.). Once you’ve done that, check your organization’s workspace settings.
It does!
Try optimizing your queries for the chart. This can be tricky and require some creative thinking. One option is to reduce the amount of joins in your Query or optimizing the join paths used in your SQL code. A second option is to reduce the row limit of your Query to have fewer rows returned. Another option is to consider moving some of the aggregations/manipulations outside of the Query—into Visual SQL steps. These transformations performed outside of the query are post-SQL manipulation, so new queries aren’t sent to the underlying data sources when you add more transformation steps, as long as the initial Query doesn’t change.
Once you’ve done that, please check your organization’s workspace settings.
3rd party data sources
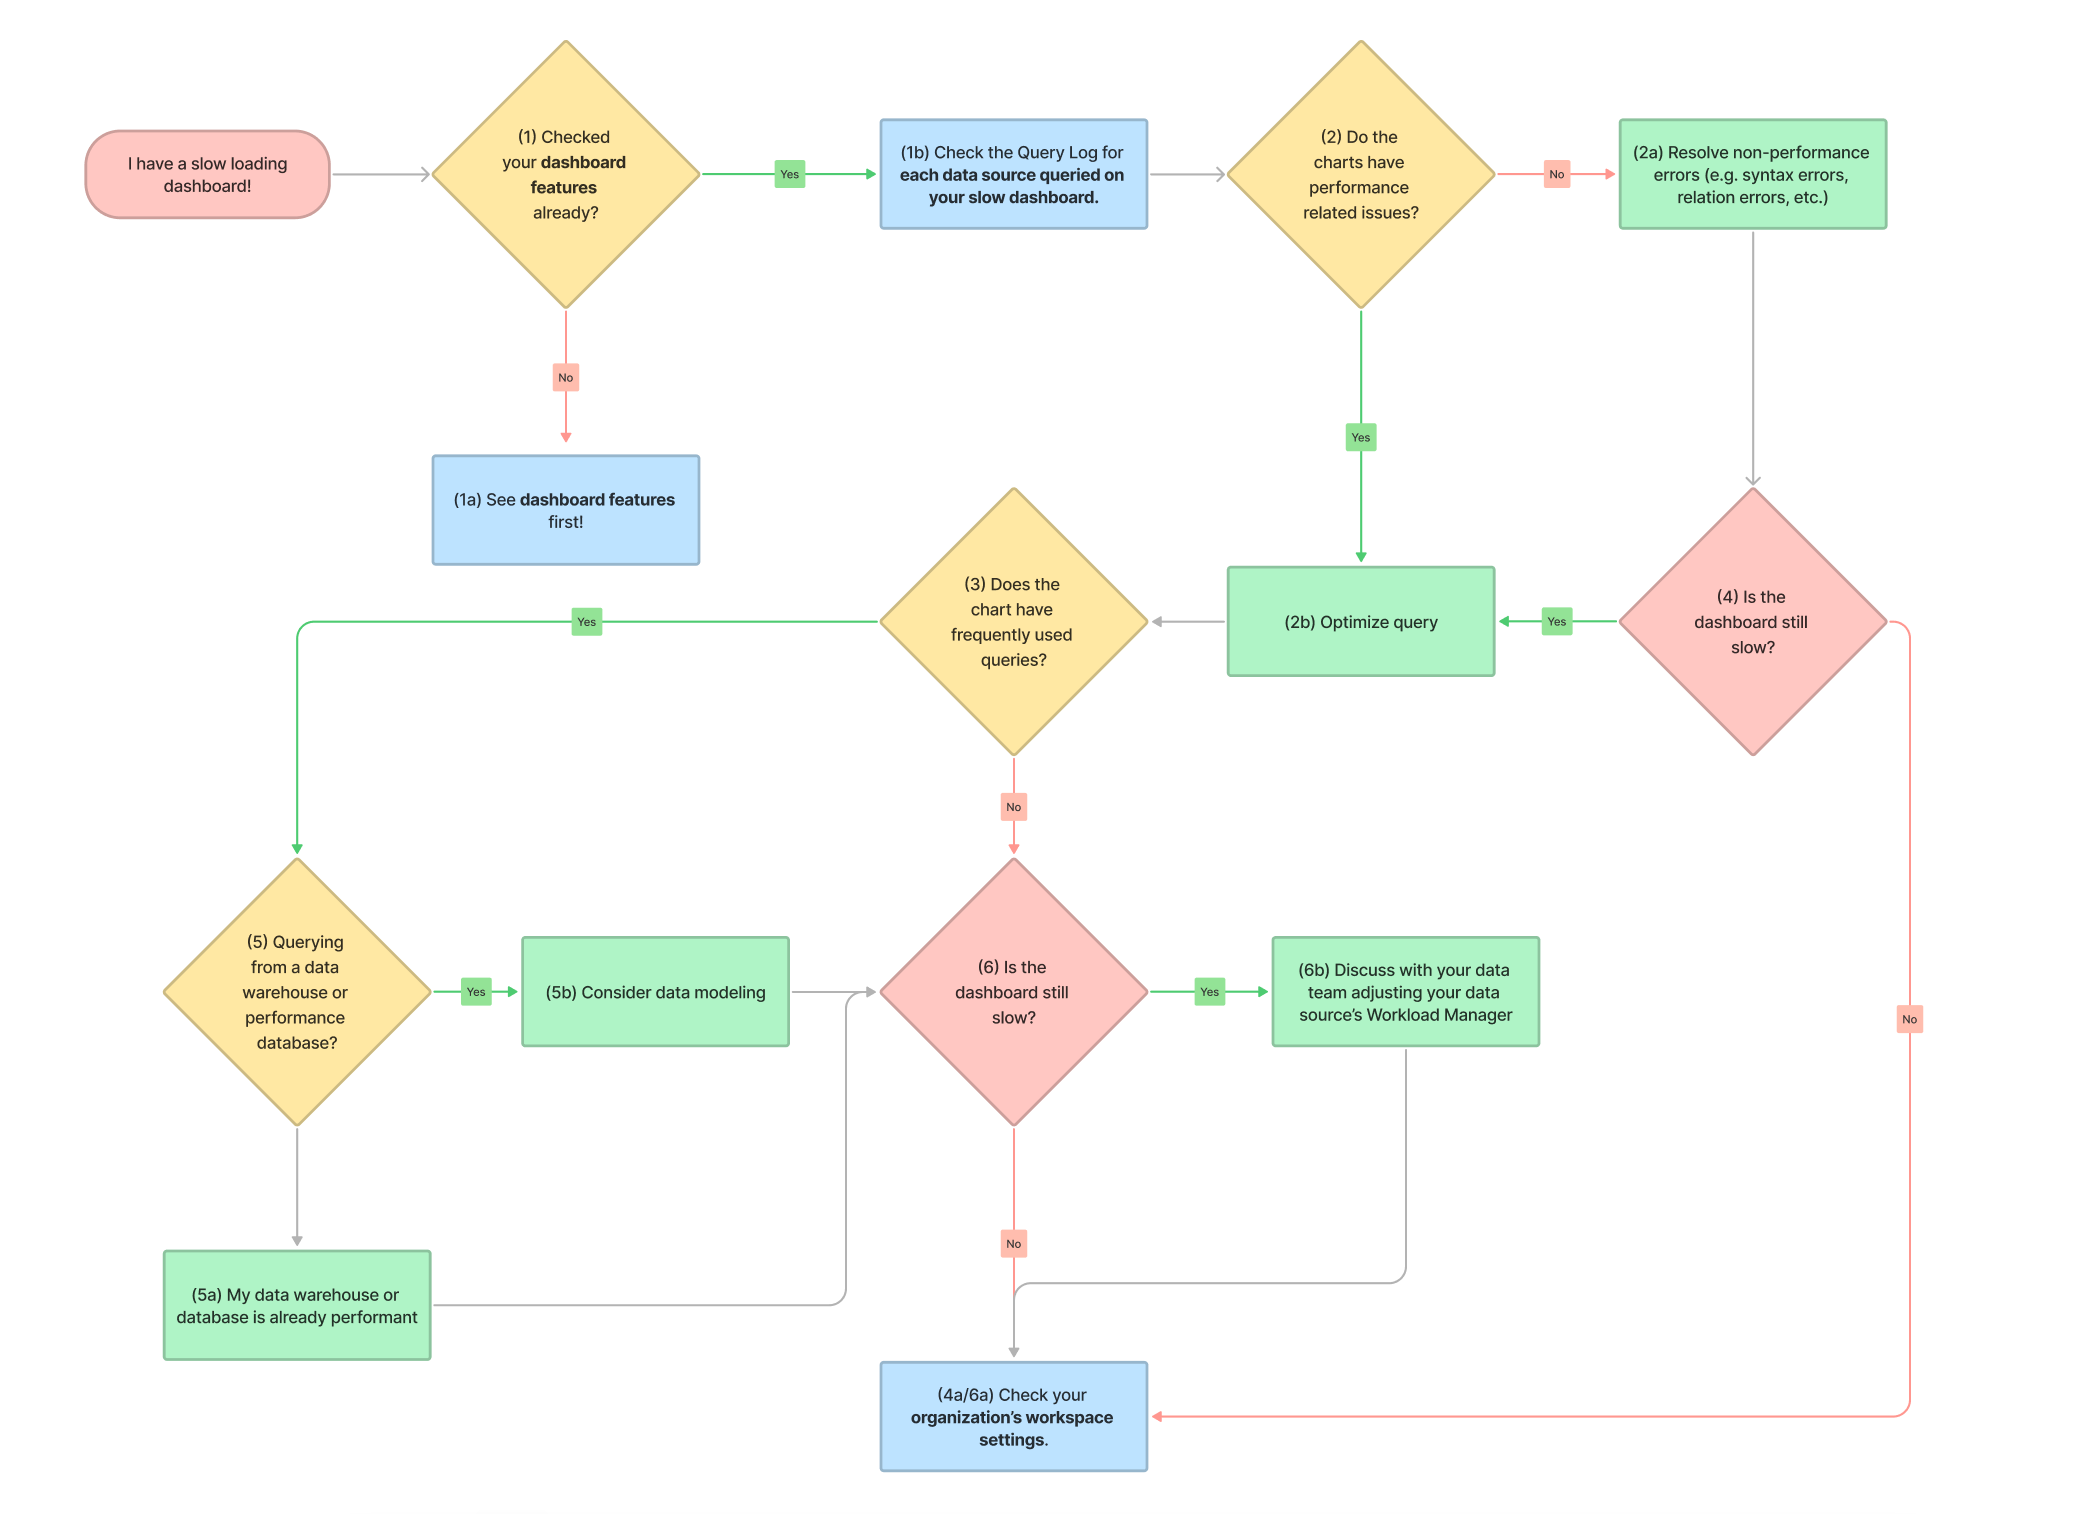
Have you checked your dashboard features already?
No, I skipped it!
We highly recommend you check your dashboard features first.
Yes, yes, I’ve already checked them. What’s the next step?
Every data source has a Query Log, which provides a breakdown of the queries run against the data source and their performance. You can filter the Query Log by your slow loading dashboard to see the query durations for the dashboard’s queries. The Query Log can be sorted in ascending or descending order by the day the query was run or by the query duration.
For every data source queried by your dashboard, check if charts from your slow dashboard are displaying error messages or long query durations listed in that data source’s Query Log.
If a chart from your problematic dashboard is slow running or has errors, review the chart’s performance. Does it have any performance-related errors (e.g., timeout errors) or long-running query durations?
I don’t see any performance-related issues.
Try to resolve the non-performance errors (e.g., syntax errors, relation errors, etc.). Once you’ve done that, skip to Step 4.
It does!
Try optimizing your queries for the chart. This can be tricky and require some creative thinking. One option is to reduce the amount of joins in your Query. This can be done by breaking one visual mode Query into multiple Queries, or optimizing the join paths used in your SQL. A second option is to reduce the row limit of your Query to have fewer rows returned. Another option is to consider moving some of the aggregations/manipulations outside of the Query—into Visual SQL steps. These transformations performed outside of the query are post-SQL manipulation, so new queries aren’t sent to the underlying data sources when you add more transformation steps, as long as the initial Query doesn’t change.
Once you’ve done that, move on to Step 3.
Does the chart have any frequently used queries?
After resolving your non-performance errors, is your dashboard still slow to load?
No, problems are solved and my dashboard is loading just fine!
That’s awesome! We’ve still got some recommendations for you though, so please check your organization’s workspace settings.
Yes, it’s still slow…
That’s a bummer… But don’t give up yet! Go back and try our recommendation for Step 2b.
Is the query (or queries) pulling data from a data warehouse or performant database?
Is your dashboard still slow to load?
No, everything’s great now!
That’s awesome! We’ve still got some recommendations for you though, so please check your organization’s workspace settings.
Yes, do I have more options?!
We recommend discussing with your data or engineering team about adjusting your data source’s Workload Manager or maximum user connections. After adjusting the data source settings on your end, try Step 6 again.
III. Check your dashboard subscriptions
What exactly are dashboard subscriptions? Good question! A dashboard subscription is a scheduled email containing a PDF or CSV of your dashboard. Dashboard subscriptions have schedule settings, which you set to tell Atlassian Analytics when to trigger them. When the dashboard subscription is triggered, new queries are sent to your data source. If you have all your dashboard subscriptions triggering at the same time, this could overwhelm your data source, resulting in potential timeout errors.
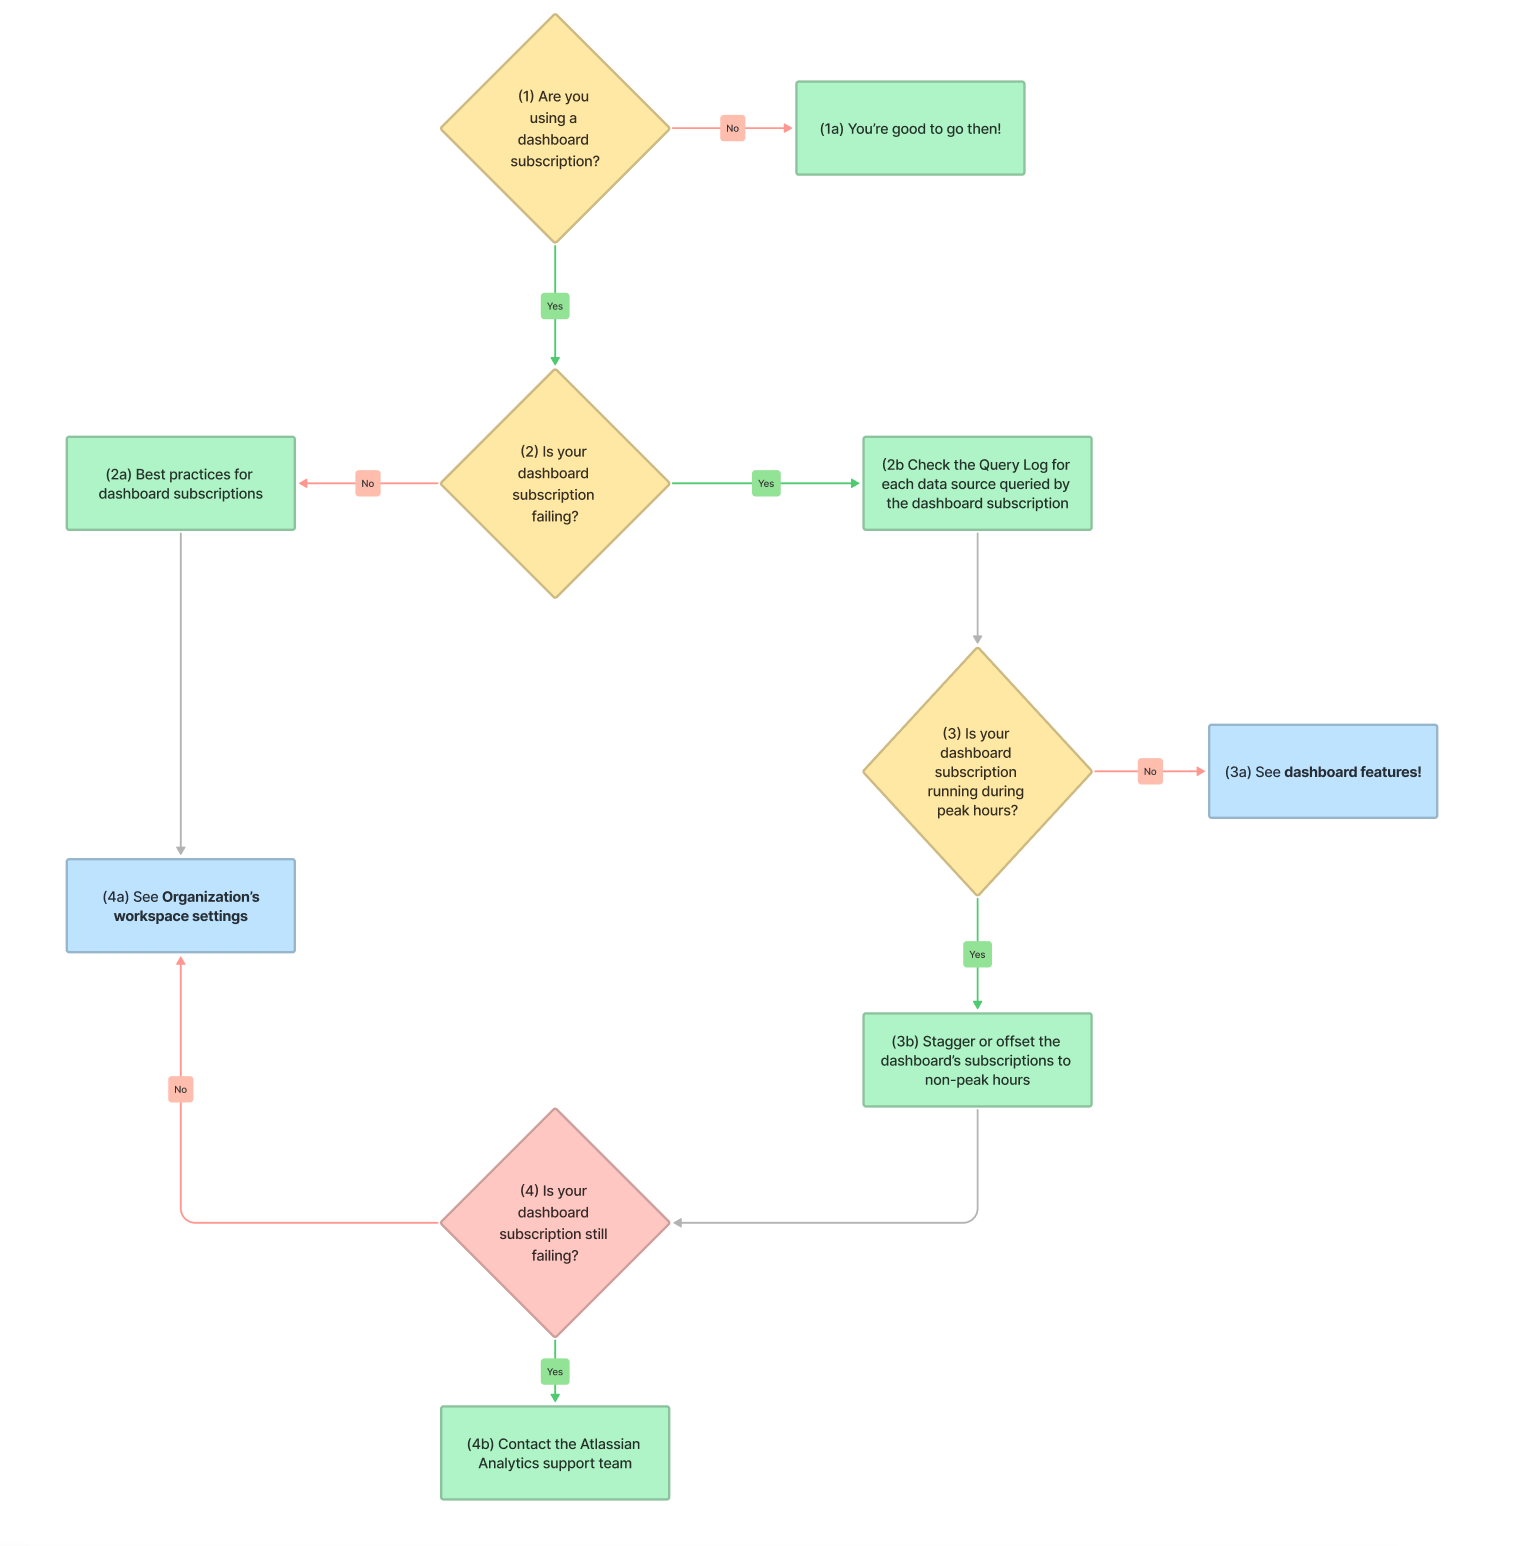
Are you using dashboard subscriptions?
Nope!
You’re good to go then! You don’t need this triage.
Yes.
Continue to Step 2.
Is your dashboard subscription failing (i.e. your PDF or CSV of the dashboard has charts with timeout errors)?
No.
Cool! Let’s go over some best practices for dashboard subscriptions so you don’t run into performance issues later on.
If you have any dashboard subscriptions, try to:
Stagger them—so they don’t send queries at the same time
Offset them to non-peak hours—so they don’t send queries during high traffic times like during business hours
Doing the above will help to ensure your data source has enough resources available when your dashboard subscriptions are triggered. In other words, your dashboard subscriptions will most likely not fail.
See our answer for Step 4a.
Yes!
For each data source queried by your dashboard subscription, go to the data source’s Query Log page and look at the Start column to see how many queries are running at once then continue to Step 3.
Is your dashboard subscription triggered during peak hours?
No, but it’s still failing.
That’s not good… If you haven’t already, check your dashboard features.
Yes, is that bad?
If you’re triggering a dashboard subscription during peak hours, it’s competing with other potentially dashboard subscriptions in addition to the other reasons why Atlassian Analytics triggers queries, which could explain why your dashboard subscription is failing.
If you have any dashboard subscriptions, try to:
Stagger them—so they don’t send queries at the same time
Offset them to non-peak hours—so they don’t send queries during high traffic times like during business hours
Doing the above will help to ensure your data source has enough resources available when your dashboard subscriptions are triggered. In other words, your dashboard subscriptions will most likely not fail.
After doing this, continue to Step 4.
Is your dashboard subscription still failing?
No, all good!
Perfect! To prevent future dashboards from impacting your data sources, please check your organization’s workspace settings.
Yes…
After checking your dashboard features and data source stats, your dashboard subscription is still failing? Contact the Atlassian Analytics support team for help.
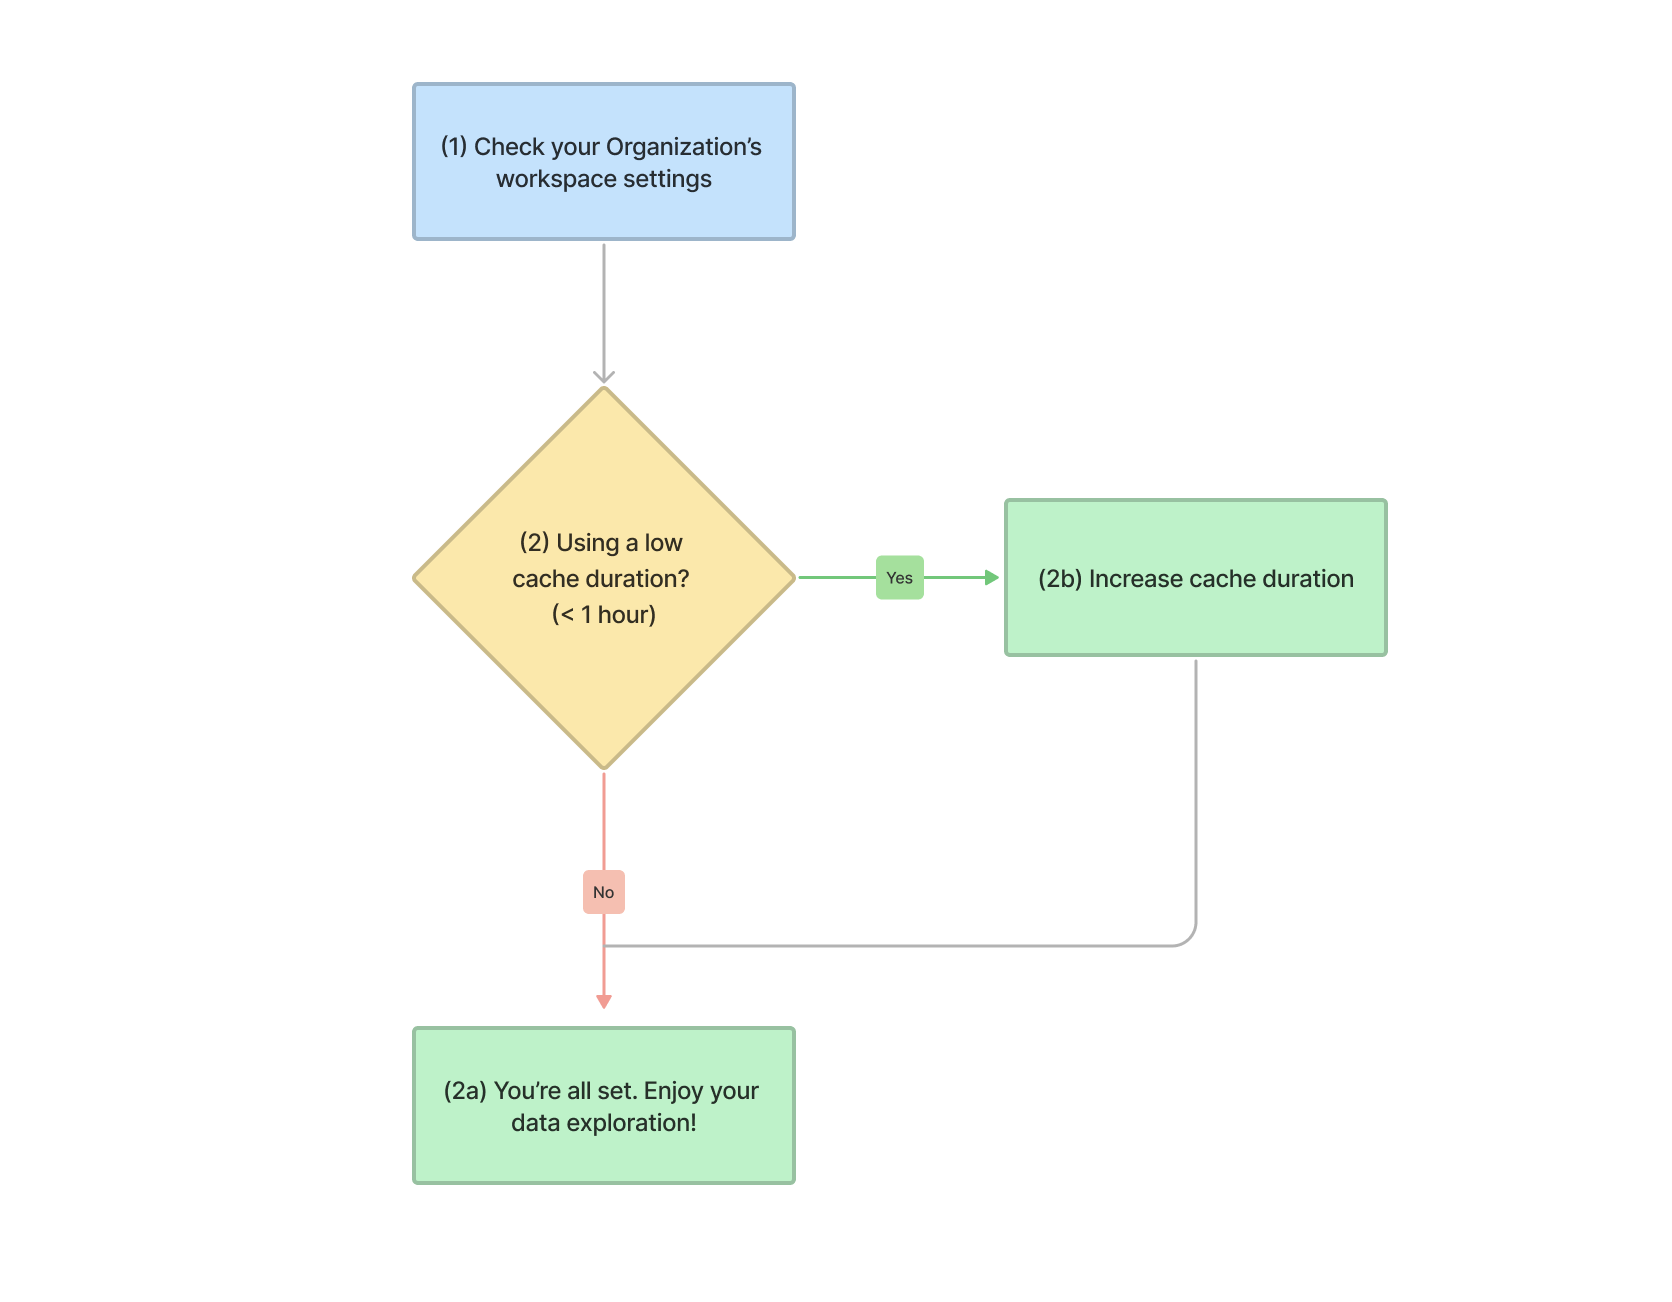
IV. Check your organization’s workspace settings
If you’re an Organization or Product administrator, you can take some preemptive actions by changing your organization’s workspace settings. Changing these settings won’t affect existing dashboards, but they will affect new ones.
Is the cache duration low (e.g., one hour or less)?
No, we don’t update our cache that often.
Cool! You’re all set! Enjoy your data exploration!
Yes, what does it mean?
Consider increasing the cache duration. Lower cache durations mean new queries are sent to your data source more frequently. If you don’t expect your data to change often, it’d be a good idea to increase the cache duration to a more reasonable time. Plus, you can always lower the cache duration for individual dashboards, if needed.
As we mentioned earlier, updating your organization settings won’t affect your existing dashboards, so you still need to update the cache duration and refresh method for any existing dashboards experiencing slow performance.
We hope this guide helped you resolve your performance issues. If you have any questions or are still experiencing performance issues, feel free to contact the Atlassian Analytics support team for further help.
