Viewing the Clover code-coverage for a plan
If you use Atlassian's Clover and your job specifies a Clover directory (see Enabling Clover for Bamboo), you will be able to view the Clover coverage summary for the plan.
To view the Clover coverage summary for a plan:
- Go to the desired plan.
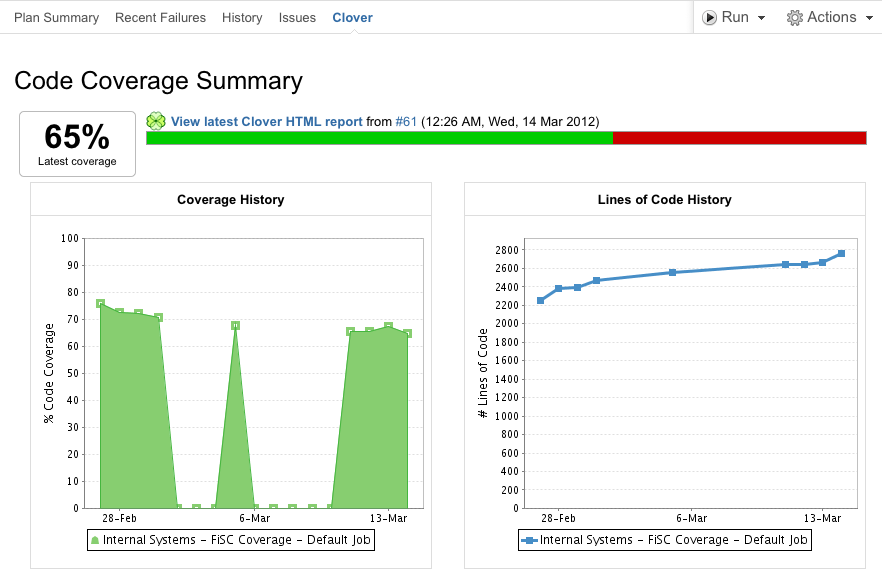
- Select the Clover tab. The Code coverage summary information includes:
- Latest coverage from the most recent build as a percentage and bar representation (aggregated results from all Clover-enabled jobs).
- A link to detailed HTML reports.
- Coverage History chart showing changes in percentage Code Coverage over time.
- Lines of Code History chart showing changes in LOC over time.
Note:
- Charts are only generated when build results from at least a 2-day span are available. Where shorter time spans are available, the user will receive a warning stating "Insufficient data in range to draw the chart."
- Where your plan contains multiple jobs with Clover, then Code Coverage and Lines of Code values are aggregated from all these jobs.
- Bamboo 5.6.0 and older: If your plan contains multiple jobs with Clover, the View latest Clover HTML report link will point to the default job only. In order to see other reports, you must go to the specific job summary, as described in Viewing the Clover code-coverage for a build.
Last modified on Jun 23, 2021
Powered by Confluence and Scroll Viewport.

