Troubleshooting Bitbucket Pipelines
This page provides self-serve troubleshooting steps for Pipeline run failures and other common issues.
- Scenario 1: Builds were successful earlier, but started failing recently
- Scenario 2: Pipeline build failed with Container “Build” exceeded memory limit error
- Scenario 3: Pipelines build failed with Command not found error in the build log
- Scenario 4: Bitbucket pipeline is failing with Exceeded build time limit error
- Scenario 5: Build Technology and Test Framework
- Scenario 6: Pipeline build failed with "Step exceeded processing limits and has timed out" error
- Scenario 7: Artifacts related issues
- Scenario 8: Pipeline build cache-related issues
- Scenario 9: Git Submodule not being cloned in the Pipeline build
- Scenario 10: The build setup running longer than expected
- Scenario 11: The build was not triggered for a particular commit
- Scenario 12: Pipeline build failed with Container “Docker” exceeded memory limit error
- Scenario 13: Pipeline build failed with "unexpected system error that may have left your step half-completed"
Scenario 1: Builds were successful earlier, but started failing recently

Possible causes:
Code change
Build image change by the vendor
Workspace/Repository/Deployment variables change
Third party dependency outage/change
Bitbucket Outage
Pipeline Infrastructure change
Troubleshooting Steps:
Rerun the last successful build by selecting the build number and clicking on the Rerun button. Is it still successful on re-run?
YES ![]()
Review code changes between successful and failed builds and investigate why the build is failing.
NO ![]()
Abstract Bitbucket pipelines infrastructure and test build locally by following the steps outlined on Troubleshoot failed pipelines locally with Docker.
If the same build fails locally, then this is not an issue with Bitbucket pipelines infrastructure or configuration and you need to continue troubleshooting steps until you are able to run this build successfully with docker.
If the same build is successful when testing locally with docker, then please raise a Support Ticket and share the logs from your locally run build.
- Other things to consider
Compare the build image SHA (example: build : docker.io/library/python@sha256:03ac9e...) between successful and failed builds in the Build setup section of the build log. You can find the Build setup section as the first section in the Build tab in the Pipeline log. If there is a change, use the image hash from the successful build by pinning the exact image SHA in the bitbucket-pipelines.yml as instructed Pin images by digest section on this page and run the build.
Check if there is a recent change in the Workspace, Repository, and Deployment variables. If there is a change, use the previous values of variables and rerun the failed build.
Are you using any 3rd party platform for images? If yes, check if they are having an outage by going to the appropriate status page. The following list provides links to some major third-party image platforms. You may have to reach out to the third-party platform’s support team and raise the ticket.
Other dependencies can also change. Pin the versions of code dependencies if packages were installed using e.g. via apt, yum, apk, those versions may have changed
Check if Bitbucket Cloud had or is currently having an outage by visiting the Bitbucket status page. If there is an incident that could be causing the run failure, then re-run the failed build once the incident is resolved.
Check if Bitbucket Pipelines has a recent infrastructure update by visiting the Bitbucket Infrastructure. Use the recommendations if there are any.
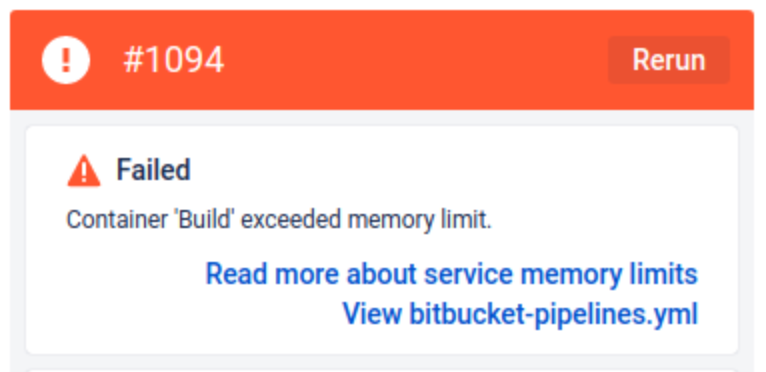
Scenario 2: Pipeline build failed with Container “Build” exceeded memory limit error
Scenario 2.1: Generic scenario
Possible causes:
The build requires more than the allowed build container memory
Troubleshooting Steps:
Debug the build locally using the instructions on Debug pipelines locally with the Docker page. Note, memory limit issues can’t be debugged locally on macOS because you can’t configure swap memory below 100Mb on macOS. Does the build fail locally with a similar memory error?
YES ![]()
Run the below commands in the Pipeline and observe which process is consuming more memory. This can help to narrow down the issue, identify the culprit, and take action.
- while true; do echo "Memory usage in bytes:" && cat /sys/fs/cgroup/memory.current; echo "Swap memory usage in bytes:" && cat /sys/fs/cgroup/memory.swap.current; sleep 2; done &
- while true; do date && ps aux && echo "" && sleep 2; done &
Increase the allocated memory (using size attribute) for the Pipeline build and check if you are still getting the memory-related issue. Refer to Databases and service containers page for more information on memory allocation in Pipelines.
 Note: Opting for larger step sizes may impact billing
NO ![]()
Use the below sections to troubleshoot the issue further. Otherwise, raise a Support Ticket and share the Pipeline build URL from http://bitbucket.org
Scenario 2.2: Builds using Jest Test Framework are slow or frequently hang (based on the Pipeline build minutes consumption) or failed with Container “Build” exceeded memory limit error
Possible causes:
A large number of workers running concurrently
Troubleshooting Steps:
Print Process list and Memory Usage in the background just before the test command starts in the Pipeline.
- while true; do ps -aux && sleep 5; done &
- while true; do echo "Memory usage in megabytes:" && echo $((`cat /sys/fs/cgroup/memory.current | awk '{print $1}'`/1048576)) && sleep 0.1; done &
The output of the process list will show how many workers are running at the time when the build is slow or when it gets OOM(Out of Memory) and you can see the CPU and Memory Usage along with the worker process.
Does the output show around 4-7 worker processes with high CPU / Memory usage?
YES ![]()
JEST by default creates 7 child workers, and the daemon process that calls the Jest Test assigns the memory to each of these Jest workers. If you have up to 2 GB per worker (as an example) configured, and all 7 of these workers are running concurrently, it could easily reach OOM(Out of Memory). This can result in the build running slowly or appearing stalled as the build container doesn’t have enough memory allocated. To fix the issue, take the following steps.
Add this command --maxWorkers=2 to your build command to limit the number of workers to 2.
Alternatively, you should be able to define it in package.json or in jest config as mentioned on Configuring Jest page.
NO ![]()
Raise a Support Ticket and share the Pipeline build URL from bitbucket.org
Scenario 3: Pipelines build failed with the following error in the build log:
<command_name>: Command not foundPossible causes:
The PATH variable is defined as one of the pipeline variables
Troubleshooting Steps:
Is a PATH variable defined as in Workspace, Repository, or Deployment variables?
YES ![]()
Defining a variable with the name PATH in Workspace, Repository, or Deployment variables overrides the default $PATH variable on the build image and results in the following error:
<command_name>: Command not foundTo fix the issue, avoid using "PATH" as a variable name in the workspace, repository, and deployment variable sections. Try using a detailed name that adds more context on why the variable is being used, for example: "remote_path", "web_path", "destination_path" etc.
Note, BCLOUD-20162 tracks a feature request to alert users on the Pipeline variable page to avoid using "PATH" as a variable name.
NO ![]()
Is the command being executed on the build is installed on the build image? If not, install the command on the build image. If the command is installed and still getting the error then raise a Support Ticket and share the Pipeline build URL from bitbucket.org.
Scenario 4: Bitbucket pipeline is failing with Exceeded build time limit error.

Possible causes:
Time consuming processes in the Pipeline build
Troubleshooting Steps:
Check if there are time consuming processes in the Pipeline build. You can execute the command date +"%T" before and after each build command to find out which processes are taking more time than expected in the Pipeline. Also, test the build locally using command date +"%T" to check which processes are consuming a large number of minutes by following the steps outlined on Debug pipelines locally with Docker page.
Are the processes taking a similar amount of time in the Pipelines and local builds?
YES ![]()
Investigate the processes and identify why they are running for a longer time. Use the online resources based on the command and technology being used to identify what measures can be taken to reduce the process durations.
- Increase the max-time property for the build step or option as mentioned in the max-time section of Configure bitbucket-pipelines.yml page. (By default this is set to 120 minutes).
If there is a command waiting for user interaction then make sure these commands are run in a non-interactive mode.
Increase the build container memory size to 2x, 4x, or 8x as mentioned in the size section of Configure bitbucket-pipelines.yml page
If the total build time is unable to be reduced, please raise a Support Ticket mentioning the workspace name and the use case of running the step for longer. The Support team will exempt to run the step for more time, if possible.
NO ![]()
Raise a Support Ticket and share the Pipeline build URL from bitbucket.org
Scenario 5: Build Technology and Test Framework
Scenario 5.1: Network connection issue while installing packages with Yarn with one of the following errors in the build log:
error An unexpected error occurred: "https://registry.yarnpkg.com/@material-ui/core/-/core-4.11.3.tgz: ESOCKETTIMEDOUT".
info There appears to be trouble with your network connection. Retrying...
 "ENOENT: no such file or directory"
Possible Causes:
Large package size
Slow network connection
Multiple concurrent package installation processes
Troubleshooting Steps:
Is there a Timeout error in the build logs (as mentioned below) while connecting to the yarn registry? Sometimes you may need to add verbose output to see additional build logs.
error An unexpected error occurred: "https://registry.yarnpkg.com/<package>: ESOCKETTIMEDOUT".
info There appears to be trouble with your network connection. Retrying...
YES ![]()
The package that is being installed might be too large or the network connection might be too slow for the package/dependency to be downloaded with the default NETWORK_TIMEOUT is 30 seconds. Add --network-timeout parameter with a higher value to increase the timeout period. For example, to increase the timeout to 300,000 milliseconds (5 minutes):
yarn add <yourPackage> --network-timeout 300000Does yarn install fail with the following error?
"ENOENT: no such file or directory"
YES ![]()
By default, yarn allows 50 concurrent requests. We can configure yarn to install packages sequentially instead. Add --network-concurrency 1 to yarn install command. For example:
yarn install --network-concurrency 1NO ![]()
Raise a Support Ticket and share the Pipeline build URL from bitbucket.org
Scenario 5.2: Gradle Tests show the following error in the build log:
org.gradle.api.internal.tasks.testing.TestSuiteExecutionException:
Could not complete execution for Gradle Test
Possible Causes:
JVM for the worker process is running out of memory.
When you are using Gradle to run tests, there are two main processes, which are Gradle Daemon and Gradle worker process. The daemon and worker handle JVM memory allocation separately.
Troubleshooting Steps:
Add --stacktrace or --debug to your Gradle test command.
Is the JVM returning the following out of memory error (OutOfMemoryError)?
org.gradle.api.internal.tasks.testing.TestSuiteExecutionException:
Could not complete execution for Gradle Test

[DEBUG] [TestEventLogger] java.lang.OutOfMemoryError: Java heap space
YES ![]()
By default, the Gradle worker has a maxHeapSize of 512m, which has been exceeded by the test execution.
To solve this, you could try to increase JVM’s memory allocation for the worker/test to a higher value by setting it in the tests config maxHeapSize Gradle Test page.
NO ![]()
Raise a Support Ticket and share the Pipeline build URL from bitbucket.org
Scenario 6: Pipeline build failed with "Step exceeded processing limits and has timed out" error
Scenario 6.1: Generic scenario
Possible causes:
The maximum length of all combined pipeline variables' names and values has been exceeded, the current limit is 120k.
Troubleshooting Steps:
Get the Repository, Workspace, and Deployment Variables and their values. Combine all the variable names and values together and verify the concatenated data length. Is the combined size of variable names and values more than 120k characters combined?
YES ![]()
Currently, when a build has multiple variables configured (including Repository, Workspace, and Deployment Variables) and has more than a total of 120k characters combined, it could cause the pipeline build to be in a stalled state or fail with the above error message.
To fix the issue, reduce the size of the variables to keep them under a total of 120k characters combined.
Note, BCLOUD-20105 tracks a feature request to provide an informative error in the UI for such cases.
NO ![]()
Raise a Support Ticket and share the Pipeline build URL from bitbucket.org
Scenario 7: Artifacts related issues
Scenario 7.1: The pipeline step is unable to find artifacts generated in the previous step(s)
Possible causes:
Artifacts size are more than 1 GB after the compression
Troubleshooting Steps:
Check the size of the artifacts after compression from the Build teardown phase of the build step that generates the artifact. Is the artifacts size more than 1 GB, similar to the screenshot below?

YES ![]()
Only artifacts under 1GB once compressed are saved. This limitation is documented on Use artifacts in steps page. Reduce the artifact size to keep it under the limit.
NO ![]()
Raise a Support Ticket and share the Pipeline build URL from bitbucket.org
Scenario 7.2: The pipeline step is unable to find a specific file from artifacts generated in the previous step(s)
Possible causes:
Artifact files are not in the $BITBUCKET_CLONE_DIR directory
Troubleshooting Steps:
Run the ls -lR <directory> command in the Pipeline build step generating the artifact. Here the <directory> is the directory that is being saved as the Artifact. The command should be run after the artifact is generated.
Is the file present in the output of the command or under the $BITBUCKET_CLONE_DIR directory? Below is an example:
pipelines:
  default:
    - step:
        name: Build and test
        image: node:10.15.0
        script:
          - npm install
          - npm test
          - npm run build
          - ls -lR dist # identify all files inside dist directory
          - ls -lR reports # identify all files inside reports directory
        artifacts: # defining the artifacts to be passed to each future step.
          - dist/**
          - reports/*.txt
YES ![]()
Raise a Support Ticket and share the Pipeline build URL from bitbucket.org
NO ![]()
Artifacts files are relative to the BITBUCKET_CLONE_DIR and only the files in the BITBUCKET_CLONE_DIR directory can be configured as artifacts. Also, the files that are inside the directory configured as artifact directory will be saved. Make sure the artifact files are relative to the BITBUCKET_CLONE_DIR and all the files are inside the directory configured as the artifact directory.
Scenario 8: Pipeline build cache related issues
Scenario 8.1: Pipeline build is unable to find cache used in the previous builds
Possible causes:
Cache size is more than 1 GB after the compression
Troubleshooting Steps:
Check the size of the Cache after compression from the Build teardown phase of the build step that generates the cache. Is the cache size more than 1 GB similar to the screenshot below?
YES ![]()
Only caches under 1GB once compressed are saved. This limitation is documented on the Caches page. Reduce the cache size to keep it under the limit.
NO ![]()
Raise a Support Ticket and share the Pipeline build URL from bitbucket.org
Scenario 8.2: Docker image build is not using the Docker cache generated in the previous builds
Possible causes:
Change in the Dockerfile
Troubleshooting Steps:
Check if there was a change to the Dockerfile after the cache stopped working. Was there a change?
YES ![]()
Pipeline saves each image layer in the Docker cache. If the Dockerfile changes after the cache are saved, the signature of that intermediate layers will change and the existing saved Docker cache will not be utilized while building the image.
To fix the issue, delete the existing cache in Pipelines (Pipelines > Caches > Delete) and trigger the build to generate and save the new cache. This new cache can be usable in the subsequent builds while building the image.
NO ![]()
Raise a Support Ticket and share the Pipeline build URL from bitbucket.org
Scenario 9: Git Submodule not being cloned in the Pipeline build
Possible causes:
Submodule doesn’t clone automatically
Troubleshooting Steps:
Check if submodules are being explicitly cloned in the build. Are the submodules being explicitly cloned?
YES ![]()
Raise a Support Ticket and share the Pipeline build URL from bitbucket.org
NO ![]()
Pipelines will not automatically clone the submodule repository. You need to manually configure Pipelines to update the submodule like the below, with valid credentials (either SSH or HTTPS):
[...]
  script:
    #HTTPS
     - >-
       git config --file=.gitmodules submodule.Submod.url https://$USERNAME:$PASSWORD@bitbucket.org/team/repo.git
       && git submodule update --init
    #SSH
    - git config --file=.gitmodules submodule.Submod.url ssh://git@bitbucket.org/team/repo.git && git submodule update --init
Scenario 10: The build setup running longer than expected
Possible causes:
The repository or the image build size is too large
Troubleshooting Steps:
Try to clone the repository and pull the image locally and observe the time taken. Is the time taken similar to its taking on the Pipeline?
Command to pull the image: docker pull [OPTIONS] NAME[:TAG|@DIGEST]
Command to clone the repository:
Clone over HTTPS
$ git clone https://username@bitbucket.org/teamsinspace/documentation-tests.gitClone over SSH
$ git clone ssh://git@bitbucket.org:teamsinspace/documentation-tests.gitYES ![]()
The build setup time includes the repository clone and image pull duration among other things. Try the following.
Reduce the repository size using the steps on Reduce repository size page.
Use the lower depth level to clone the repository in the Pipeline as instructed on depth (Git only) section on Configure bitbucket-pipelines.yml page
Reduce the build image size using the guidelines on How to Reduce Docker Image Size page.
NO ![]()
Raise a Support Ticket and share the Pipeline build URL from bitbucket.org
Scenario 11: The build was not triggered for a particular commit
Possible causes:
- There is no definition on the bitbucket-pipelines.yml file that matches the branch that is receiving a Git push. It's also important to double-check the bitbucket-pipelines.yml file for spelling mistakes, as the branch name in the bitbucket-pipelines.yml file needs to match the name of the branch on the Bitbucket repository exactly for the build to be triggered.
The push has more than 5 references(branches, tags, bookmarks)
- The push contained multiple commits at once. Pipelines will only trigger builds for the HEAD of the current Git push, meaning that, if a user pushes there commits together, only the latest will trigger a build.
The webhook size (based on the commit size) is more than 256Kb. The commit message size can be checked from the Bitbucket UI.
Troubleshooting Steps:
Did the push have more than 5 references or was the webhook larger than 256Kb?
YES ![]()
Push has more than 5 references
Pipelines will not run a build if it has more than 5 references on the same push (branches, tags, bookmarks) as documented on the Limitations of Bitbucket Pipelines page.
If you want, you can manually run the build that did not automatically trigger by:
Running a pipeline manually from the Branches view
Running a pipeline manually from the Commits view
Running a pipeline manually from the Pipelines page section
For information on manually running pipelines, see: Pipeline triggers.
To prevent future builds from not triggering, reduce the number of references (branches, tags, bookmarks) in a single push.
Webhook size is larger than 256kb
If the commit message is too large and it is not supported by Bitbucket as mentioned on the Limitations of Bitbucket Pipelines page, the result can be a webhook that is larger than the 256Kb limit.
If you want, you can manually run the build that did not automatically trigger by:
Running a pipeline manually from the Branches view
Running a pipeline manually from the Commits view
Running a pipeline manually from the Pipelines page section
For information on manually running pipelines, see: Pipeline triggers.
To prevent future builds from not triggering, reduce the commit size.
NO ![]()
Raise a Support Ticket and share the commit that didn’t trigger the Pipeline build.
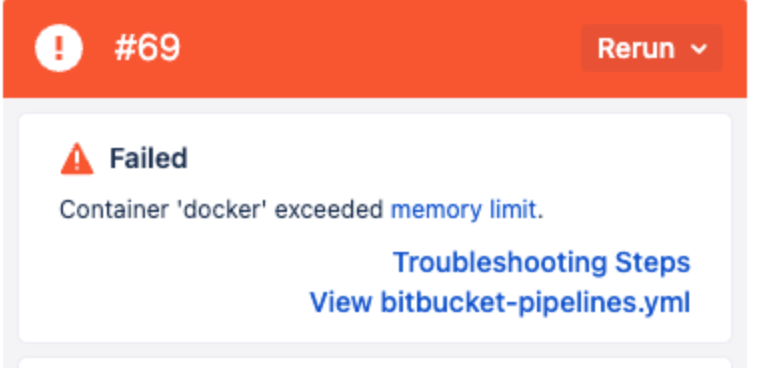
Scenario 12: Pipeline build failed with Container “Docker” exceeded memory limit error
Possible causes:
The docker service container in the Pipeline build requires more than the currently allocated memory.
Troubleshooting Steps:
Was the pipeline YAML already configured to allocate more than the default 1GB of memory to the docker service?
Please note that increasing the Pipeline build step size to 2x, 4x, or 8x (using the size attribute) will not automatically increase the memory allocated to the Docker service container. Docker service with size 2x, 4x, or 8x will still be allocated 1GB of memory by default, unless you configure and allocate more memory explicitly in the YAML file (an example is given below)
YES ![]()
- Raise a Support Ticket and share the Pipeline build URL from bitbucket.org
NO ![]()
A custom memory value can be configured to the docker service to increase it further than 1GB by adding the below definition in your YAML file :
definitions:
  services:
    docker:
      memory: 3072 # Memory in MB -  allocate 3GB (3072MB) of memory to docker service
Docker service can be configured to use up to:
3 GB (3072 MB) of memory in regular 1x steps.
7 GB (7168 MB) of memory in 2x steps.
- 15 GB (15360 MB) of memory in 4x steps.
- 31 GB (31744 MB) of memory in 8x steps.
- Pipes internally use the docker service. The memory-related issues with pipes can also be fixed by assigning more memory to the Docker service.
- It's also possible to configure multiple docker services with different memory limits if you have some specific requirements.
Scenario 13: Pipeline build failed with "unexpected system error that may have left your step half-completed"

Cause:
This is most commonly encountered with builds that utilise runners, the error message indicates that the Runner step container was evicted mid-build
Troubleshooting Steps:
When a step is evicted mid-build, the job retry process will try to restart it. Unfortunately, steps are idempotent - this means that Pipelines cannot retry things that were half completed automatically as it doesn't know where or how it failed, and requires user intervention to determine whether to retry.
You will need to re-run the build - does it complete this time?
YES ![]()
- Continue to monitor your builds in case it becomes a frequent occurrence, in which case you will need to:
1. Raise a Support Ticket
2. Share the Pipeline build URL from bitbucket.org
3. Attach any Pipelines Runner logs to the support ticket
NO ![]()
If the build is still not completing after re-running it, you will need to:
1. Raise a Support Ticket
2. Share the Pipeline build URL from bitbucket.org
3. Attach any Pipelines Runner logs to the support ticket