Faulting application name: elasticsearch-service-x64.exe, version: 1.0.15.0, time stamp: 0x51543b9d

Still need help?

The Atlassian Community is here for you.

Ask the community


Platform notice: Server and Data Center only. This article only applies to Atlassian products on the Server and Data Center platforms.

Support for Server* products ended on February 15th 2024. If you are running a Server product, you can visit the Atlassian Server end of support announcement to review your migration options.

*Except Fisheye and Crucible

This behaviour has been observed in Bitbucket Server 4.9.1 for Windows.

Problem

When stopping the ElasticSearch service in Windows the following error event happens in the Event Viewer > Windows Logs > Application :

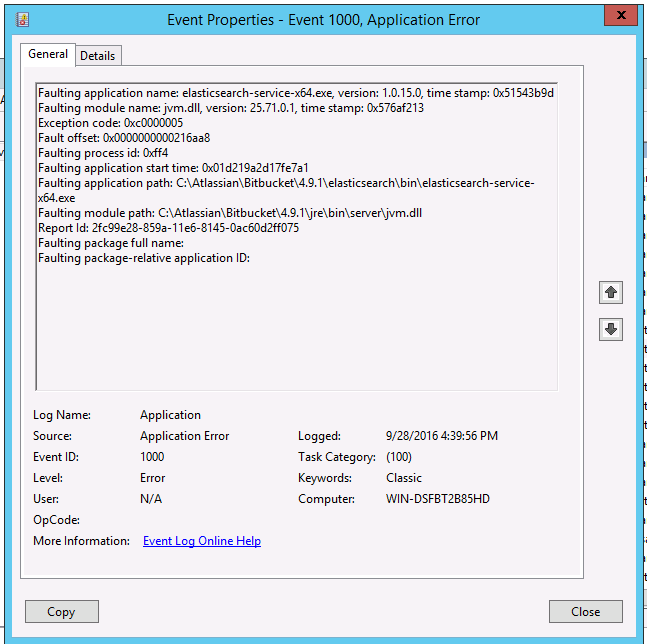
This is the message content:

Full log message
Log Name:      Application
Source:        Application Error
Date:          9/28/2016 4:39:56 PM
Event ID:      1000
Task Category: (100)
Level:         Error
Keywords:      Classic
User:          N/A
Computer:      WIN-DSFBT2B85HD
Description:
Faulting application name: elasticsearch-service-x64.exe, version: 1.0.15.0, time stamp: 0x51543b9d
Faulting module name: jvm.dll, version: 25.71.0.1, time stamp: 0x576af213
Exception code: 0xc0000005
Fault offset: 0x0000000000216aa8
Faulting process id: 0xff4
Faulting application start time: 0x01d219a2d17fe7a1
Faulting application path: C:\Atlassian\Bitbucket\4.9.1\elasticsearch\bin\elasticsearch-service-x64.exe
Faulting module path: C:\Atlassian\Bitbucket\4.9.1\jre\bin\server\jvm.dll
Report Id: 2fc99e28-859a-11e6-8145-0ac60d2ff075
Faulting package full name: 
Faulting package-relative application ID: 
Event Xml:
<Event xmlns="http://schemas.microsoft.com/win/2004/08/events/event">
  <System>
    <Provider Name="Application Error" />
    <EventID Qualifiers="0">1000</EventID>
    <Level>2</Level>
    <Task>100</Task>
    <Keywords>0x80000000000000</Keywords>
    <TimeCreated SystemTime="2016-09-28T16:39:56.000000000Z" />
    <EventRecordID>9189</EventRecordID>
    <Channel>Application</Channel>
    <Computer>WIN-DSFBT2B85HD</Computer>
    <Security />
  </System>
  <EventData>
    <Data>elasticsearch-service-x64.exe</Data>
    <Data>1.0.15.0</Data>
    <Data>51543b9d</Data>
    <Data>jvm.dll</Data>
    <Data>25.71.0.1</Data>
    <Data>576af213</Data>
    <Data>c0000005</Data>
    <Data>0000000000216aa8</Data>
    <Data>ff4</Data>
    <Data>01d219a2d17fe7a1</Data>
    <Data>C:\Atlassian\Bitbucket\4.9.1\elasticsearch\bin\elasticsearch-service-x64.exe</Data>
    <Data>C:\Atlassian\Bitbucket\4.9.1\jre\bin\server\jvm.dll</Data>
    <Data>2fc99e28-859a-11e6-8145-0ac60d2ff075</Data>
    <Data>
    </Data>
    <Data>
    </Data>
  </EventData>
</Event>


Diagnosis

Environment

  • OS: Windows (in the test happened on Windows Server 2012 R2)
  • Bitbucket server 4.9.1 installed using the installer and using all the default options.
  • Java verison 1.8.0_102-b14. The Java version used is the JRE bundled in Bitbucket but the same issue occurs with different java version downloaded from Oracle website and installed on the server.
  • The issue was seen for Elastic version 5.2.2 as per bug

Cause

The issue is caused by a probable bug in the Java Virtual Machine.

There is an existing bug for Elastic Search filed at https://github.com/elastic/elasticsearch/issues/15889 for this exact issue.

Workaround

There is no workaround available at the moment for this behaviour being something external from Bitbucket.

The search functionalities are not affected by this issue so the error is to be considered harmless.


Last modified on Sep 13, 2023

Was this helpful?

Yes
No
Provide feedback about this article
Powered by Confluence and Scroll Viewport.