Embedding Grafana Dashboard in Confluence Data Center
Platform Notice: Data Center - This article applies to Atlassian products on the Data Center platform.
Note that this knowledge base article was created for the Data Center version of the product. Data Center knowledge base articles for non-Data Center-specific features may also work for Server versions of the product, however they have not been tested. Support for Server* products ended on February 15th 2024. If you are running a Server product, you can visit the Atlassian Server end of support announcement to review your migration options.
*Except Fisheye and Crucible
Purpose
This article explains how to display/embed the Grafana Dashboard on a Confluence Page.
Environment
Confluence Data Center
Solution
- The Grafana Dashboards can be embedded into a Confluence page using an iFrame HTML element via Confluence HTML Macro.
- The iFrame HTML element is used to insert content from another source on a webpage and similarly, can be used to source data from Grafana to display dashboards in Confluence.
Prerequisite
For this integration to work, the Grafana application should be configured to support iFrames as some sites don't work in an iframe and have cross-scripting protection in their headers.
x-frame-options: SAMEORIGIN
x-xss-protection: 1; mode=block
If the above headers (or similar) are present in the response from the Grafana Dashboard URL, then you will not be able to display them in an iframe.
Steps
The below steps can be followed to add an iFrame element using the Confluence HTML Macro to display the Grafana Dashboard on a Confluence page :
- Log in as Confluence Administrator.
- Go to Manage Apps at > Manage Apps
- Search for "Confluence HTML Macros" with "All apps" selected in the dropdown
- Under "System apps", click on "Confluence HTML Macros" to expand the app details
- Expand the modules in the far-right column
- Enable the module called "html (html-xhtml)"
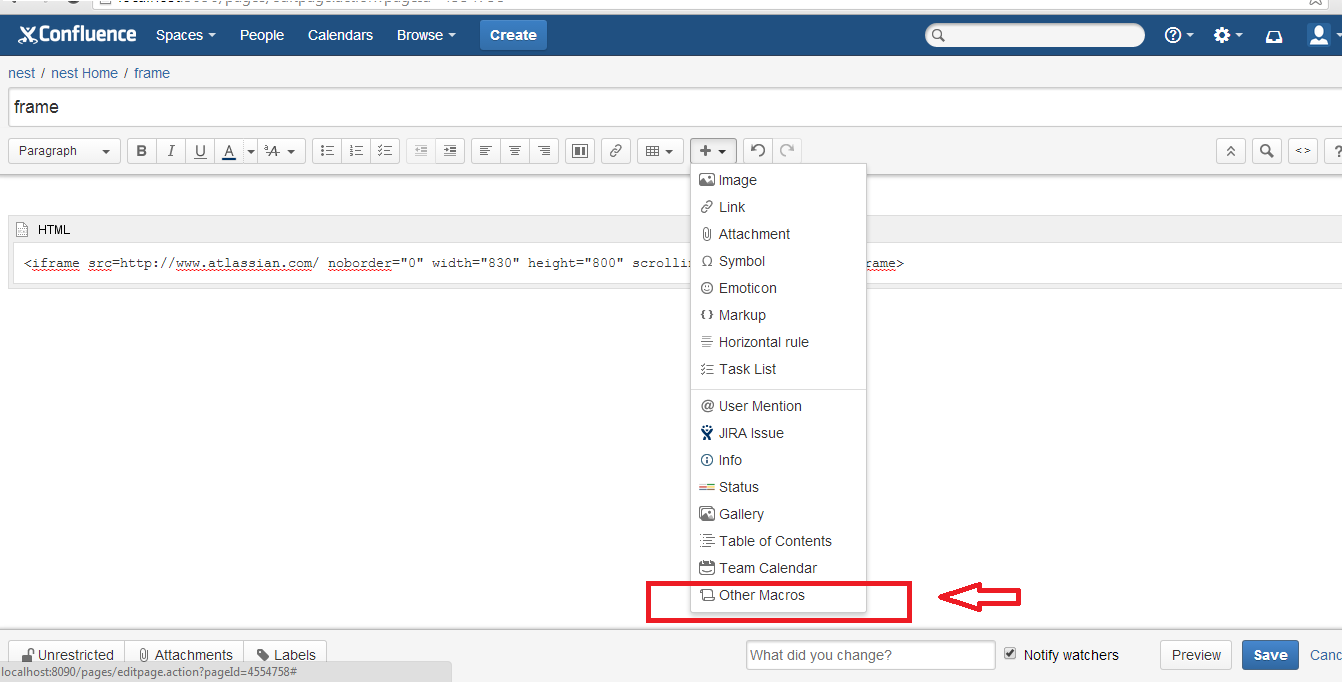
- The HTML macro is now available. When creating or editing a page, insert the "HTML" macro:
- Go to + (Insert more content) > Other macros
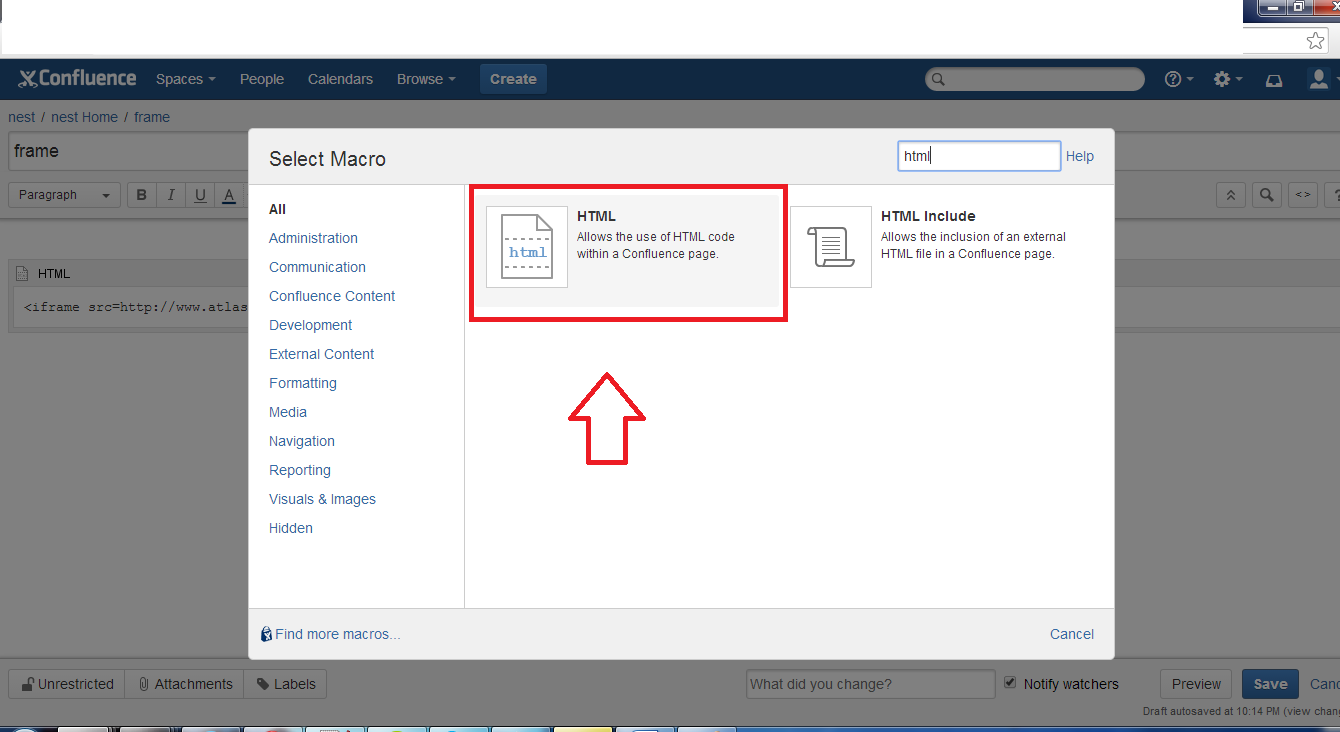
Search for the HTML macro
Paste the following code inside the macro, adding the URL of the Grafana Dashboard in src that needs to be dispalyed on the Confluence page. Modify the other parameters as required.
<iframe src="Grafana Dashboard URL" noborder="0" width="830" height="800" scrolling="yes" seamless></iframe>
- Go to + (Insert more content) > Other macros
- Save the page
Note - The Grafana Dashboards embedded on the Confluence page using an iFrame element will be refreshed every time the page refreshes during the page load.


