View performance insights for automation rules
Your automation performance insights provide an overview of your rules' performance by allowing you to view the execution count and duration.
Here’s an example view of performance insights with annotations:

Graph: Shows execution count for top 20 automation rules (listed below the graph) at a given point in time.
Execution data: Shows the execution count, total duration, and average duration for each of the listed rules.
Execution data vs. status: Shows a particular metric (execution count, total duration, average duration) against a specific status. For example, how many of all executions resulted in success.
Metrics: Change which metric is shown against the status.
Timeframe: Change the timeframe for all data, including the graph and the list below it.
View performance insights
To view insights for a single project:
Go to the rule list of the project you want to view insights for.
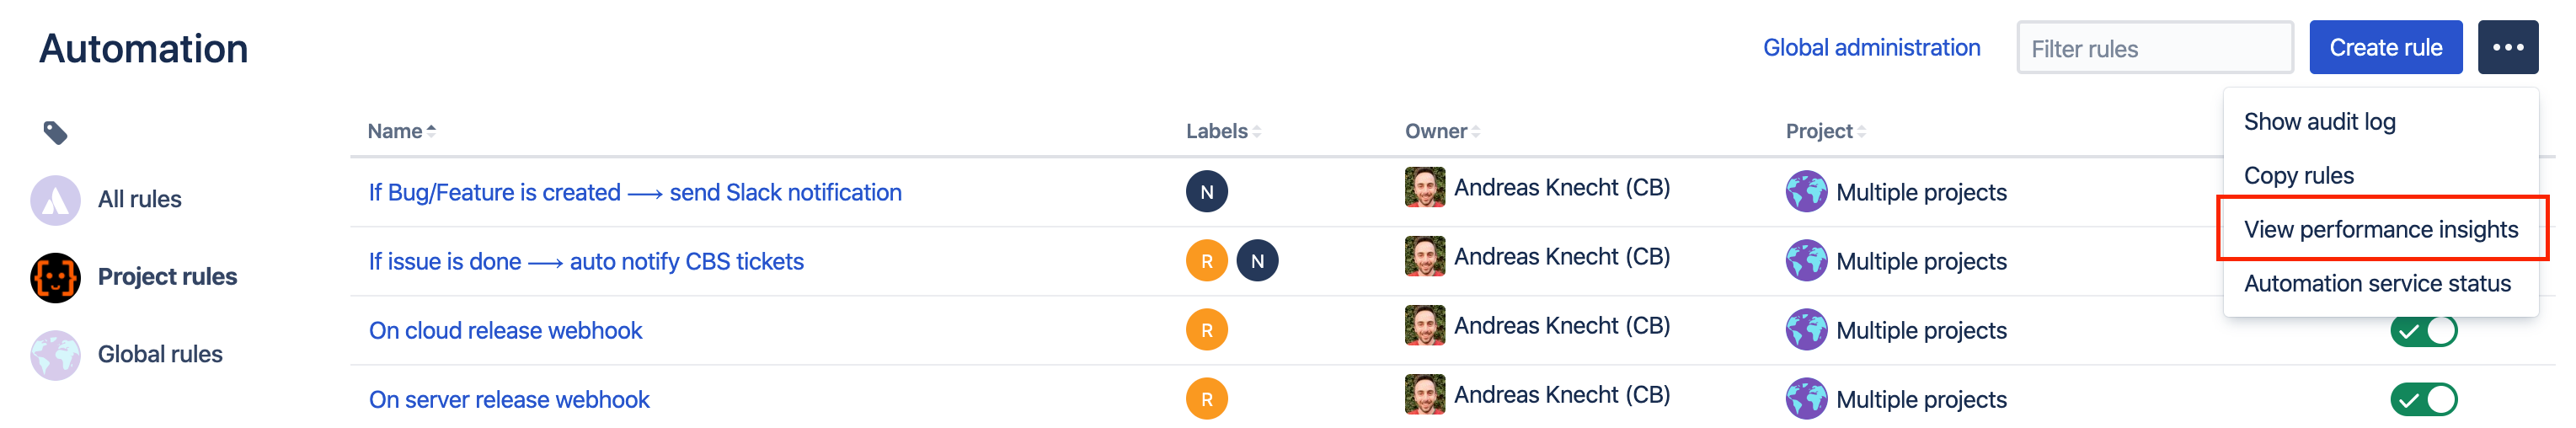
Select the more actions menu … > View performance insights.
To view insights for all projects:
Go to the automation space in your global administration settings.
Select the more actions menu … > View performance insights.

How to read performance insights
Here are some details on how to read performance insights.
Graph with execution count
The graph shows the execution count for top rules at a given point in time. It changes based on the timeframe you choose.
The colors show total executions, successful executions (regardless of whether actions were performed by a rule), or the ones that resulted in errors or were throttled.
The graph doesn’t show actions performed by your rules, it’s only the execution count and status.
List with automation rules
The list shows top 20 automation rules, based on the total execution count. You can select each rule to view its details in the audit log.

The table consist of two parts:
Execution data (left): Shows the execution count, the total and average duration for each of the listed rules in the chosen timeframe.
Execution data vs. status (right): Shows a specific metric (execution count, total, and average duration) vs. a status. You can change the metric by using the dropdown menu, for example, to view how many of all executions were successful or how much time a rule spent performing actions (success).
To understand how your rules are performing, you need to compare execution data to the metrics. For example, if the execution count is low, but the duration is high (with many actions performed), it might mean that your rule is too complex and is taking too long to complete.
Statuses
Here’s a description of the statuses you can see in the list:
| Status | Description |
|---|---|
SUCCESS | All actions within this execution were performed and ended in a success. |
NO ACTIONS | The rule executed, but no actions were performed. This is a normal behavior, because a rule starts with a trigger, but doesn’t perform any actions if the conditions aren’t met. That’s why it’s important to plan your rules. If the trigger is too broad, your rules will keep executing without performing actions, affecting performance. |
SOME ERRORS | The rule resulted in an error. Select the rule to view the details in the audit log. |
LOOP | The rule execution resulted in an execution loop. Select the rule to view the details in the audit log. |
THROTTLED | The rule breached a service limit. For more information, see Automation service limits. |
If you’re having problems with how your rules are performing, you can take some actions to improve your rules. For more information, see Troubleshoot automation rules.