Viewing the Clover code-coverage for a build
If your organization uses the Atlassian Clover code-coverage tool, Bamboo can record code-coverage details (i.e. the percentage of code covered by tests) for each build result.
This is only available if the build's plan specifies a Clover directory (for details please refer to the Enabling Clover for Bamboo).
Bamboo also provides data on code-coverage trends for a plan over a period of time. For details see the Related pages.
Clover HTML report for a job
Where Clover generates an HTML report (created by default in automatic integration), you can examine the report in the build job summary page. To view the report:
- Go to the plan summary.
- Select the relevant build number.
- Select the appropriate job.
- Select the Clover tab to open the report. If a job produces more than one report, a list is shown and you can switch between them.
The Clover tab is not available on the Build summary page - you must navigate to the Job summary. This is because your build may contain multiple jobs, each of which may have its own Clover report.
Clover statistics report for a job
If your build generates a Clover XML report but not the HTML report, then the Clover Report artifact is not available on the Artifacts tab, however the build job summary page will contain a few code coverage statistics:
- Go to the plan summary.
- Select the relevant build number.
- Select the appropriate job.
- Select the Clover tab to open the report.
TIP: This usually happens for manual Clover integration. In case you want to see full Clover report, configure it as described on Enabling Clover for Bamboo page.
References
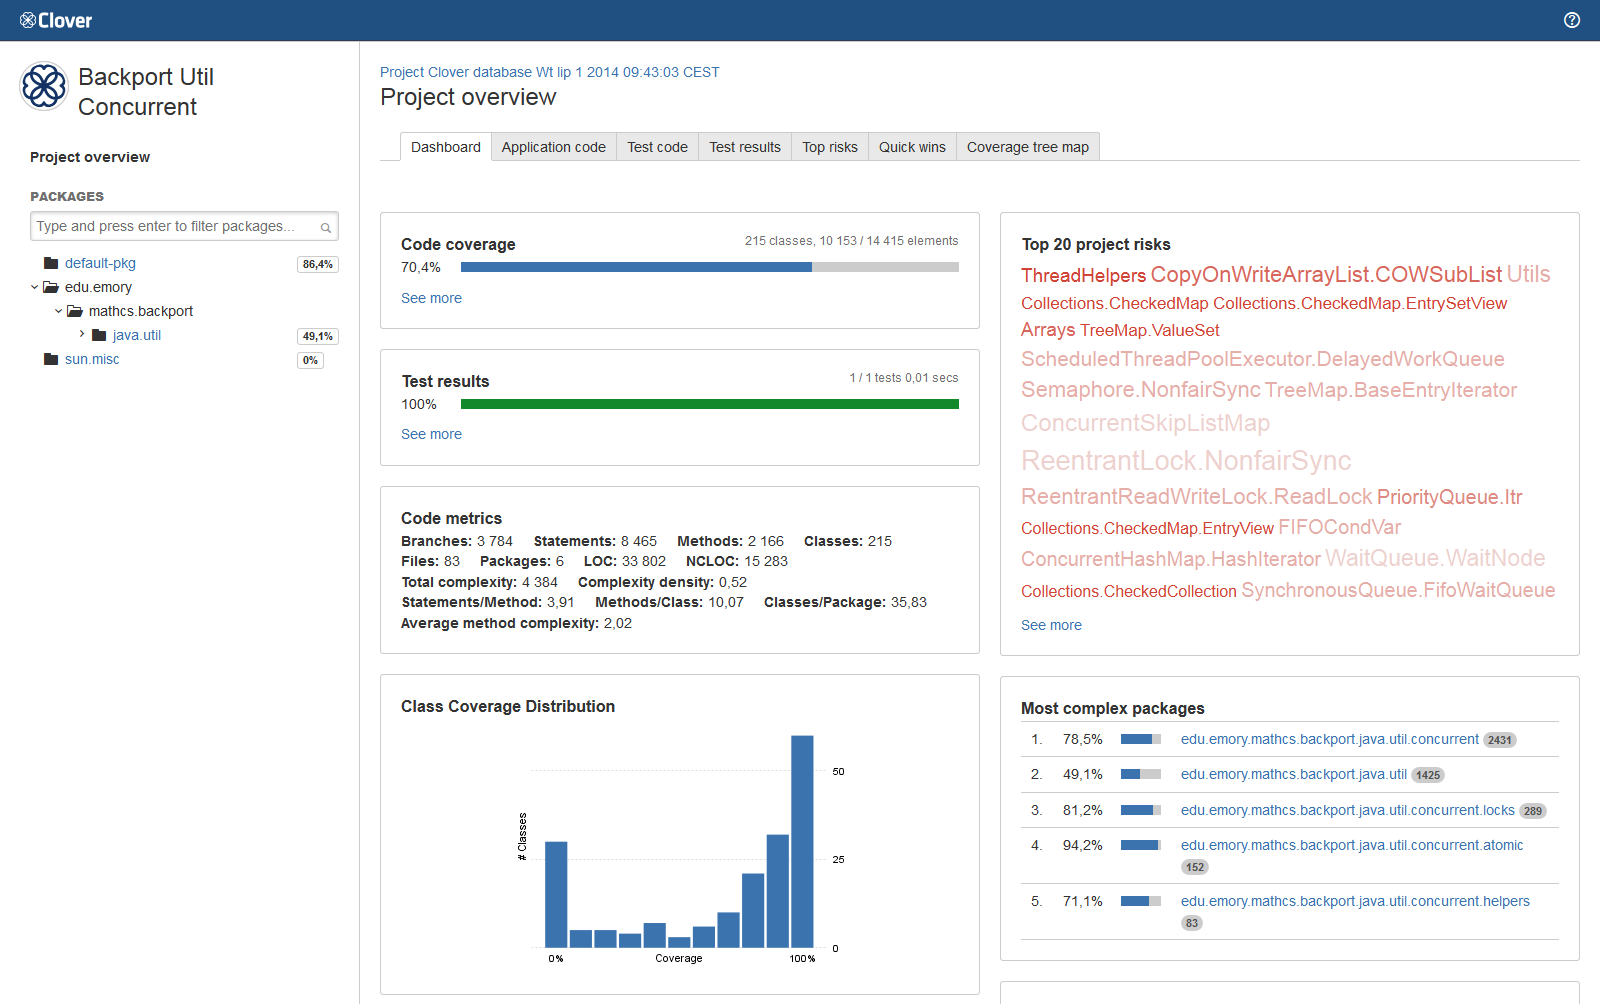
The content of the Clover HTML report is discussed in detail on the Clover Documentation Home - 4. Understanding Reports page. For completeness, an example Clover Code Coverage HTML report is shown below.
Troubleshooting
The Clover tab shows the directory listing instead of the HTML report
Please check which artifact handler you use. The Amazon S3 Artifact Handler serves files on a one-by-one basis, instead of exposing all files as a static website. To change this, open Configure plan and on the Other tab select the Use custom artifact handler settings checkbox. Then select Server-Local Artifact Handler for shared and non-shared artifacts, and finally re-run the build. See this bug report: CLOV-1560.
