Troubleshooting Slow Performance Using Page Request Profiling
This page tells you how to enable page-request profiling. With profiling turned on, you will see a record of the time it takes (in milliseconds) to complete each action made on any Confluence page. If Confluence is responding slowly, an internal timing trace of the slow page request can help to identify the cause of the delay.
You will need access to the Confluence server to view a profile.
Enabling Page-Request Profiling
To see just the slow performing macros, see Identifying Slow Performing Macros.
You need System Administrator global permissions to enable or disable profiling.
To enable or disable page profiling:
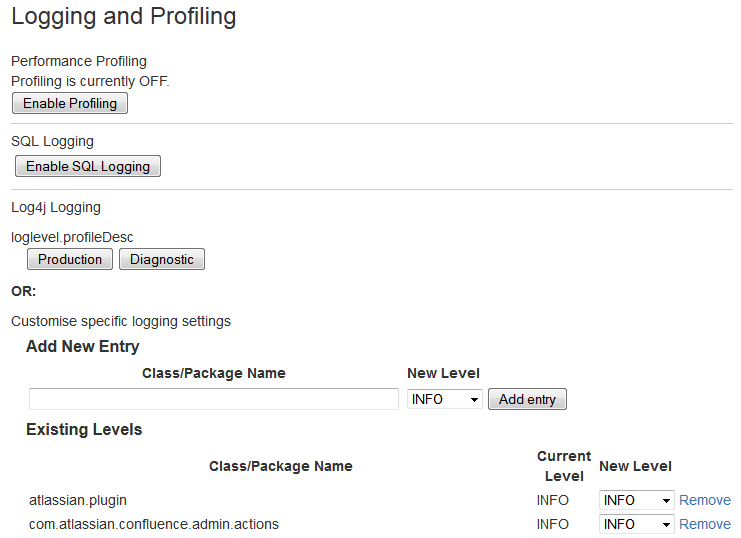
- Go to > General Configuration > Logging and Profiling.
- Choose Enable Profiling or Disable Profiling.
There is a known issue with the logging and profiling screen. See CONFSERVER-58861 - Getting issue details... STATUS
As a workaround you can enable profiling manually:
- Go to > General Configuration > Logging and Profiling
Under Add a new entry, paste the following into the Class/package name field
com.atlassian.util.profiling.Timers- Set the logging level to DEBUG.
- Choose Add Entry.
To disable profiling, find the com.atlassian.util.profiling.Timers entry in the list and choose Remove.
Screenshot: Changing Log Levels and Profiling
Profiling an Activity
- Enable profiling, using either of the methods described above.
Profiles for every page hit, for all users, will now be logged to your application server's default logs until Confluence is restarted. Note that each time a user visits a link, a single profile is printed. - Confirm that profiles are being written to the Confluence log file — see Working with Confluence Logs for location of the log files and other details.
- Perform the activity that is resulting in unusually slow response time.
- Copy the profile for that action. When deciding which profiles to copy, look for the links that took a long time to respond. If a single page is slow, only that profile is necessary. If Confluence is generally or intermittently slow, copy all profiles logged during the slowdown until a reasonable sample has been collected.
- If you were instructed to profile your instance by Atlassian technical support, attach all relevant profiles to your support ticket.
- Turn profiling off again, using either of the methods described above.
- Confirm that profiles are no longer being printed to the Confluence log file.
Example of a Profile
Below are the first few lines of a normal profile for accessing a page called Confluence Overview.
[344ms] - /display/ds/Confluence+Overview
  [313ms] - SiteMesh: parsePage: http://localhost:8080/display/ds/Confluence+Overview
    [313ms] - XW Interceptor: Before defaultStack: /pages/viewpage.action (ViewPageAction.execute())
      [0ms] - SpaceAwareInterceptor.intercept()
      [16ms] - PageAwareInterceptor.intercept()
        [0ms] - AOP: PageManager.getPage()
        [16ms] - AOP: PermissionManager.hasPermission()
          [0ms] - AOP: SpacePermissionManager.hasPermission()
          [16ms] - AOP: SpacePermissionManager.hasPermission()
        [0ms] - AOP: SpacePermissionManager.hasPermission()
      [0ms] - AOP: SpacePermissionManager.hasPermission()
      [281ms] - XW Interceptor: After defaultStack: /pages/viewpage.action (ViewPageAction.execute())
        [281ms] - XW Interceptor: After validatingStack: /pages/viewpage.action (ViewPageAction.execute())
           ...
Notice that each indented line is a recursive call that rolls up into the parent line. In the example above, the Confluence Overview page takes 344ms. Part of that, 313ms, is spent in sitemesh.
Start Confluence with Profiling Enabled
There may be some situations where you may wish to have Confluence profiling enabled during startup. This may be useful if you restart often and may forget to enable profiling for Support/Trouble-shooting purposes.
Edit the file CONFLUENCE_INSTALL\confluence\WEB-INF\web.xml. You should see a section similar to the one below. Set the parameter value for autostart to true:
     <filter>
        <filter-name>profiling</filter-name>
        <filter-class>com.atlassian.confluence.util.profiling.ConfluenceProfilingFilter</filter-class>
        <init-param>
            <!-- specify the which HTTP parameter to use to turn the filter on or off -->
            <!-- if not specified - defaults to "profile.filter" -->
            <param-name>activate.param</param-name>
            <param-value>profile</param-value>
        </init-param>
        <init-param>
            <!-- specify the whether to start the filter automatically -->
            <!-- if not specified - defaults to "true" -->
            <param-name>autostart</param-name>
            <param-value>true</param-value>
        </init-param>
    </filter>
Remember to turn it back to false or your logs will grow very large.
