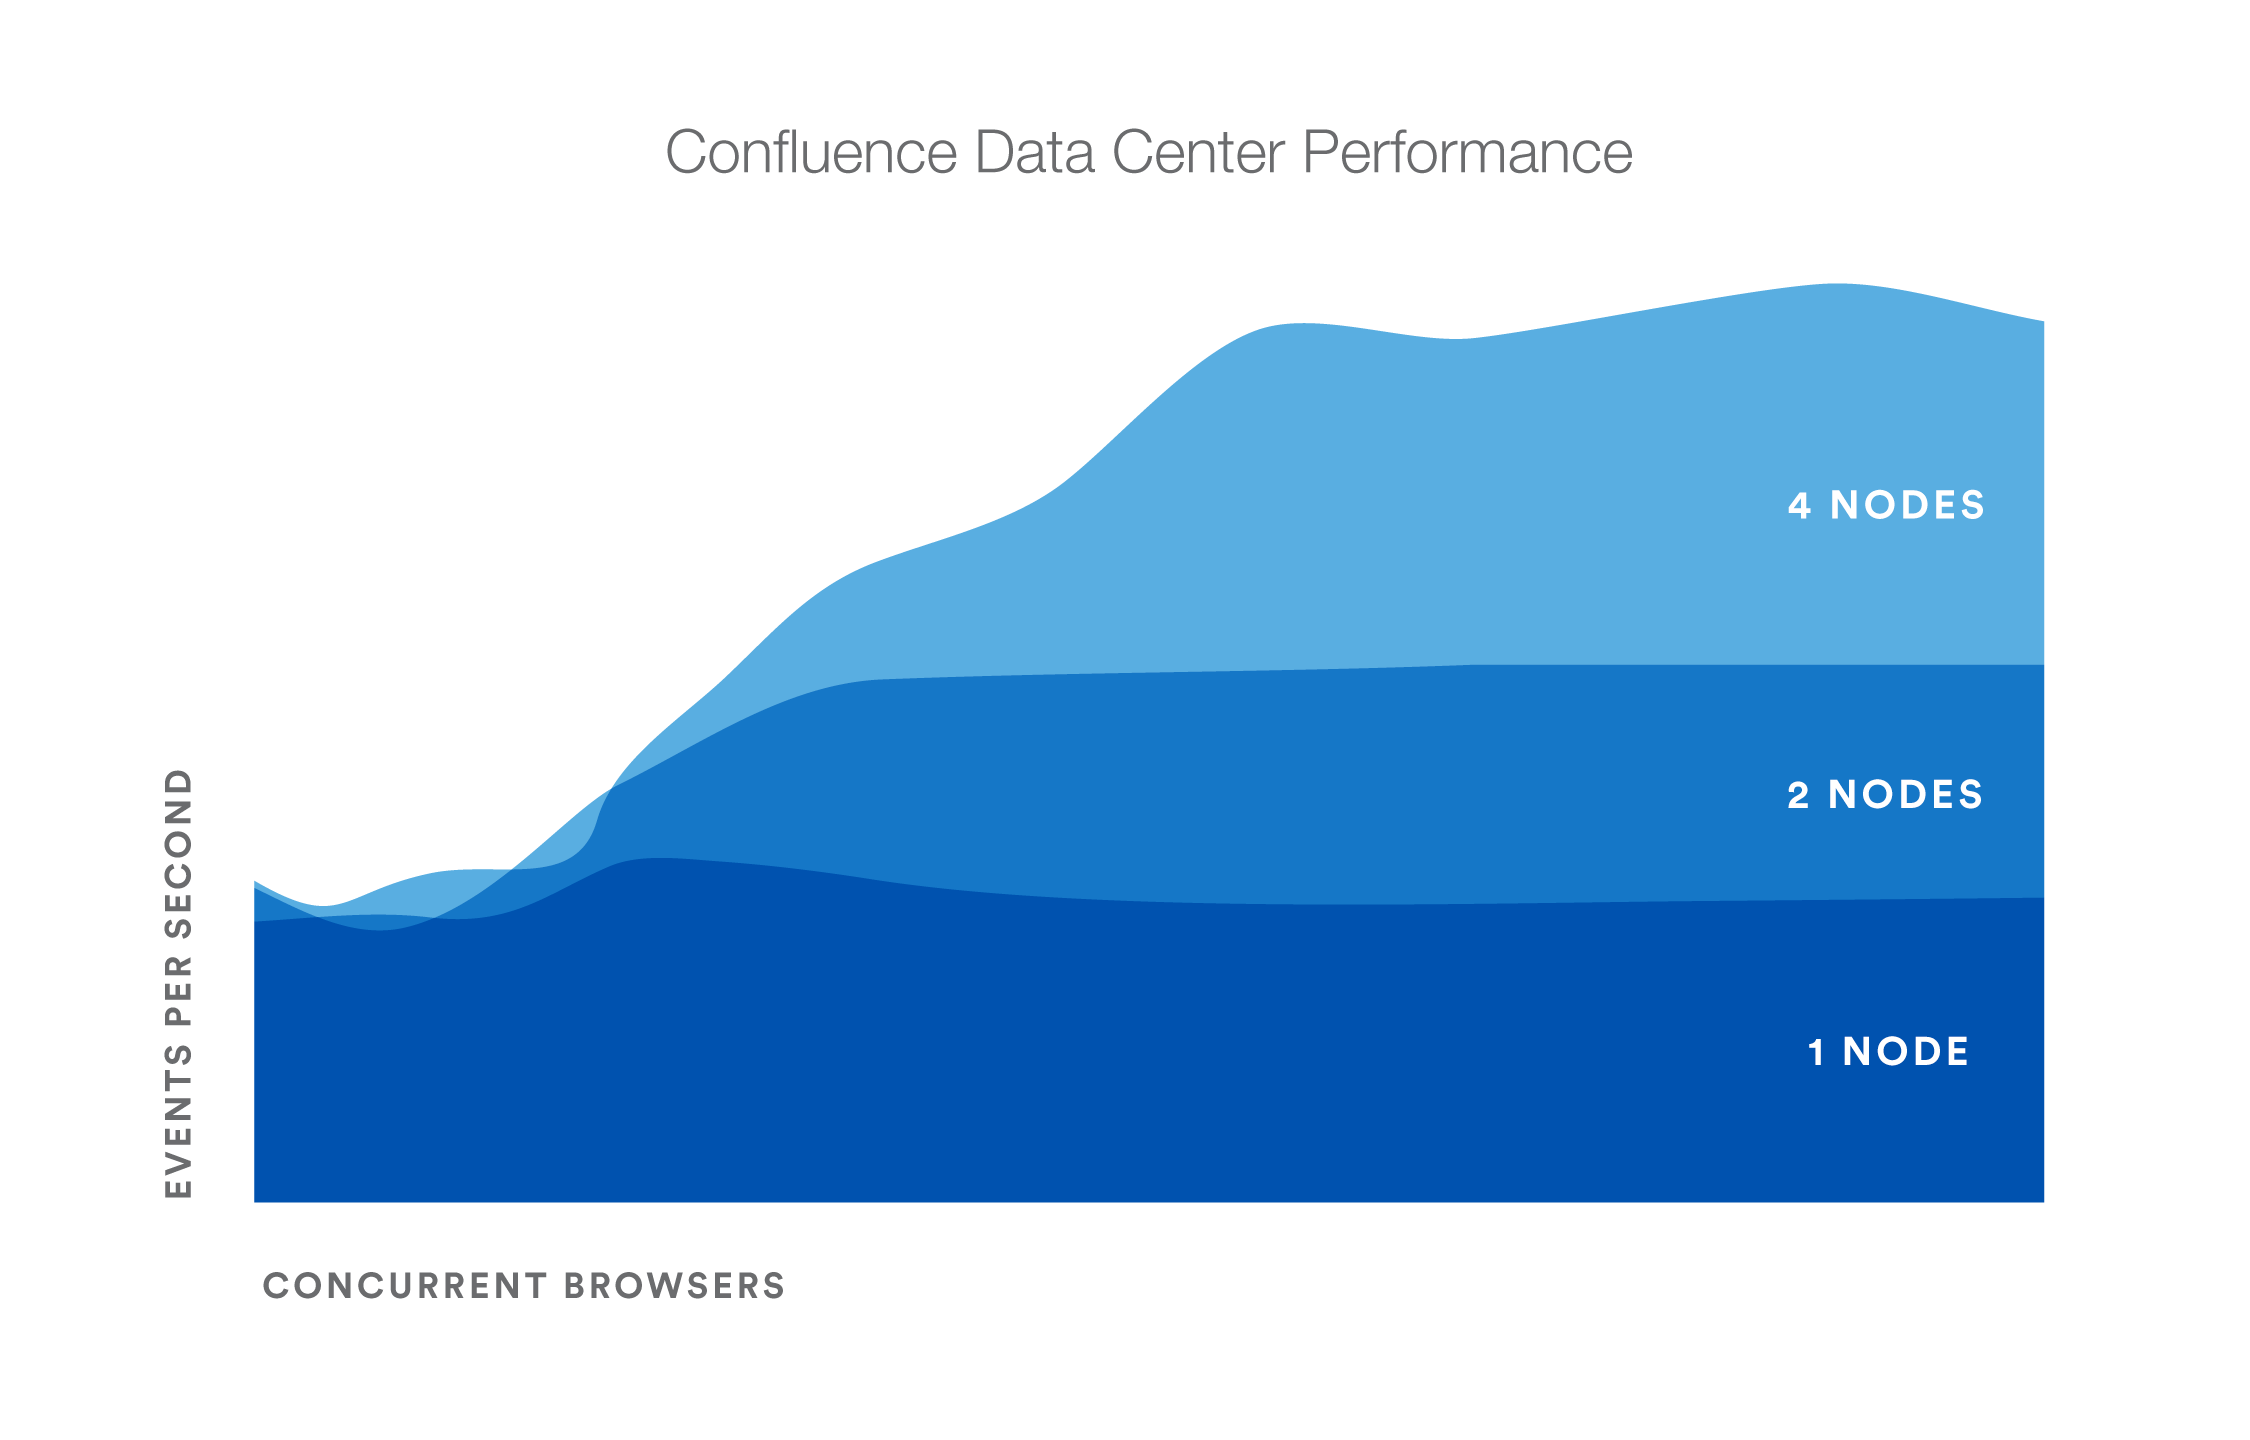
Confluence Data Center Performance
This document describes the performance tests we conducted on clustered Confluence Data Center within Atlassian, and the results of those tests. You can compare these data points to your own implementation to predict the type of results you might expect from implementing Confluence Data Center in a cluster in your own organization.
We started our performance tests by taking a fixed load profile (read/write ratio), then tested different cluster set ups against multiples of that load profile.
On this page
Testing results summary
Performance gains - Under a high load, clustered Confluence has improved performance overall.
Request responses don't diminish under increased load - Adding more nodes increases throughput, handles higher load and decreases response times.
You might observe a different trend/behavior based on your configuration and usage. For details, please see the What we tested section below.
Testing methodology and specifications
The following sections detail the testing environment and methodology we used in our performance tests.
How we tested
Our performance tests were all run on the same controlled isolated lab at Atlassian. For each test, the entire environment was reset and rebuilt. The testing environment included the following components and configuration:
- Apache proxy_balancer
- Postgres database and the required data
- G1GC garbage collector
- 8GB Xmx settings per node
- 6 CPUs per node
- Confluence Server on one machine or Confluence Data Center on two, or four machines as required for the specific test.
To run the test, we used a number of machines in the lab to generate load using scripted browsers and measuring the time taken to perform an action. An action here, means a complete user operation like creating a page or adding comment. Each browser was scripted to perform an action from a predefined list of actions and immediately move on the to next action (i.e. zero think time). Please note that this resulted in each browser performing more tasks than would be possible by a real user and you should not interpret the number of browsers to be equal to the number of real world users. Each test was run for 20 minutes, after which statistics were collected.
What we tested
- All tests used the same Postgres database containing the same number of spaces and pages.
- The mix of actions we included in the tests represented a sample of the most common user actions* representing six typical types of users (personas). The table below show the ratio of actions performed by each of these personas. These user-based actions were repeated until the test was completed.
Persona | Ratio of actions |
|---|---|
| PageReader | 7 |
| Searcher | 1 |
| Editor | 1 |
| Creator | 1 |
| Commenter | 1 |
| Liker | 1 |
Tests were performed with differing load sizes, from 4 up to 96 browsers. For larger load sets, profiles were scaled up, that is, doubling each amount for the 24 browser load, tripled for the 36 browser load.
* The tests did not include admin actions as these are assumed to be relatively infrequent.
Hardware
All performance tests were all run on the same controlled, isolated lab at Atlassian using the hardware listed below.
| Hardware | Description | How many? |
|---|---|---|
Rackform iServ R304.v3 | CPU: 2 x Intel Xeon E5-2430L, 2.0GHz (6-Core, HT, 15MB Cache, 60W) 32nm RAM: 48GB (6 x 8GB DDR3-1600 ECC Registered 2R DIMMs) Operating at 1600 MT/s Max NIC: Dual Intel 82574L Gigabit Ethernet Controllers - Integrated Controller: 8 Ports 3Gb/s SAS, 2 Ports 6Gb/s SATA, and 4 Ports 3Gb/s SATA via Intel C606 Chipset PCIe 3.0 x16: Intel X540-T2 10GbE Dual-Port Server Adapter (X540) 10GBASE-T Cat 6A - RJ45 Fixed Drive: 240GB Intel 520 Series MLC (6Gb/s) 2.5" SATA SSD Power Supply: 600W Power Supply with PFC - 80 PLUS Gold Certified | 20 |
| Arista DCS-7050T-36-R | 4PORT SFP+ REAR-TO-FRONT AIR 2XAC | 1 |
| HP ProCurve Switch | 1810-48G 48 Port 10/100/1000 ports Web Managed Switch | 1 |
Hardware testing notes:
- In order to quickly put more stress on the Confluence nodes with less load, cluster nodes were set to use only 4 cores out of 6 from each CPU, thereby reducing its processing power.
- For instances being tested, 6 GB of memory was allocated to the JVM consistently across all tests. This may not be optimized for all cases but allowed for consistency and comparability between the tests.
- During the tests we did not observe high CPU or IO load on either the database or load balancer servers.
- During the tests we did not observe running out of HTTP connections in the load balancer or connections to database.
- The browser and servers are in the same location so there was very low latency between client and server.
Comparison to Confluence Server response times
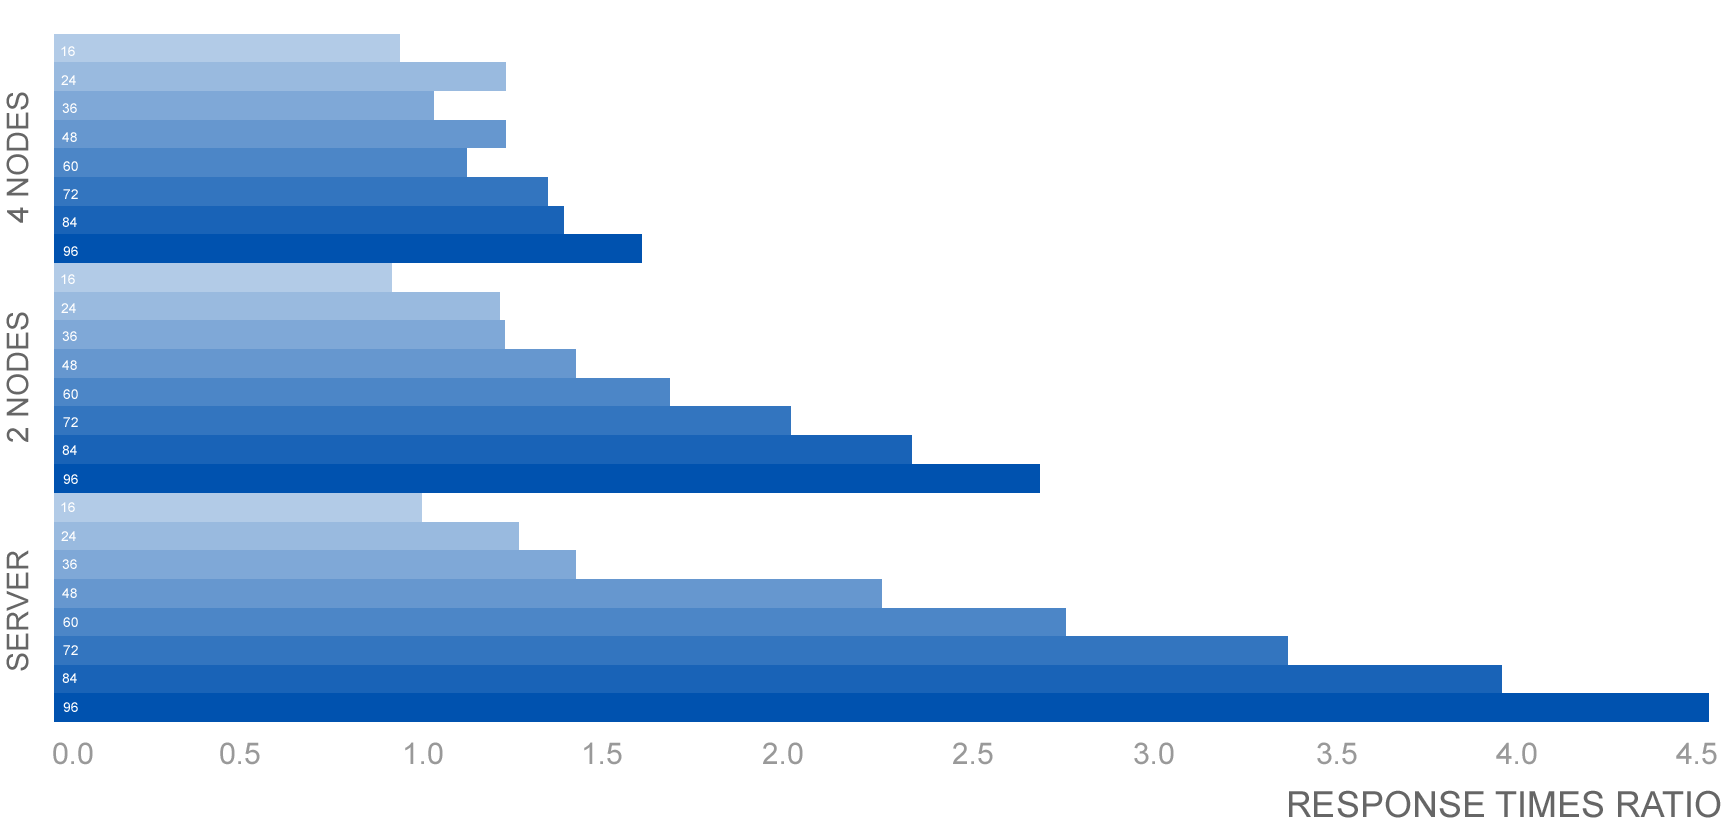
The following table shows the relative performance as the load increases for each Confluence instance configuration: Confluence Server (equivalent to single-node Confluence Data Center), two node Confluence Data Center, and four node Confluence Data Center. The table shows the response time relative to the baseline response time which we determined to be Confluence Server with sixteen browsers.
| Browsers | 16 | 24 | 36 | 48 | 60 | 72 | 84 | 96 |
|---|---|---|---|---|---|---|---|---|
| Server | 100.00% | 125.28% | 142.95% | 222.76% | 276.54% | 334.79% | 393.03% | 451.28% |
| 2 Node | 93.79% | 122.61% | 123.50% | 141.98% | 168.47% | 201.97% | 235.47% | 268.97% |
| 4 Node | 94.24% | 122.22% | 103.94% | 123.47% | 114.76% | 134.61% | 138.90% | 160.95% |
Ready to get started?
Contact us to speak with an Atlassian or get going with Data Center straight away.
For a detailed overview of Confluence's clustering solution see Clustering with Confluence Data Center. For help with installation, take a look at Installing Confluence Data Center.

