Configuring dashboards
About the default dashboard
The gadgets on the default dashboard can be reordered and switched between the left and right columns. Additional gadgets can also be added, while some gadgets can be configured. The layout of the dashboard (e.g. number of columns) can also be configured.
All changes made to the default dashboard will also change the dashboards of all users currently using the default dashboard. However, gadgets that users do not have permissions to see will not be displayed to them. For example, the 'Administration' gadget, although it may exist in the default dashboard configuration, will not be visible to non-admin users.
Creating a dashboard
You can easily create and customize your own dashboard to display the information you need. Note that only administrators can customize the default dashboard for your project.
- At the top right of the Dashboard, select More ().
- Select either Create Dashboard to create a blank dashboard, or Copy Dashboard to create a copy of the dashboard you are currently viewing.
- Name and describe your dashboard.
- Fill out the rest of the fields as applicable.
- Click Add.
By default, sharing is set to private if you have not specified a personal preference. You can adjust this setting in the sharing preferences in your user profile, and change dashboard permissions at any time in the Manage Dashboards page.
Choosing a dashboard layout
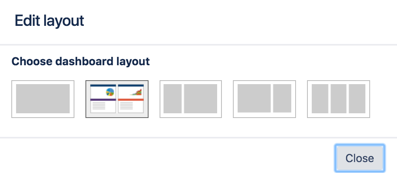
To choose a different layout for your dashboard page (for example, three columns instead of two):
- At the top right of the Dashboard, click Edit layout. A selection of layouts will be displayed:
- Choose your preferred layout.
Managing gadgets
To get the most out of your dashboard, including adding, rearranging, removing, and configuring gadgets, see Adding and customizing gadgets.
Managing dashboards and permissions
You can edit, delete, copy, mark favorites, and share your dashboards from the Manage Dashboards page.
- Select Dashboards > Manage Dashboards.
- Choose the dashboard.
Sharing and editing your dashboard
You can edit the details for your dashboard, and restrict or share with other users according to the permissions that are set. In addition, you can see all the dashboards you've created, any public dashboards, and any shared dashboards.
- Click Actions () > Edit. (If you're viewing the dashboard, go to More () > Edit/Share Dashboard).
- Edit the settings.
Adding favorite dashboards
If you find a dashboard you like, click the star icon next to its name to add it to your favorite dashboards list. You can also add the default dashboard to your favorites list so it's easily available to you.
Note on dashboard permissions
Jira administrators, as set in global permissions, can manage their users' shared dashboards in the Shared dashboards menu. Administrators can also change the ownership of a dashboard if the creator is unable to maintain the dashboard or its gadgets. See Managing shared dashboards for more information.
Setting up a Wallboard
Turn any Jira application dashboard into a wallboard by plugging your computer into a TV monitor. The Wallboard is a dashboard gadget that acts as an information radiator to provide instant visual insight into project progress and team accomplishments. With your favorite dashboard selected, select More () > View as Wallboard. The dashboard will appear against a black background, and will rotate gadgets if the user enables the slideshow option.
The Wallboard below shows the same Created vs. Resolved Issues gadgets and data above.


