Use jProfiler to analyse Jira application performance
The content on this page relates to platforms which are not supported for JIRA Applications. Consequently, Atlassian cannot guarantee providing any support for it. Please be aware that this material is provided for your information only and using it is done so at your own risk.
Overview
JIRA applications can experience performance problems from time-to-time, and debugging them can be a fairly complicated task. One of the ways of diagnosing what is taking time for the application to respond is by attaching a profiler to it to give an exact breakdown of the time taken up by each Java Method. This can be done by using a third-party application, jProfiler and will assist in indicating what may be causing performance problems.
Setup
- Download and install jProfiler.
 This is a third-party application, and as such is not supported by Atlassian - it is also a paid for product. Please see their Support section for assistance using it.
 - Run through the Start Center to setup the JIRA application instance so it can be connected to:

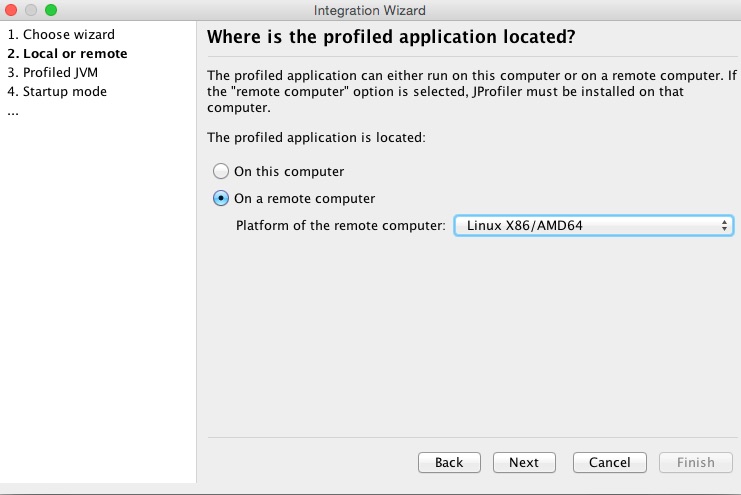
- Select 'New Remote Integration' (the instance is on a separate server to where jProfiler is installed) and follow the instructions in the wizard.
- Pick the correct version and architecture of the target operating system (OS):
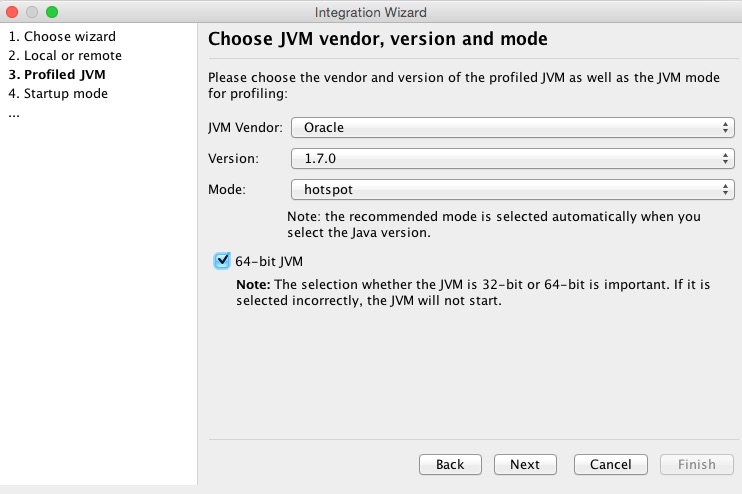
- Ensure the correct version of the JVM is selected:
- Select the 'Startup immediately, connect later with jProfiler GUI' option:

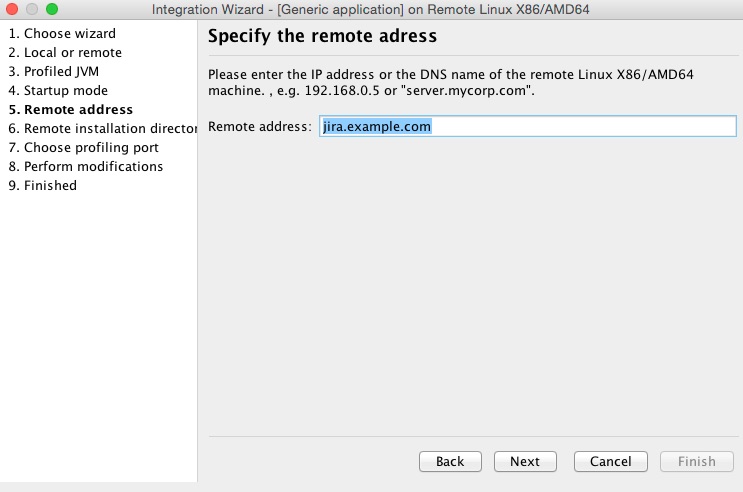
- Enter the Server FQDN (or hostname) of the JIRA application instance - in this example replace jira.example.com with whatever that is:
- Specify the location of the jProfiler agent on the target OS. This is required so jProfiler can bind to the target application. If this is the first time the profiling agent has been installed, select the 'Create archive' tickbox and specify a location on the OS where jProfiler is running (not the target OS).

- Confirm the download, if downloading the archive.
- Copy the archive file and unpack it in the 'Remote installation directory'. For example copy
/Users/captainplanet/Downloads/jprofiler_agent_linux-x64.tar.gzand untar it into/opt/jprofiler. - Select the port, ensuring that this is open between the OS jProfiler is running on and the target OS. If unsure check this with your System Administrator / Hosting Provider.
- Copy/paste the highlighted JVM arguments from the below page into the appropriate configuration as per Setting Properties and Options on Startup.

- Select 'Next' and 'No, I will start the session later.', then Finish.
- Restart JIRA application.
Attach
- Connect to the created session through 'Open Session' in the 'Start Center'.
- Select Sampling, as below:

- And then press OK, no other settings need to be done. There will be some minor transformations of classes, please wait for this to finish.

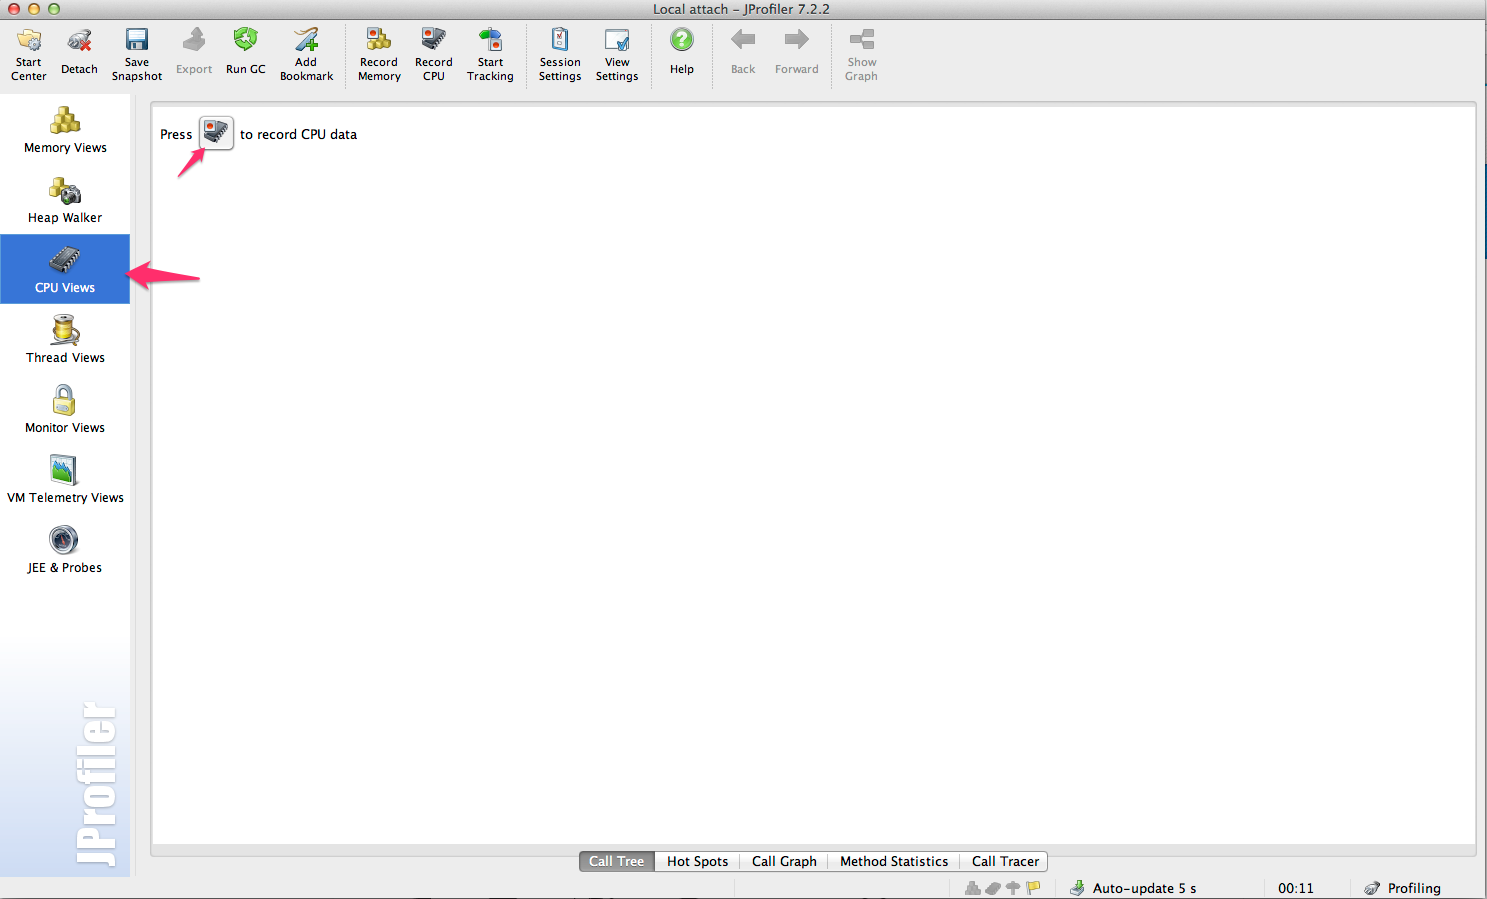
- jProfiler will now default to the Memory Views screen, which will give you an indication of which objects are using the most heap space. We'll need to start recording data, so go to CPU Views > Record CPU.
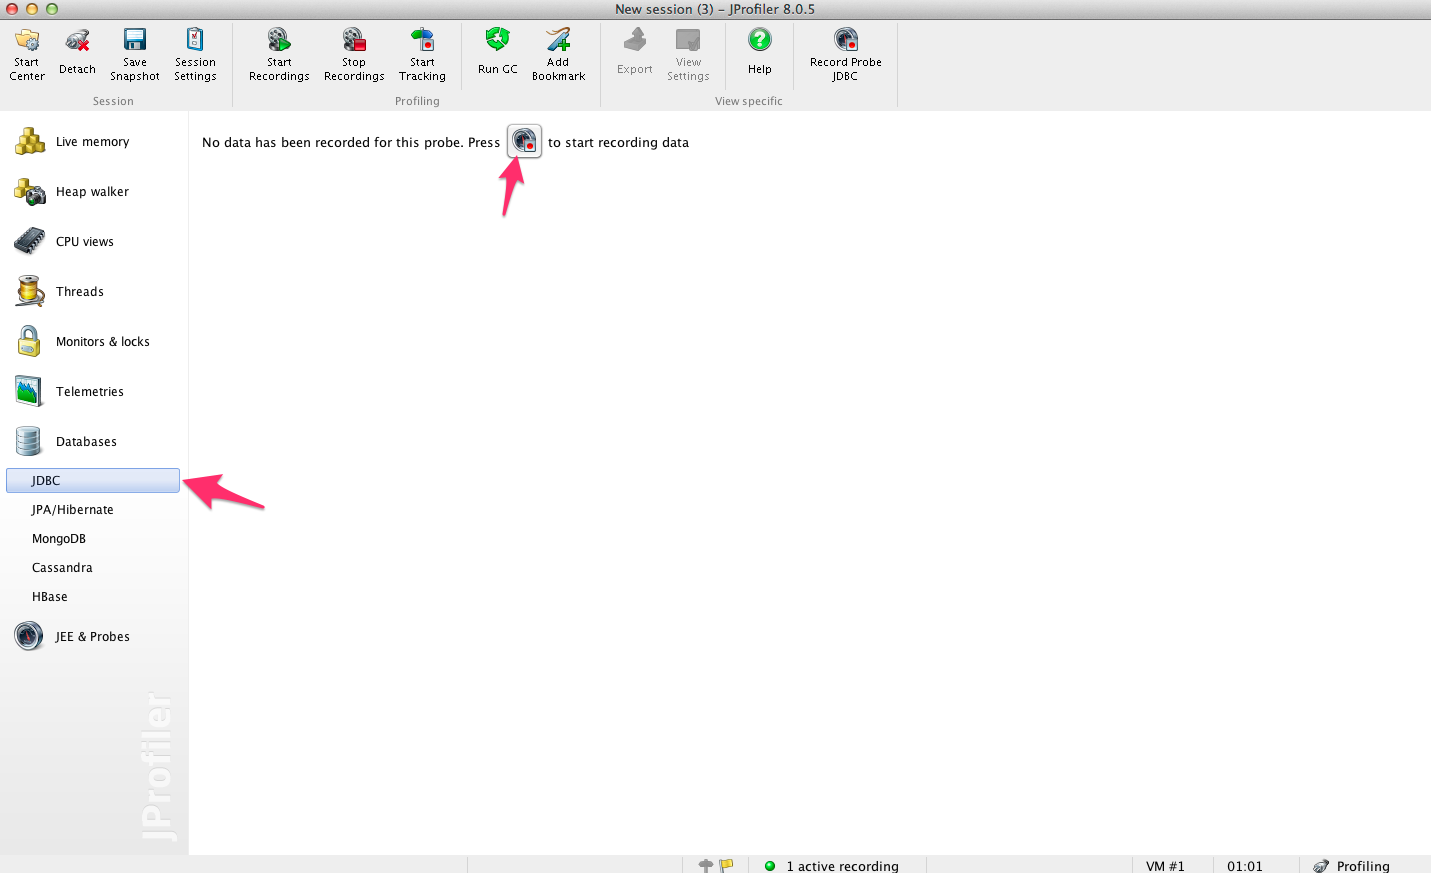
- Enable database monitoring - this will show us the time spent for each database query. Do this by doing to Databases > Record> Hotspots.
- (Optional): Monitors & Locks recordings can be enabled as per the below, this isn't always needed though. Done in Monitors & Locks > Locking History Graph > Record.

- Access the JIRA application page that is taking a long time to load and wait for the page to finish loading. This will provide a breakdown of the time taken for each method to load. Once the page that is slow to perform has finished loading, stop the CPU recording.
- Use the Save Snapshot functionality to save a copy of the profile as it may be needed later to provide to Support.
Analysis
CPU Views
- Change to the Hot Spots mode and expand the top method (this will be the method that's taking the longest), for example
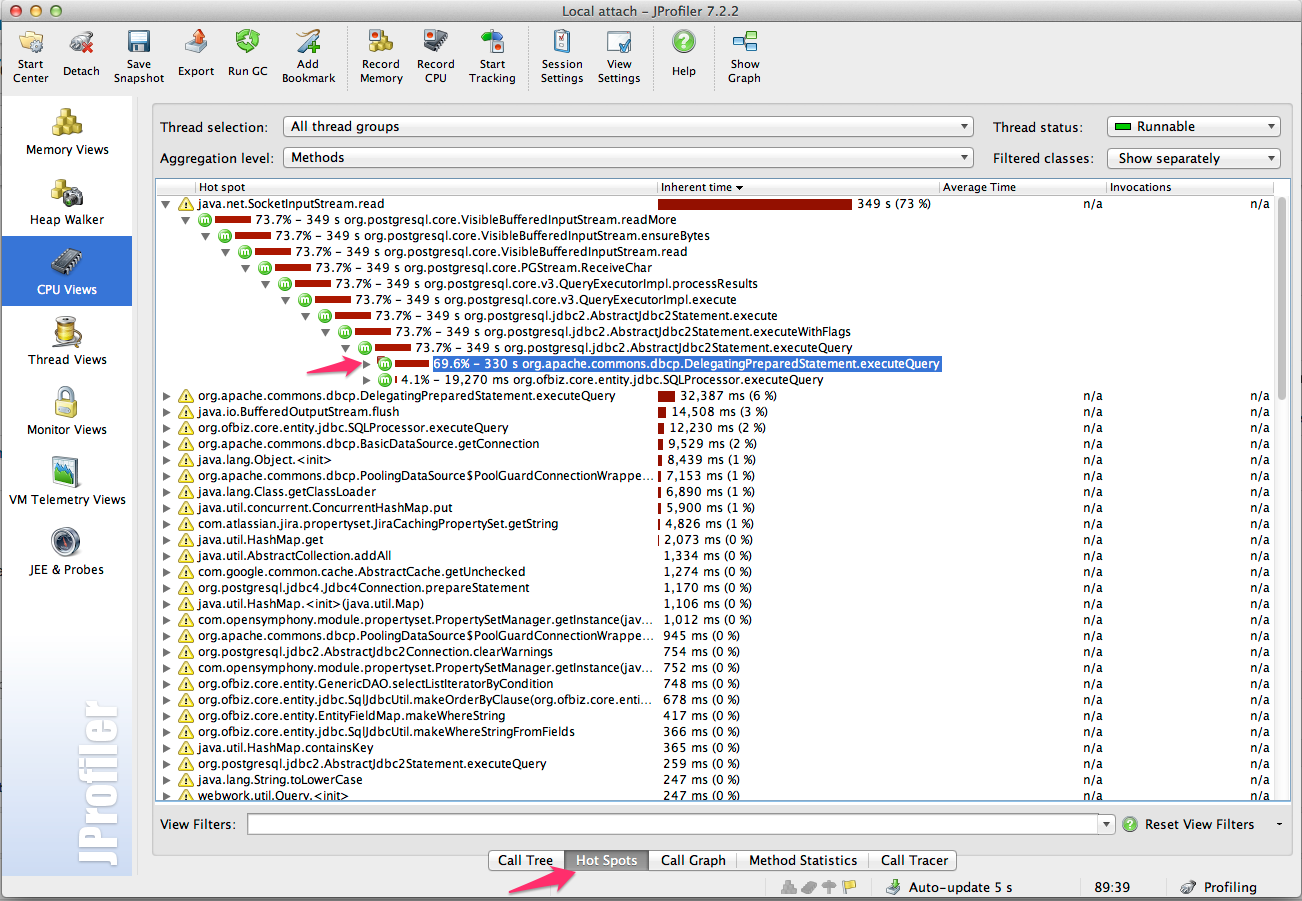
- Expanding the methods will provide a breakdown of what exactly is taking the longest for the JVM to respond (this is the virtual machine that powers JIRA).
- If jProfiler has been connected to an IDE (for example, IntelliJ), you can right-click on the method and Show Source:

Database Stats
Browse to Databases > JDBC > Hot Spots and review the SQL to see which queries are taking the longest. For example:

Providing Information to Support
Atlassian Support may request the output of a jProfiler session - this can be done by generating the breakdown and using the Save Snapshot functionality, as per the Discovery section of this documentation.