Setting up SLAs
When a project admin creates a new service project, we set up the following Service Level Agreements (SLAs) to help keep your team on track:
- Time to approve normal change
- Time to close after resolution
- Time to first response
- Time to resolution
Project admins can edit or delete these default SLAs, or create new SLAs. When you edit an existing SLA, the SLA for each related issue needs recalculation. SLA edits can take some time to take effect, and during this time, SLAs and reports may not be accurate. Learn what happens when you edit an existing SLA
On this page:
To create a new SLA:
- Navigate to Project settings > SLAs.
- Select + Create SLA.
- Set up the following:
Name, which identifies the SLA.
Who can view, choose who can view the SLA, only agents or customers too.
A time metric, which defines how and when time will be measured.
A goal, which defines the target to be met.
Jira admins can configure additional settings to manage permissions, time format display, and other SLA settings. Learn how to configure additional SLA settings
Choose a name for the SLA
Jira admins can restrict project admins from creating new SLA names.
When restricted, project admins can only select a name from the list of suggested names. To use a new name, they’ll need to contact the Jira admin.
The SLA name is visible to agents in the SLAs section of issues.
From the SLA name list, select an existing name or enter a new name. You can't change the name of the SLA once it’s created, so we recommend choosing a name that helps agents understand what they’re being measured on. For example, Time to resolution.
Choose who can view
You need a Data Center license to use this feature.
By default, SLAs are visible only to agents. You can choose to make SLAs visible to customers on the customer portal. Customers can see the status of an SLA and its time metric, but they can't see the goal itself. For example, within 5d. Learn how SLAs are formatted and displayed
To allow customers to view an SLA on the customer portal, in the Who can view this SLA section, select Yes.
Set a time metric
The time metric works like a stopwatch, tracking the time between two points in an issue's lifecycle. For example, you might start time when an issue is created, pause time while you wait for the customer to respond, and stop time when the issue is resolved.
In the Time metric section, set the following conditions for the time metric:
| Condition | How it works | Example |
|---|---|---|
| Start | Set the condition for when the SLA should start counting time. If you add multiple conditions, the SLA starts counting time when any of the conditions are met. | Issue: Created |
| Pause on | This condition is optional. Set the condition for when the SLA should pause counting time. If you add multiple conditions, time doesn't get counted against the SLA when at least one of the conditions apply to the issue. | Status: Waiting for Customer |
| Stop | Set the condition for when the SLA should stop measurements. If you add multiple conditions, the SLA stops counting time when any of the conditions are met. | Resolution: Set |
Here’s an example with multiple conditions set for the Time to resolution SLA. The SLA is reset to start a new cycle when the stop condition is met and one of the start conditions is detected again. Learn how SLAs with past cycles are displayed

Set up SLA goals
In the Goals section of the SLA metric, select the type of issue you want to track (Issues), target time for the issue to be resolved (Goal), and your team’s working hours (Calendar).
You can drag goals to set the order of importance. An issue is tracked against the first goal criteria it matches on the list.
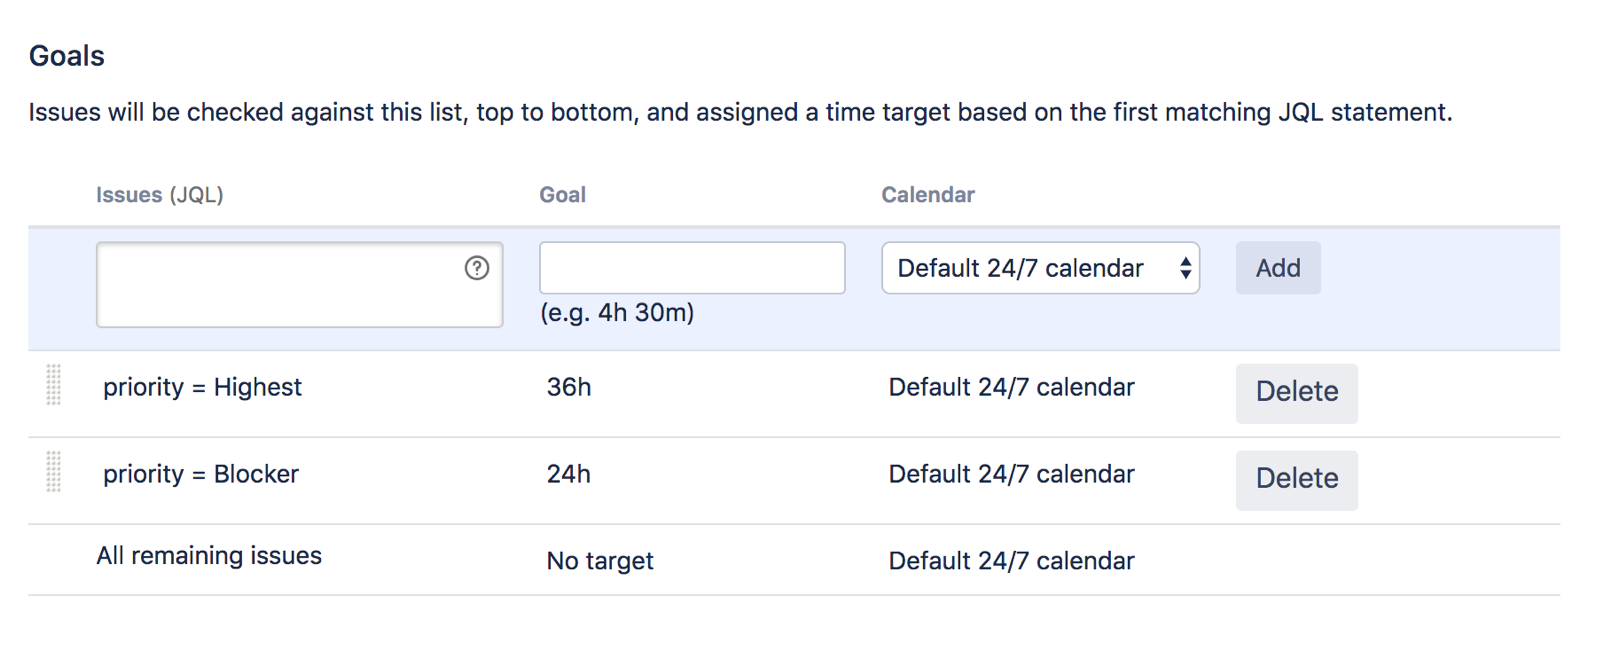
Here are some example goals:
- Resolve blocker issues within 24 hours.
- Resolve blocker issues created by the Build Engineering team within 12 hours.
- Resolve blocker issues created by the Accounting team within 36 hours.
Fill out the following fields to define a goal:
| Field | Description |
|---|---|
| Issues | Define what kind of issues should make up an SLA goal using Jira Query Language (JQL). Base goals on criteria that remain relatively constant throughout an issue's lifecycle (for example, an issue's priority rather than its workflow status). |
| Goal | Specify the target time for the SLA conditions you previously set. When specifying SLA goals that use a fraction of an hour, write the time as Xh Ym (for example, 3h 30m). You can write SLA goals as hours and minutes, but not days. |
| Calendar | Stop the clock when your team are away. Select a calendar from the list, or create a calendar to match the working hours of your team (including lunch breaks, holidays, and weekends) and assign it to the SLA. Learn how to create and edit SLA calendars SLA calendars are unique to each service project. See Example SLA configurations for an example of setting up an SLA that uses a 9-5 working day SLA calendar. |
What happens when you edit an SLA
When you change the configuration of an existing SLA, we follow these rules:
- We don’t recalculate, or touch in any way, cycles that have already been completed. A cycle is completed when a request fulfills the Start and Stop conditions (depending on your configuration and events, another cycle of the same SLA might then be started). However, if the configuration reopens an SLA that was completed (that is, if the stop conditions change), a new cycle gets started.
- We recalculate SLAs that are in progress so they measure against your new configuration and metrics.
And when you create a new SLA, we apply the new SLA to all relevant issues, both closed and open, based on the configuration of the new SLA.
It is possible that SLAs that are in progress may be completed or discarded entirely after changing the configuration. This can occur if you remove the previous Start or Stop conditions or change them to something else, which will trigger the completion. As previously mentioned, SLAs that are in progress will be recalculated to use your new configuration.
Best practices for using SLAs and troubleshooting
- Try to select an Assignee who's not the Reporter of an issue. If you assign the same user, your SLA might work incorrectly.
- If issue data changes in such a way that the goals for the issue change (for example, the priority changes from Critical to Blocker), the time against the previous goal will be tracked against the new goal, for open issues only.
For example, if the Support team spent an hour on a Critical issue, when the issue is escalated to Blocker, the hour still counts against the new goal, even if it causes the SLA to be breached. - If you're using filters in your service project to track SLA data, specifically priorities, make sure these filters include all the priorities defined in the associated priority scheme. See Associating priorities with projects for more details.
- We do not recommend setting up a goal to be dependent on a different SLA.
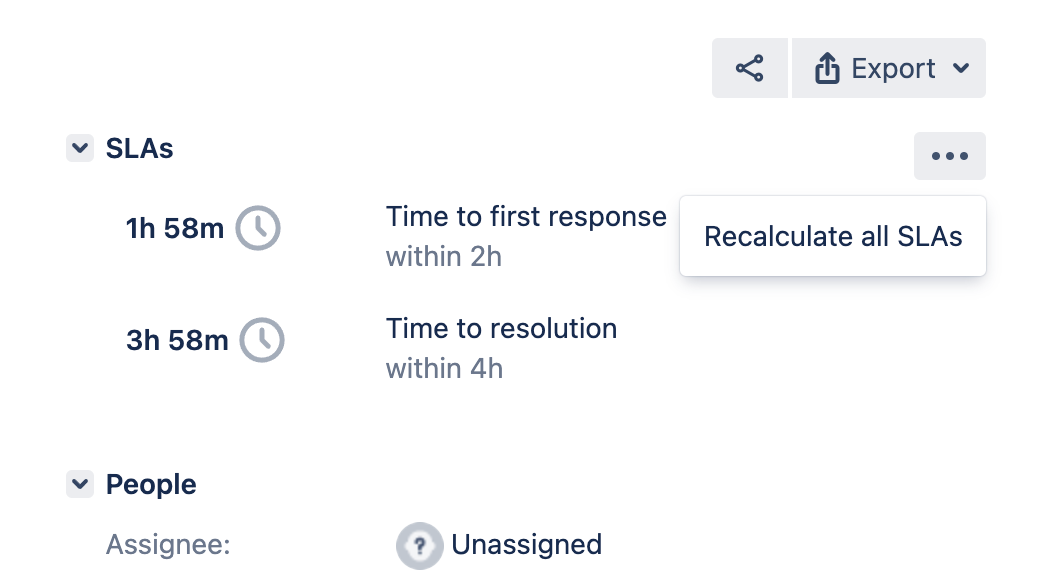
Recalculate SLAs for a single issue
Who can do this?
![]() Jira admins
Jira admins
Occasionally, issue events that should trigger a change to an SLA value are missed or interpreted incorrectly resulting in an incorrect SLA value showing in the queues or the issue view. Usually, SLA calculations will catch up to missed events and correct the values, but if they don’t, you can recalculate the SLAs for an issue.
To recalculate SLAs for an issue:
Navigate to the issue.
In the SLAs section, select More actions (…) > Recalculate all SLAs.
Select Recalculate.