Compare years using a Line chart
Let’s say you have the Jira issues that were created on a specific date. You’re interested in summarizing the total number of issues by month, but highlighting year-over-year trends. To do this:
Select an Atlassian Data Lake data source for your query.
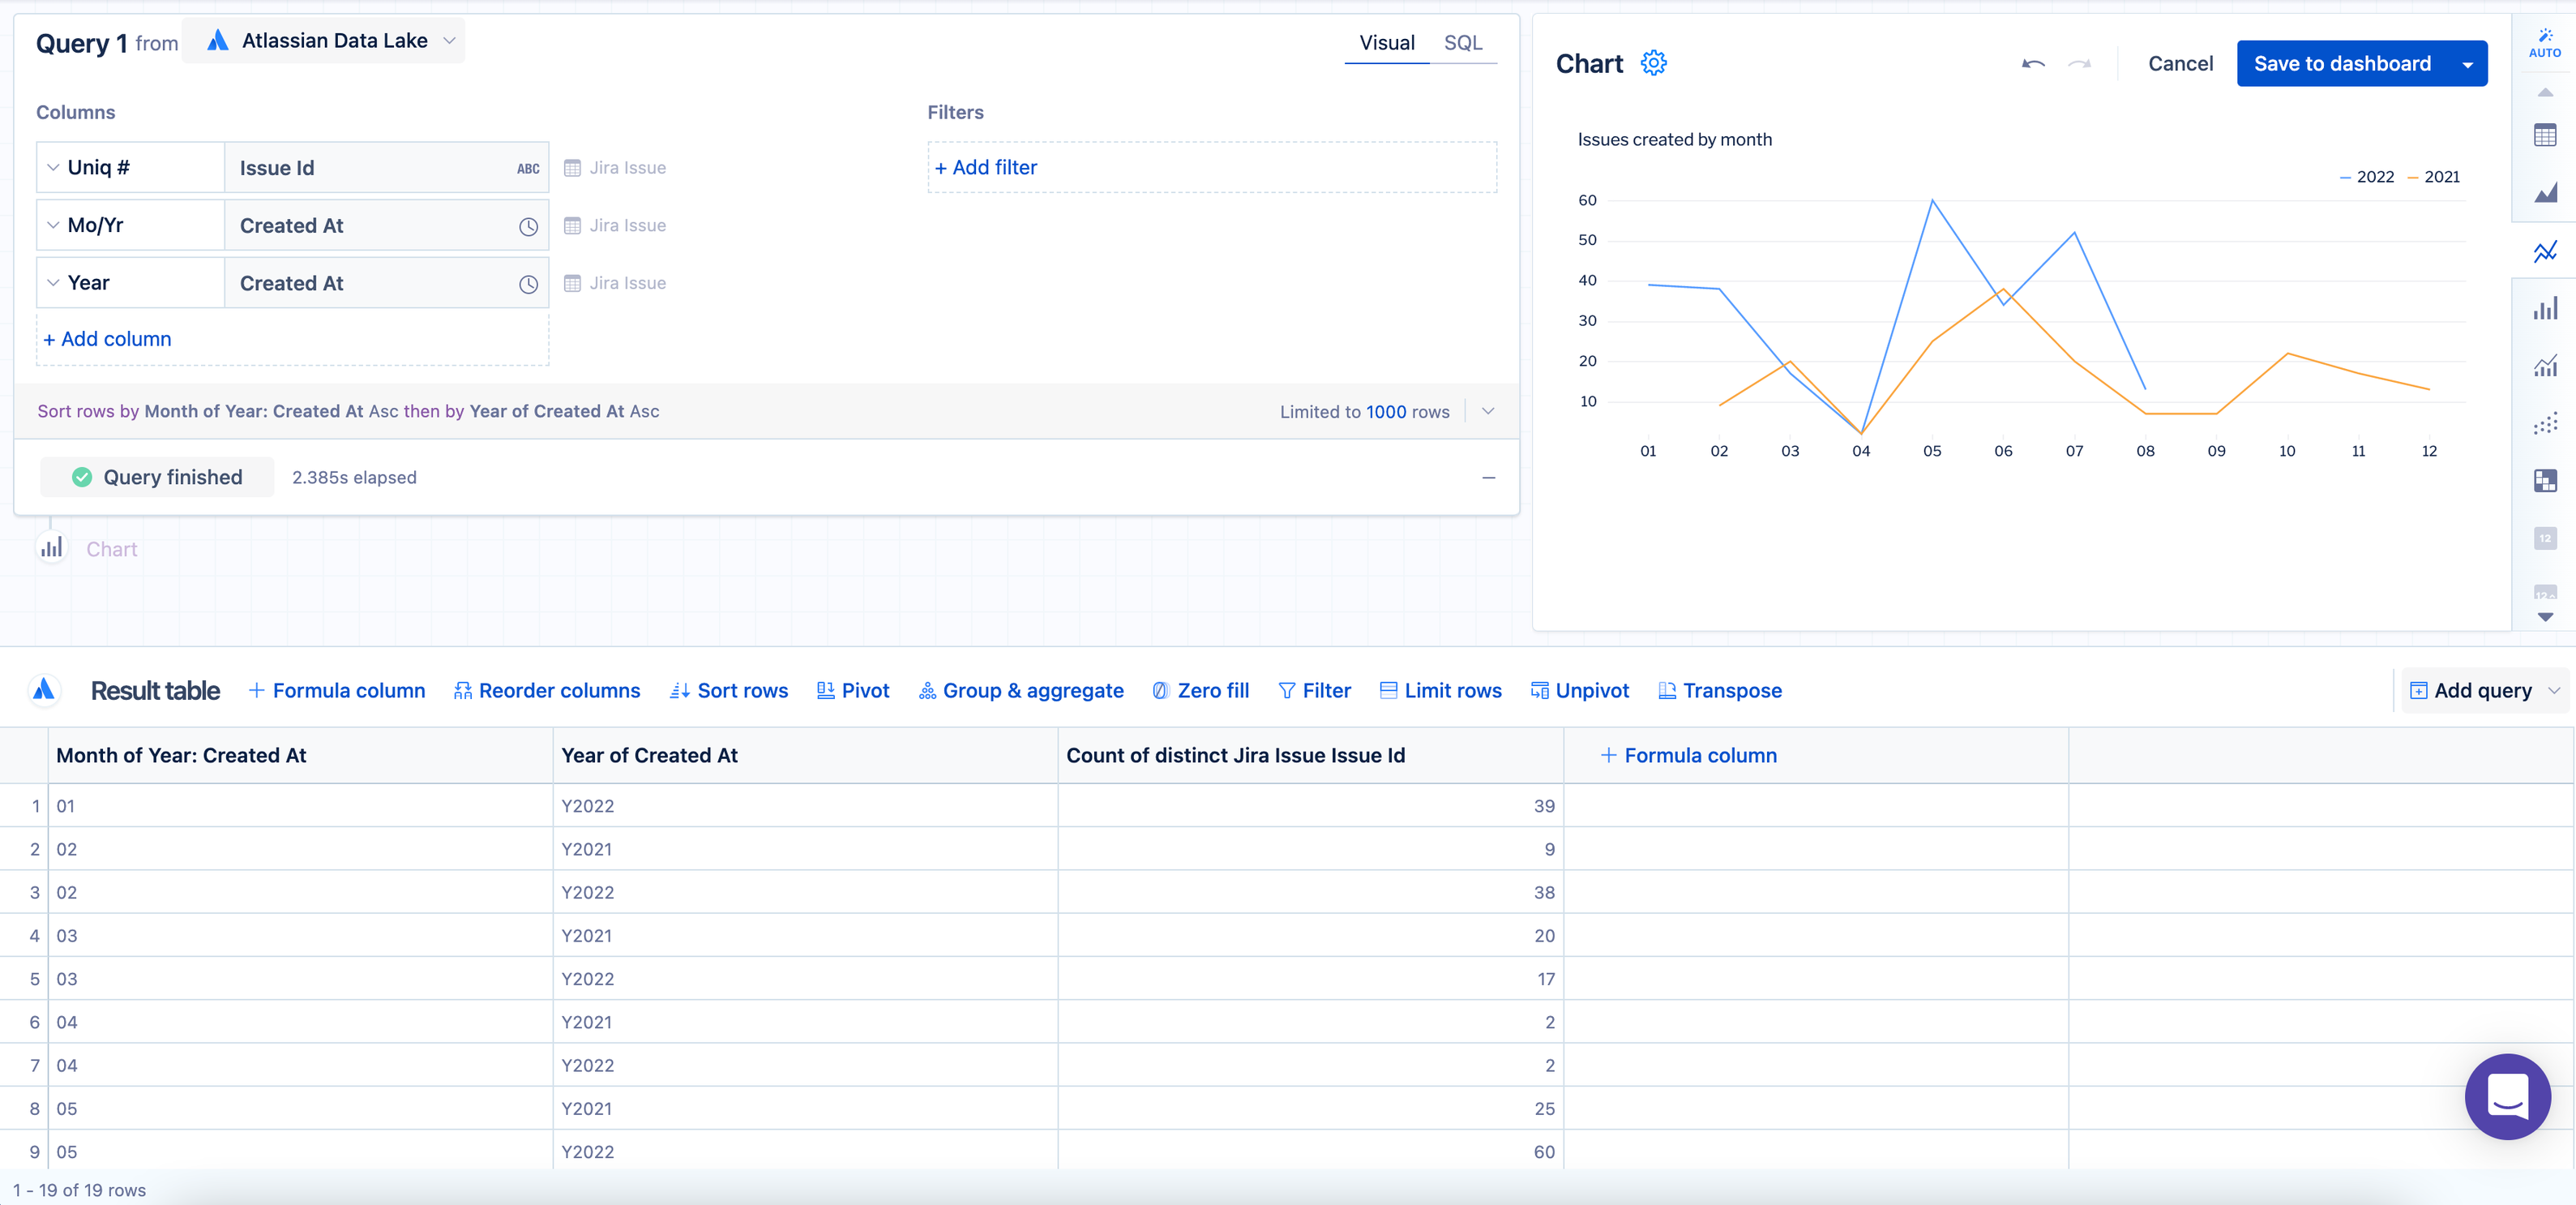
From the Jira issue table, add the Created at and Issue key columns.
Change the group/aggregation for these columns using their aggregation menus:
For the “Created at” column, change the time bucket to Month of year.
Note that the “Month of Year” time bucket is different from the “Month” time bucket.
For the “Issue key” column, use the Count of distinct aggregation to get the total number of unique issues.
Here’s where things get exciting! Add the Created at column to the “Columns” section of the query a second time, but this time, select the Year time bucket from the aggregation menu. The combination of all these columns will give the number of issues created by month and calendar year. Omitting the “Year of created at” column would result in a total of all issues created for a given month—for instance, January—regardless of the year.
Once you’ve added and modified the columns, run the query to get the preliminary results.An optional step is to add a
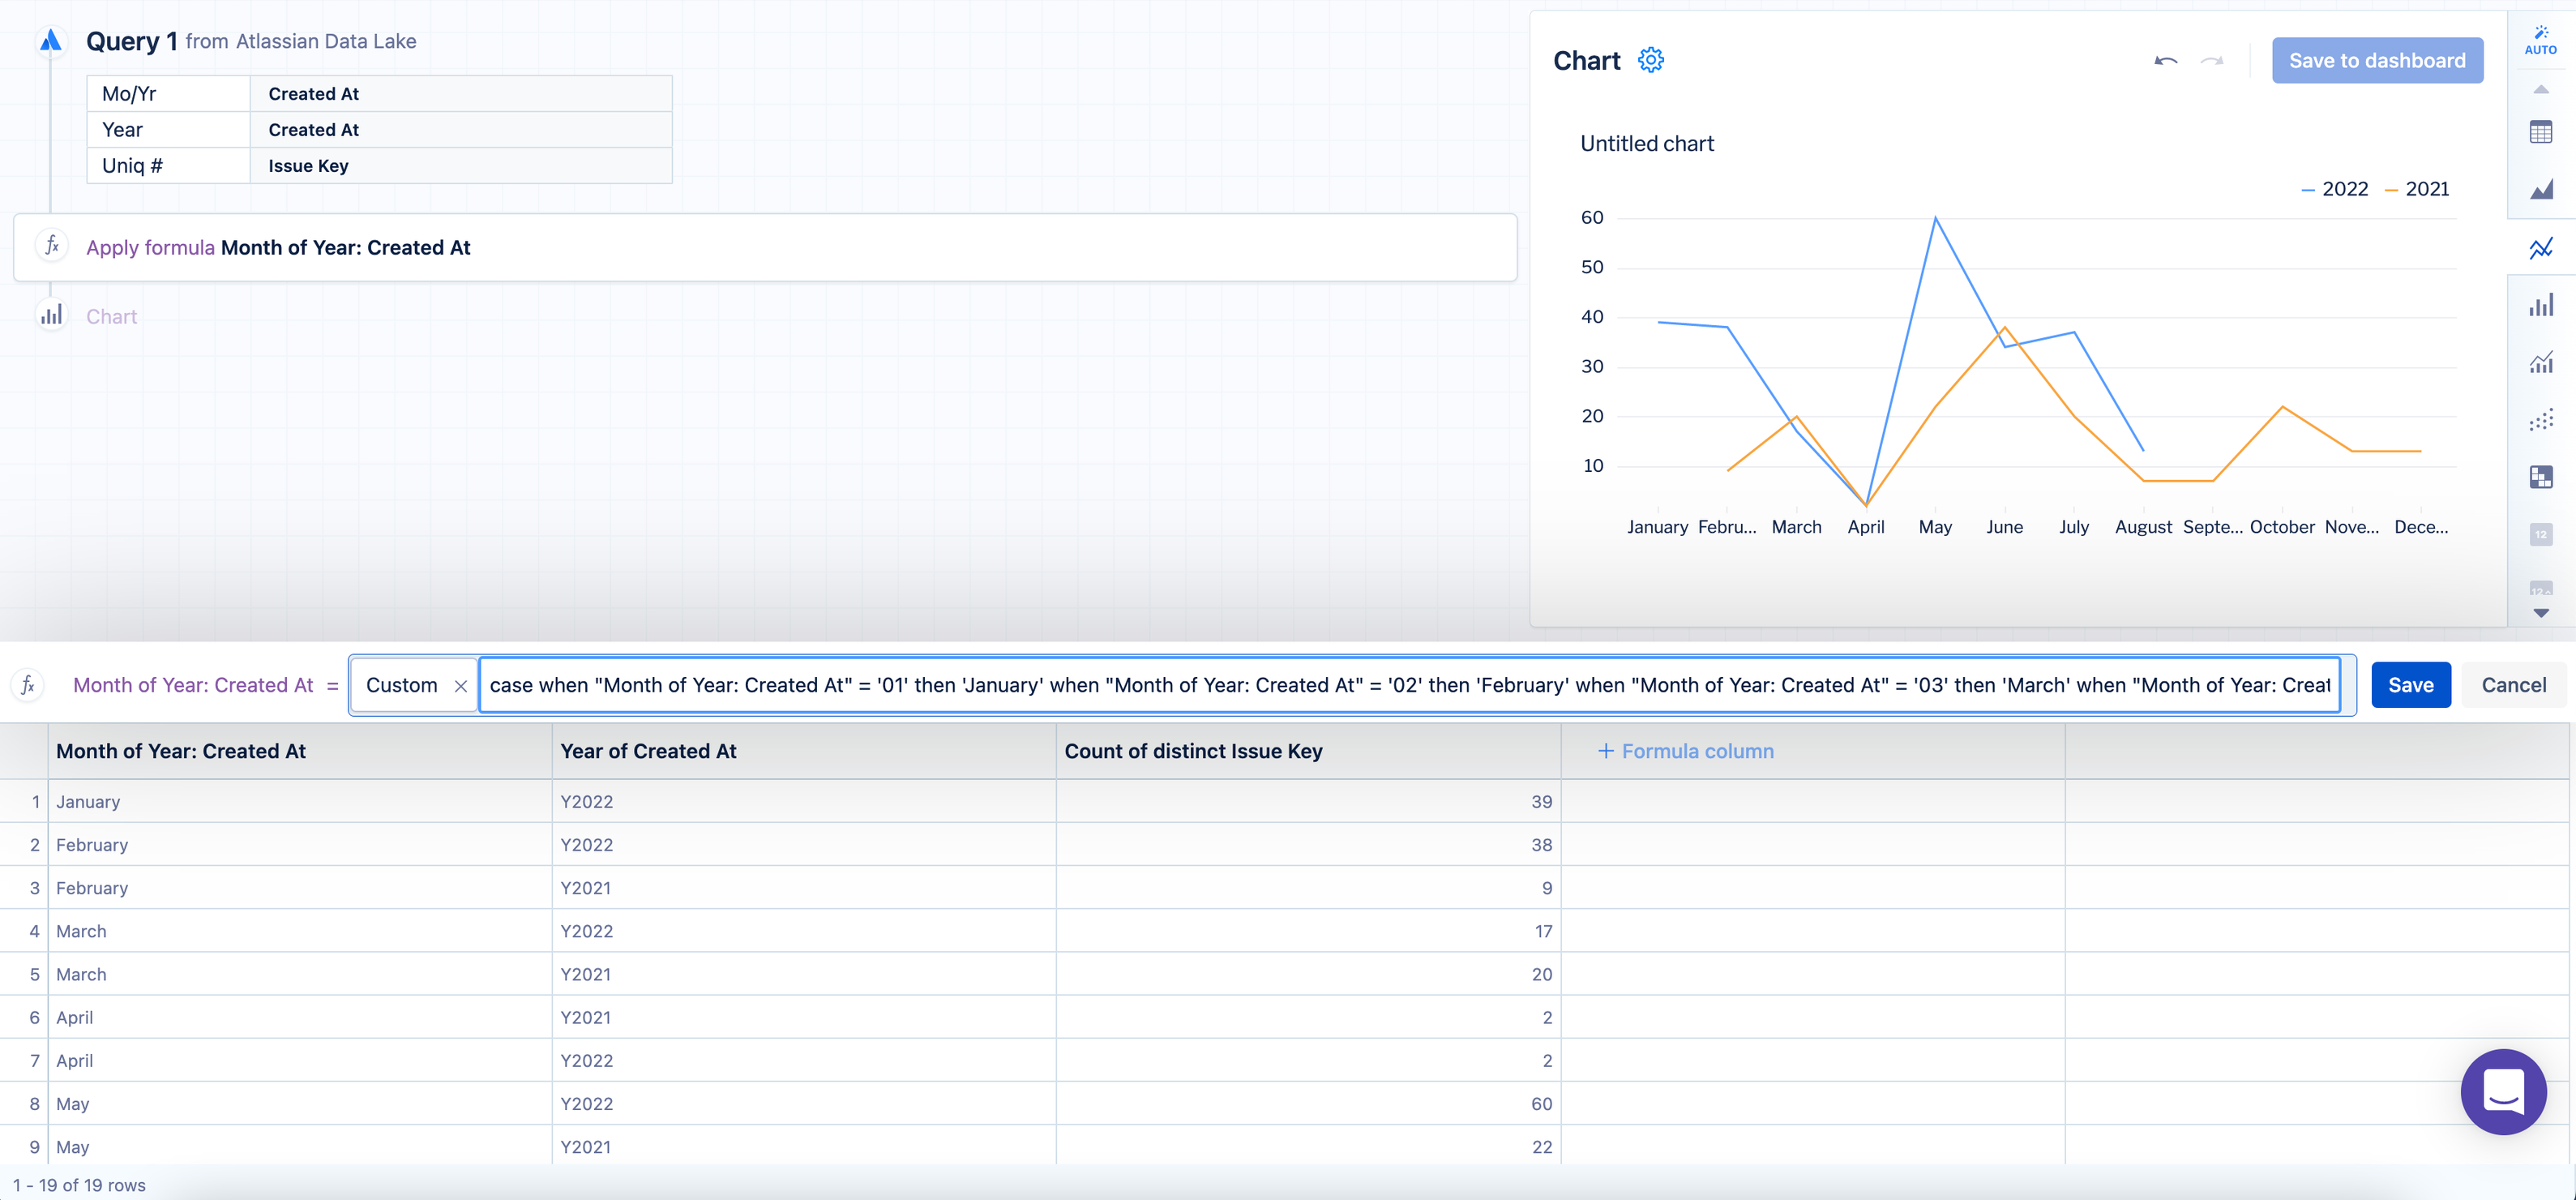
CASEstatement to rename the month numbers to the months' full names (for example, changing 01 to January):On the “Month of Year: Created At” column, use an "Apply formula" step, select Custom as the formula type, and use the following
CASEstatement as the formula:CASE WHEN "Month of Year: Created At" = '01' THEN 'January' WHEN "Month of Year: Created At" = '02' THEN 'February' WHEN "Month of Year: Created At" = '03' THEN 'March' WHEN "Month of Year: Created At" = '04' THEN 'April' WHEN "Month of Year: Created At" = '05' THEN 'May' WHEN "Month of Year: Created At" = '06' THEN 'June' WHEN "Month of Year: Created At" = '07' THEN 'July' WHEN "Month of Year: Created At" = '08' THEN 'August' WHEN "Month of Year: Created At" = '09' THEN 'September' WHEN "Month of Year: Created At" = '10' THEN 'October' WHEN "Month of Year: Created At" = '11' THEN 'November' WHEN "Month of Year: Created At" = '12' THEN 'December' END
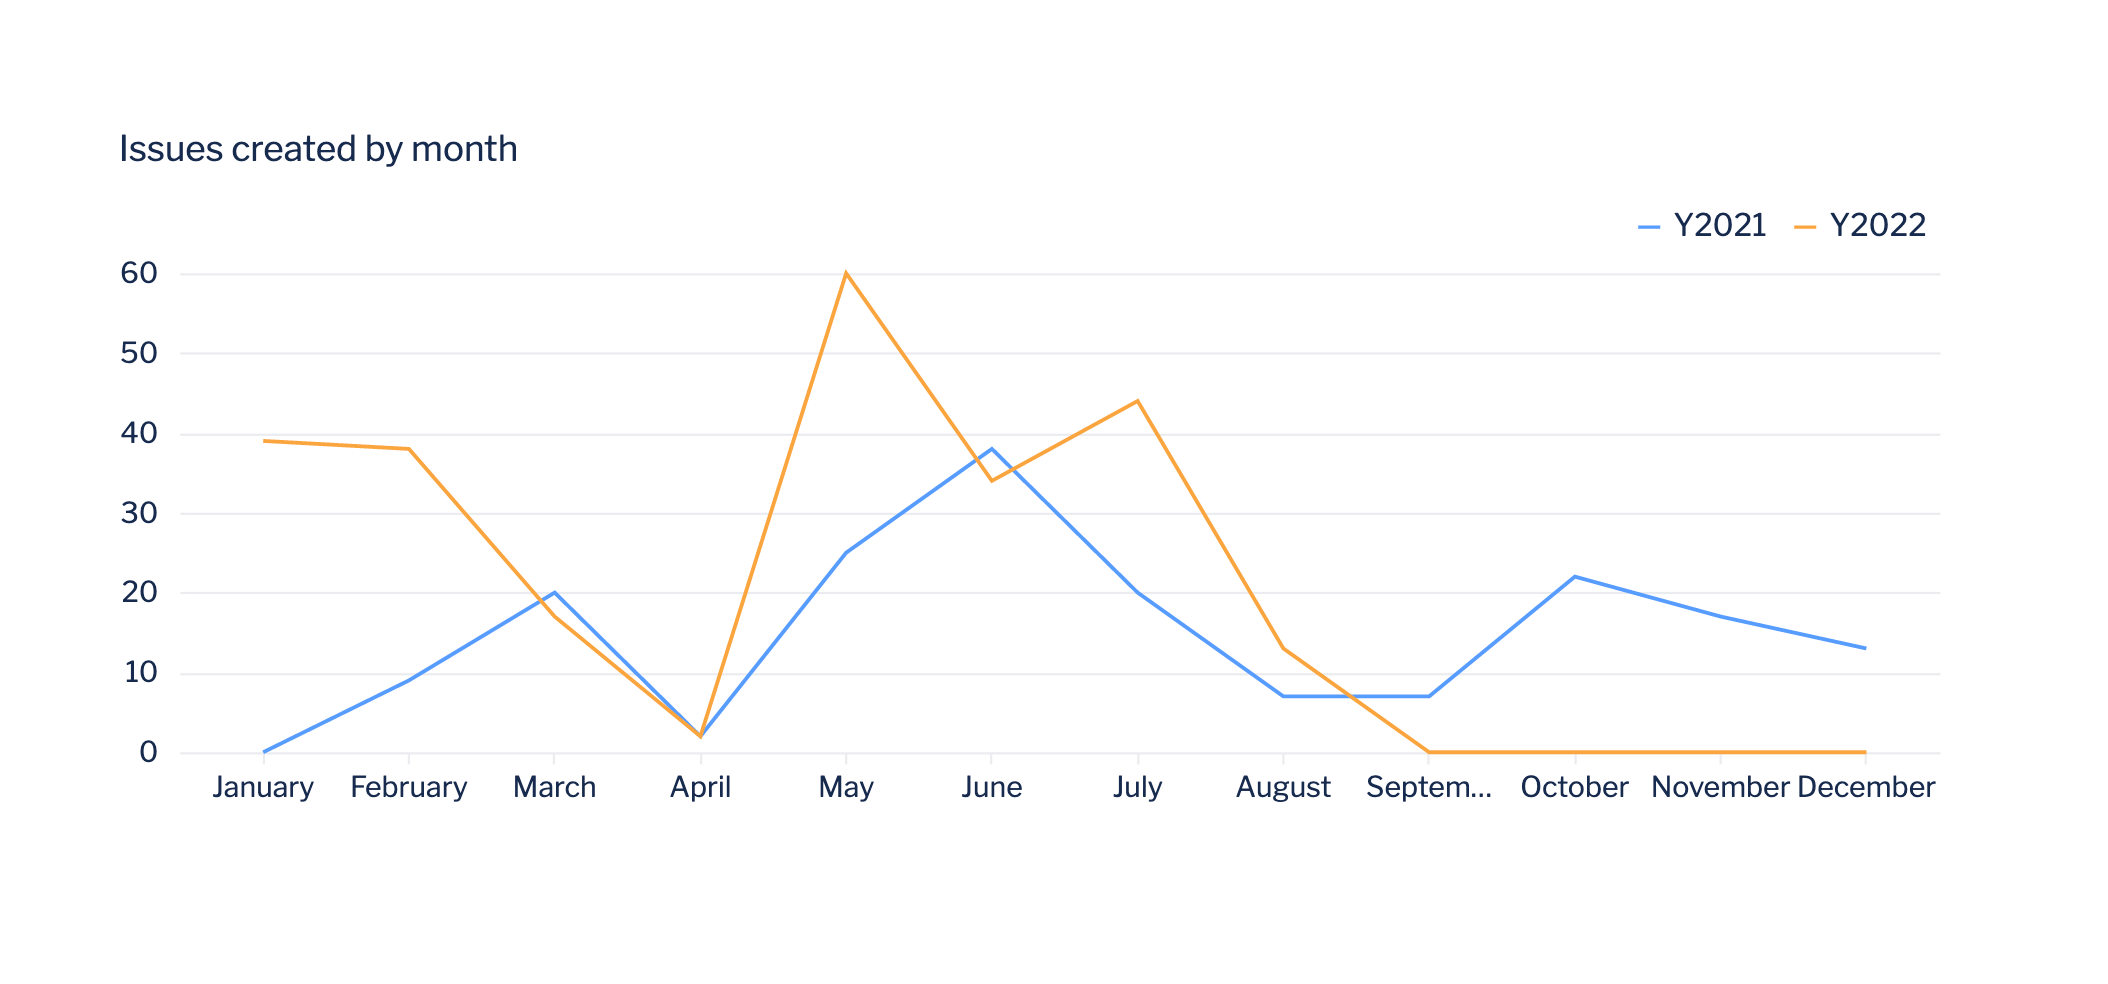
For the final step of our data formatting, add a "Pivot" step to summarize the issue counts by month for each year. This allows you to view your data as a line chart, where each line represents a calendar year.
To make things a bit clearer, you could rename the first column to Month of Year. Note that if any of your months have null data, you can add a "Zero fill" step after the “Pivot” step.
Change your chart to a line chart, and you’ll see a year-over-year comparison of your data.


