Monitoring the Dynamic LDAP connection pool
The Dynamic LDAP connection pool is an alternative to the JNDI LDAP connection pool and can be enabled for each directory separately. This page explains how you can monitor the pool statistics for each directory. For more info on the connection pool and how to enable it, see Configuring the Dynamic LDAP connection pool.
You can monitor the Dynamic LDAP connection pool in two ways:
Using the REST endpoint to quickly view live statistics
Configuring a monitoring tool to view additional Java Management Extensions (JMX) metrics to the info provided by the REST endpoint
Monitor the pool using the REST API
REST API is a quick and easy way to view the live status of the pool. For more info on the related REST endpoint, see Dynamic LDAP pool statistics.
Monitor the pool using the JMX interface
The JMX interface provides more detailed statistics for the pool. To use it, you’ll need to configure an additional tool to access the JMX metrics. In this example, we’ve used the free Java Mission Control.
What is JMX?
JMX (Java Management Extensions) is a technology used to monitor and manage Java applications. JMX uses objects called MBeans (Managed Beans) to expose data and resources from an application or one of its components.
Configure Java Mission Control
Before you begin:
Java Mission Control requires Java Runtime Environment (JRE) 11 or later.
You will have to enable JMX on each of the your Crowd nodes.
To install and use Java Mission Control:
Download Java Mission Control and install it.
Once you start Java Mission Control, you should see the following screen:
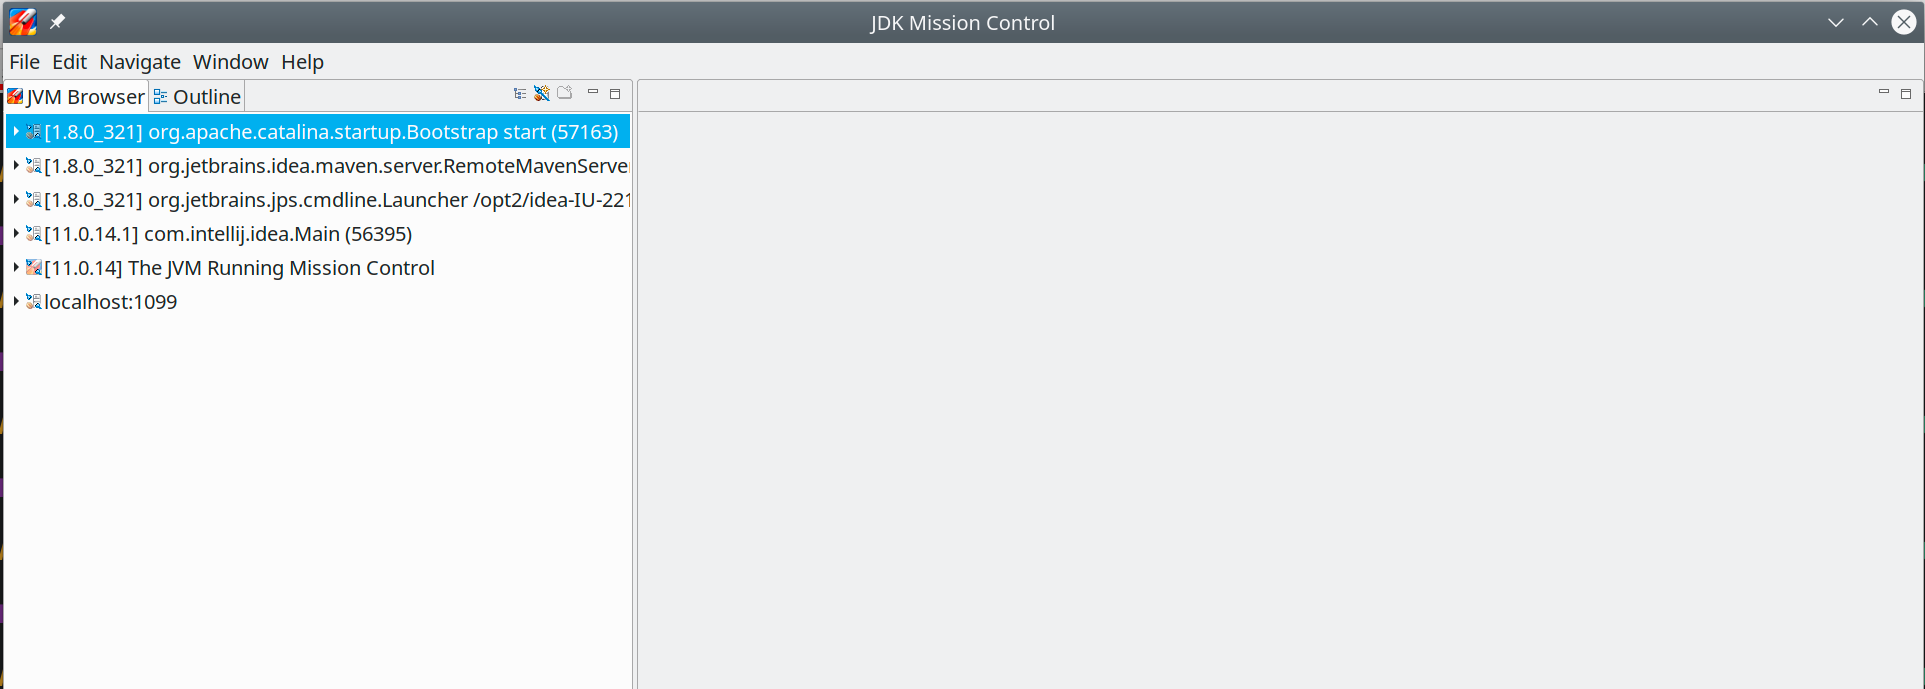
- Right-click on the server you want to connect to, and select Start the JMX Console. The following screen will appear:

- Select the MBean Browser tab at the bottom.

- In the navigation tree, find the org.apache.commons.pool2 directory and expand it. You’ll see an entry for each directory that uses the Dynamic LDAP connection pool.
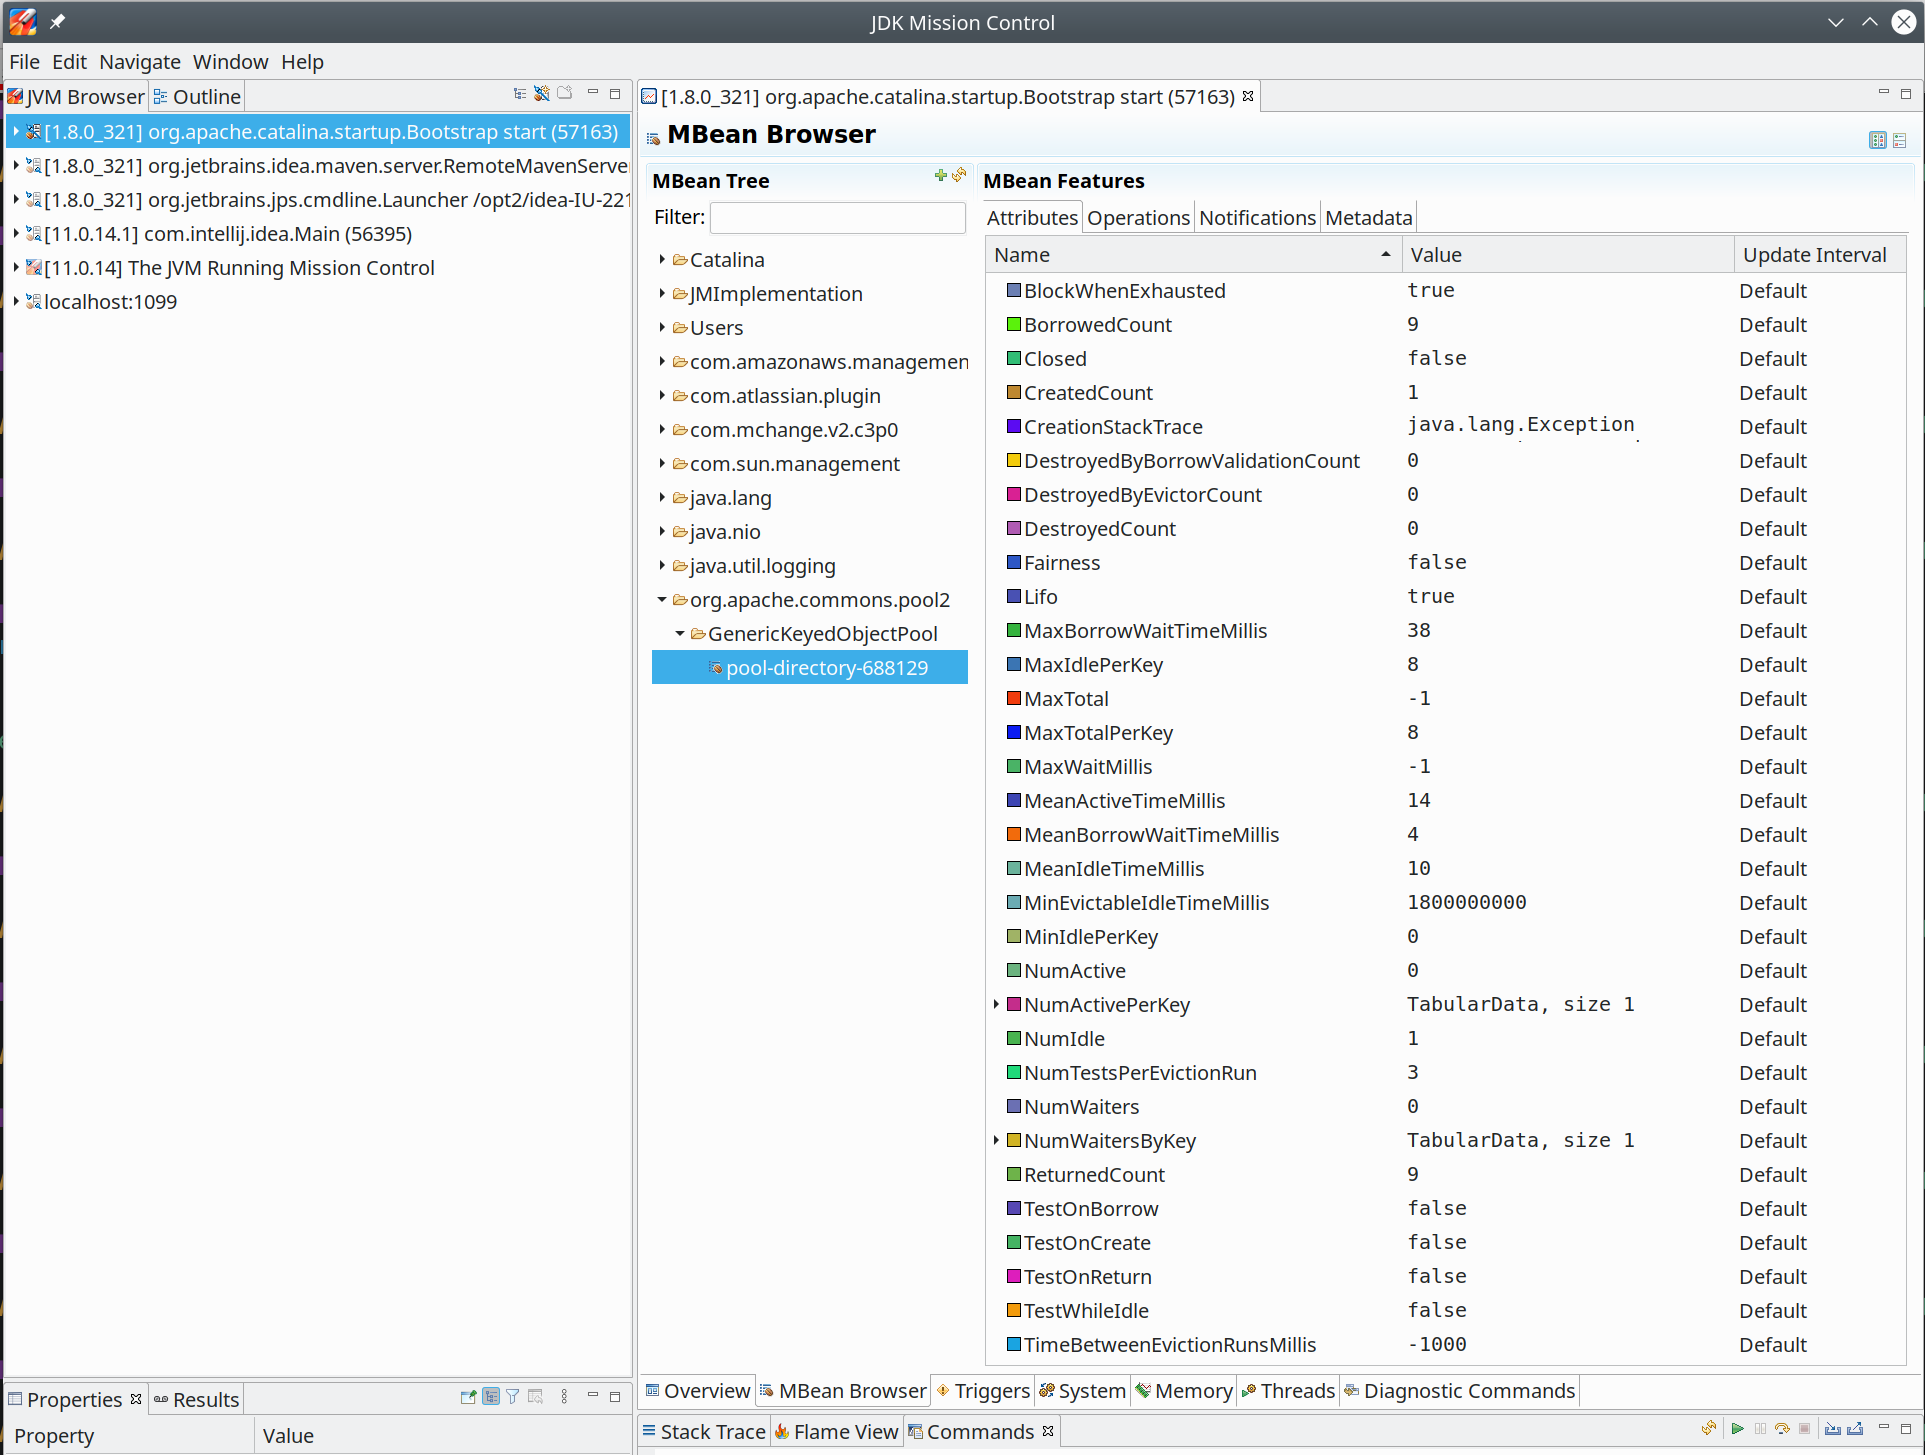
The Attributes tab shows the JMX metrics for the selected directory, together with additional parameters that that describe the status of the pool. You can read more about them in the table below.
Dynamic LDAP pool metrics
The following table shows the JMX metrics provided for each Dynamic LDAP connection pool.
Objects mentioned in the description of each metric represent one or more connection slots in the pool.
| Metric | Description |
|---|---|
| BorrowedCount | The total number of objects successfully borrowed from the pool. Measured over the pool’s lifetime. |
| CreatedCount | The total number of objects created for the pool. Measured over the pool’s lifetime. |
| DestroyedByBorrowValidationCount | The total number of objects destroyed by the pool as a result of failing validation when being borrowed. Measured over the pool’s lifetime. |
| DestroyedByEvictorCount | The total number of objects destroyed by the evictor associated with the pool. Measured over the pool’s lifetime. |
| DestroyedCount | The total number of objects destroyed by the pool. Measured over the pool’s lifetime. |
| MaxBorrowWaitTimeMillis | The maximum time a thread has waited to borrow objects from the pool. |
| MeanActiveTimeMillis | The mean time an object is active in the pool, calculated considering all the values stored in the statistics' cache which can store up to 100 values. |
| MeanBorrowWaitTimeMillis | The mean time that a recently served thread needed to wait to borrow an object from the pool, calculated considering all the values stored in the statistics' cache which can store up to 100 values. |
| MeanIdleTimeMillis | The mean time an object has been idle in the pool among, calculated considering all the values stored in the statistics' cache which can store up to 100 values. |