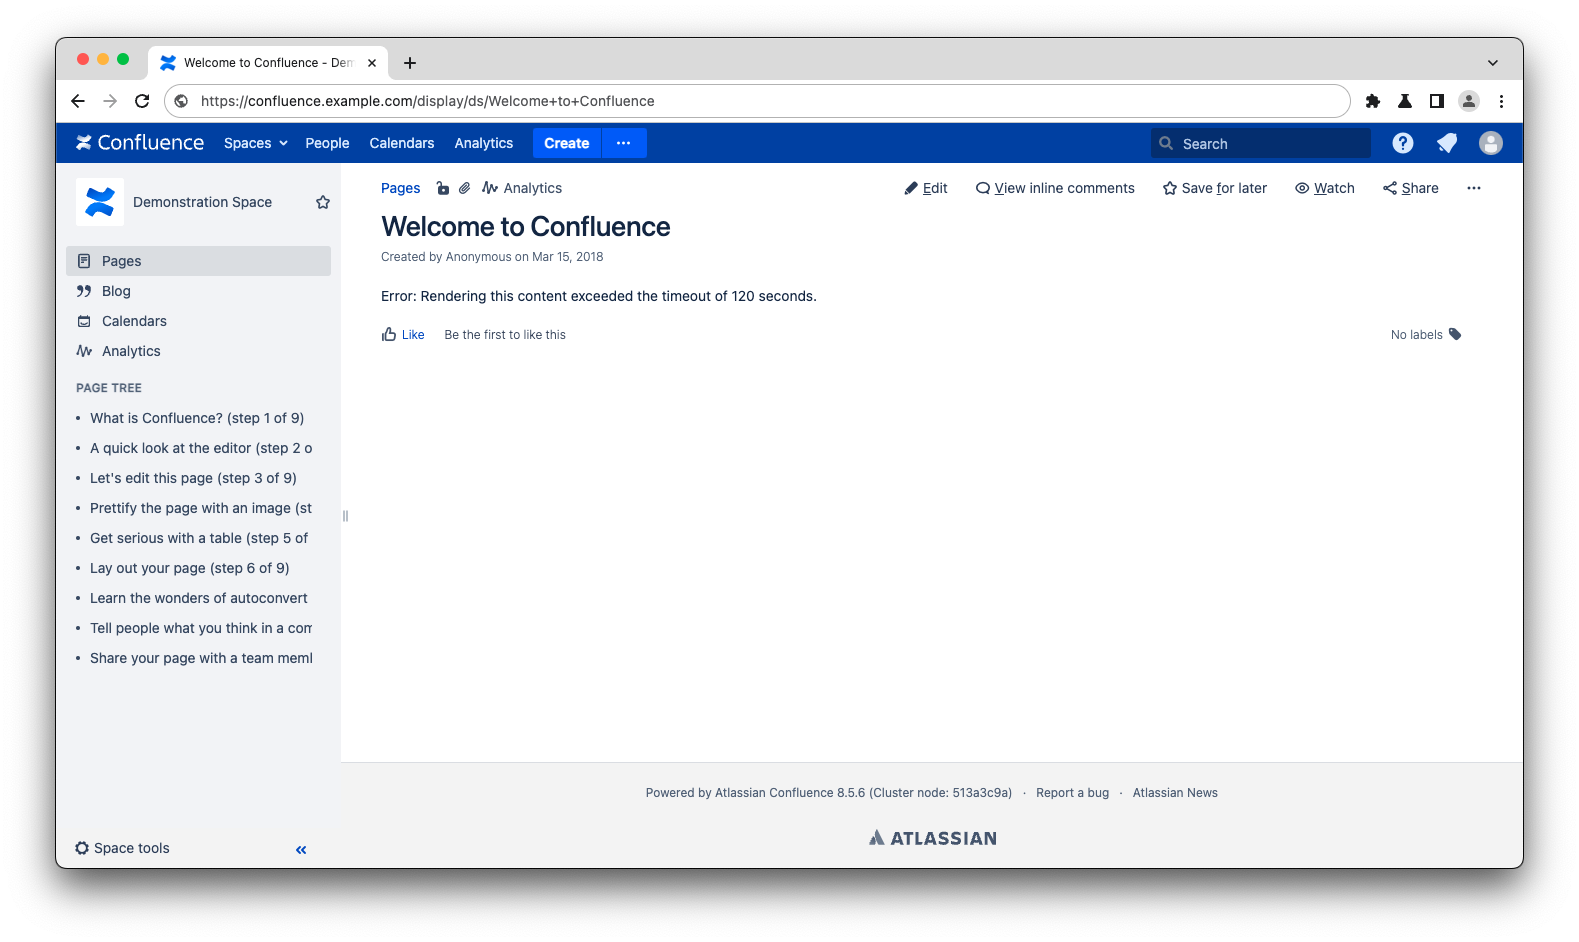
Confluence diagnostics: Rendering exceeded time limit error
Platform Notice: Data Center - This article applies to Atlassian products on the Data Center platform.
Note that this knowledge base article was created for the Data Center version of the product. Data Center knowledge base articles for non-Data Center-specific features may also work for Server versions of the product, however they have not been tested. Support for Server* products ended on February 15th 2024. If you are running a Server product, you can visit the Atlassian Server end of support announcement to review your migration options.
*Except Fisheye and Crucible
Summary
Some content can cause Confluence to take longer than the maximum allowable time (120 seconds by default) to render the page. This can often be the result of a plugin, in which case the macro rendering time limit will be exceeded— but in cases where native Confluence components fail to return in time, a more general error is thrown.
Diagnosis
Confluence throws an Error: Rendering this content exceeded the timeout of 120 seconds error when trying to visit an affected page.
The following appears in the application log:
2024-02-26 14:05:57,840 WARN [http-nio-8080-exec-765] [render.xhtml.transformers.DefaultFragmentTransformer] transformFragment Rendering: 'page: Welcome to Confluence (98315)' exceeded the timeout of 120 seconds by -120000 milliseconds
-- url: /display/ds/Welcome+to+Confluence | page: 98315 | traceId: c6c69cfe41a091eb | userName: JSmith | referer: https://confluence.example.com/display/ds | action: viewpage
2024-02-26 14:05:57,842 ERROR [http-nio-8080-exec-765] [content.render.xhtml.DefaultRenderer] renderWithoutMetrics Rendering this content exceeded the timeout of 120 seconds.
-- url: /display/ds/Welcome+to+Confluence | page: 98315 | traceId: c6c69cfe41a091eb | userName: JSmith | referer: https://confluence.example.com/display/ds | action: viewpage
A stuck thread alert may also appear in the catalina log:
Cause
An internal Confluence component is preventing the page from being rendered in under 120 seconds. The specific cause can vary from case to case, but some examples include:
- Excessive permission checks
- Large number of attachments in rendered content
To locate the source of the alert, use the timestamp from the alert message in the application log to locate the corresponding stuck thread alert in the catalina logs. The stuck log stack trace will contain a reference to the method Confluence was trying to execute before the time limit was reached. In the example stack trace above, the following packages were present, indicating that Confluence was still calculating permissions multiple minutes after the user's request:
com.atlassian.confluence.pages.DefaultAttachmentManager.getAllVersions
...
com.atlassian.confluence.plugin.descriptor.web.conditions.BasePermissionCondition.shouldDisplay
Solution
The Page Timeout limit can be increased in General Configuration > Security Configuration > Page Timeout. This will increase the amount of time Confluence will spend rendering the content of a single page.
Increasing the Page Timeout value will not solve the underlying performance problem that causes this error, but it may allow you to access the affected page to further investigate the problem.
In the example of too many attachments on a page as mentioned above, we'd recommend removing a number of the attachments from the page in question so that it can then render within the default 120 second timeout.
If you are unable to locate the source of the behavior, and raising the Page Timeout value does not resolve the error, reach out to Atlassian Support for further assistance.
