Performance and scale testing
With every Jira release, we’re publishing a performance and scaling report that compares performance of the current Jira version with the previous one. The report also contains results of how various data dimensions (number of custom fields, issues, projects, and so on) affect Jira, so you can check which of these data dimensions should be limited to have best results when scaling Jira.
This report is for Jira 9.2. If you’re looking for other reports, select your version at the top-right.
Skip to
Introduction
When some Jira administrators think about how to scale Jira, they often focus on the number of issues a single Jira instance can hold. However, the number of issues is not the only factor that determines the scale of a Jira instance. To understand how a large instance may perform, you need to consider multiple factors.
This page explains how Jira performs across different versions and configurations. So whether you are a new Jira evaluator that wants to understand how Jira can scale to your growing needs or you're a seasoned Jira administrator that is interested in taking Jira to the next level, this page is here to help.
There are two main approaches, which can be used in combination to scale Jira across your entire organization:
- Scale a single Jira instance.
- Use Jira Data Center which provides Jira clustering.
Here we'll explore techniques to get the most out of Jira that are common to both approaches. For additional information on Jira Data Center and how it can improve performance under concurrent load, please refer to our Jira Data Center page.
Determining the scale of a single Jira instance
There are multiple factors that may affect Jira's performance in your organization. These factors fall into the following categories (in no particular order):
- Data size
- The number of issues, comments, and attachments.
- The number of projects.
- The number of Jira project attributes, such as custom fields, issue types, and schemes.
- The number of users registered in Jira and groups.
- The number of boards, and the number of issues on the board (when you're using Jira Software).
- Usage patterns
- The number of users concurrently using Jira.
- The number of concurrent operations.
- The volume of email notifications.
- Configuration
- The number of plugins (some of which may have their own memory requirements).
- The number of workflow step executions (such as Transitions and Post Functions).
- The number of jobs and scheduled services.
- Deployment environment
- Jira version used.
- The server Jira runs on.
- The database used and connectivity to the database.
- The operating system, including its file system.
- JVM configuration.
This page will show how the speed of Jira can be influenced by the size and characteristics of data stored in the database.
Jira 9.2 performance
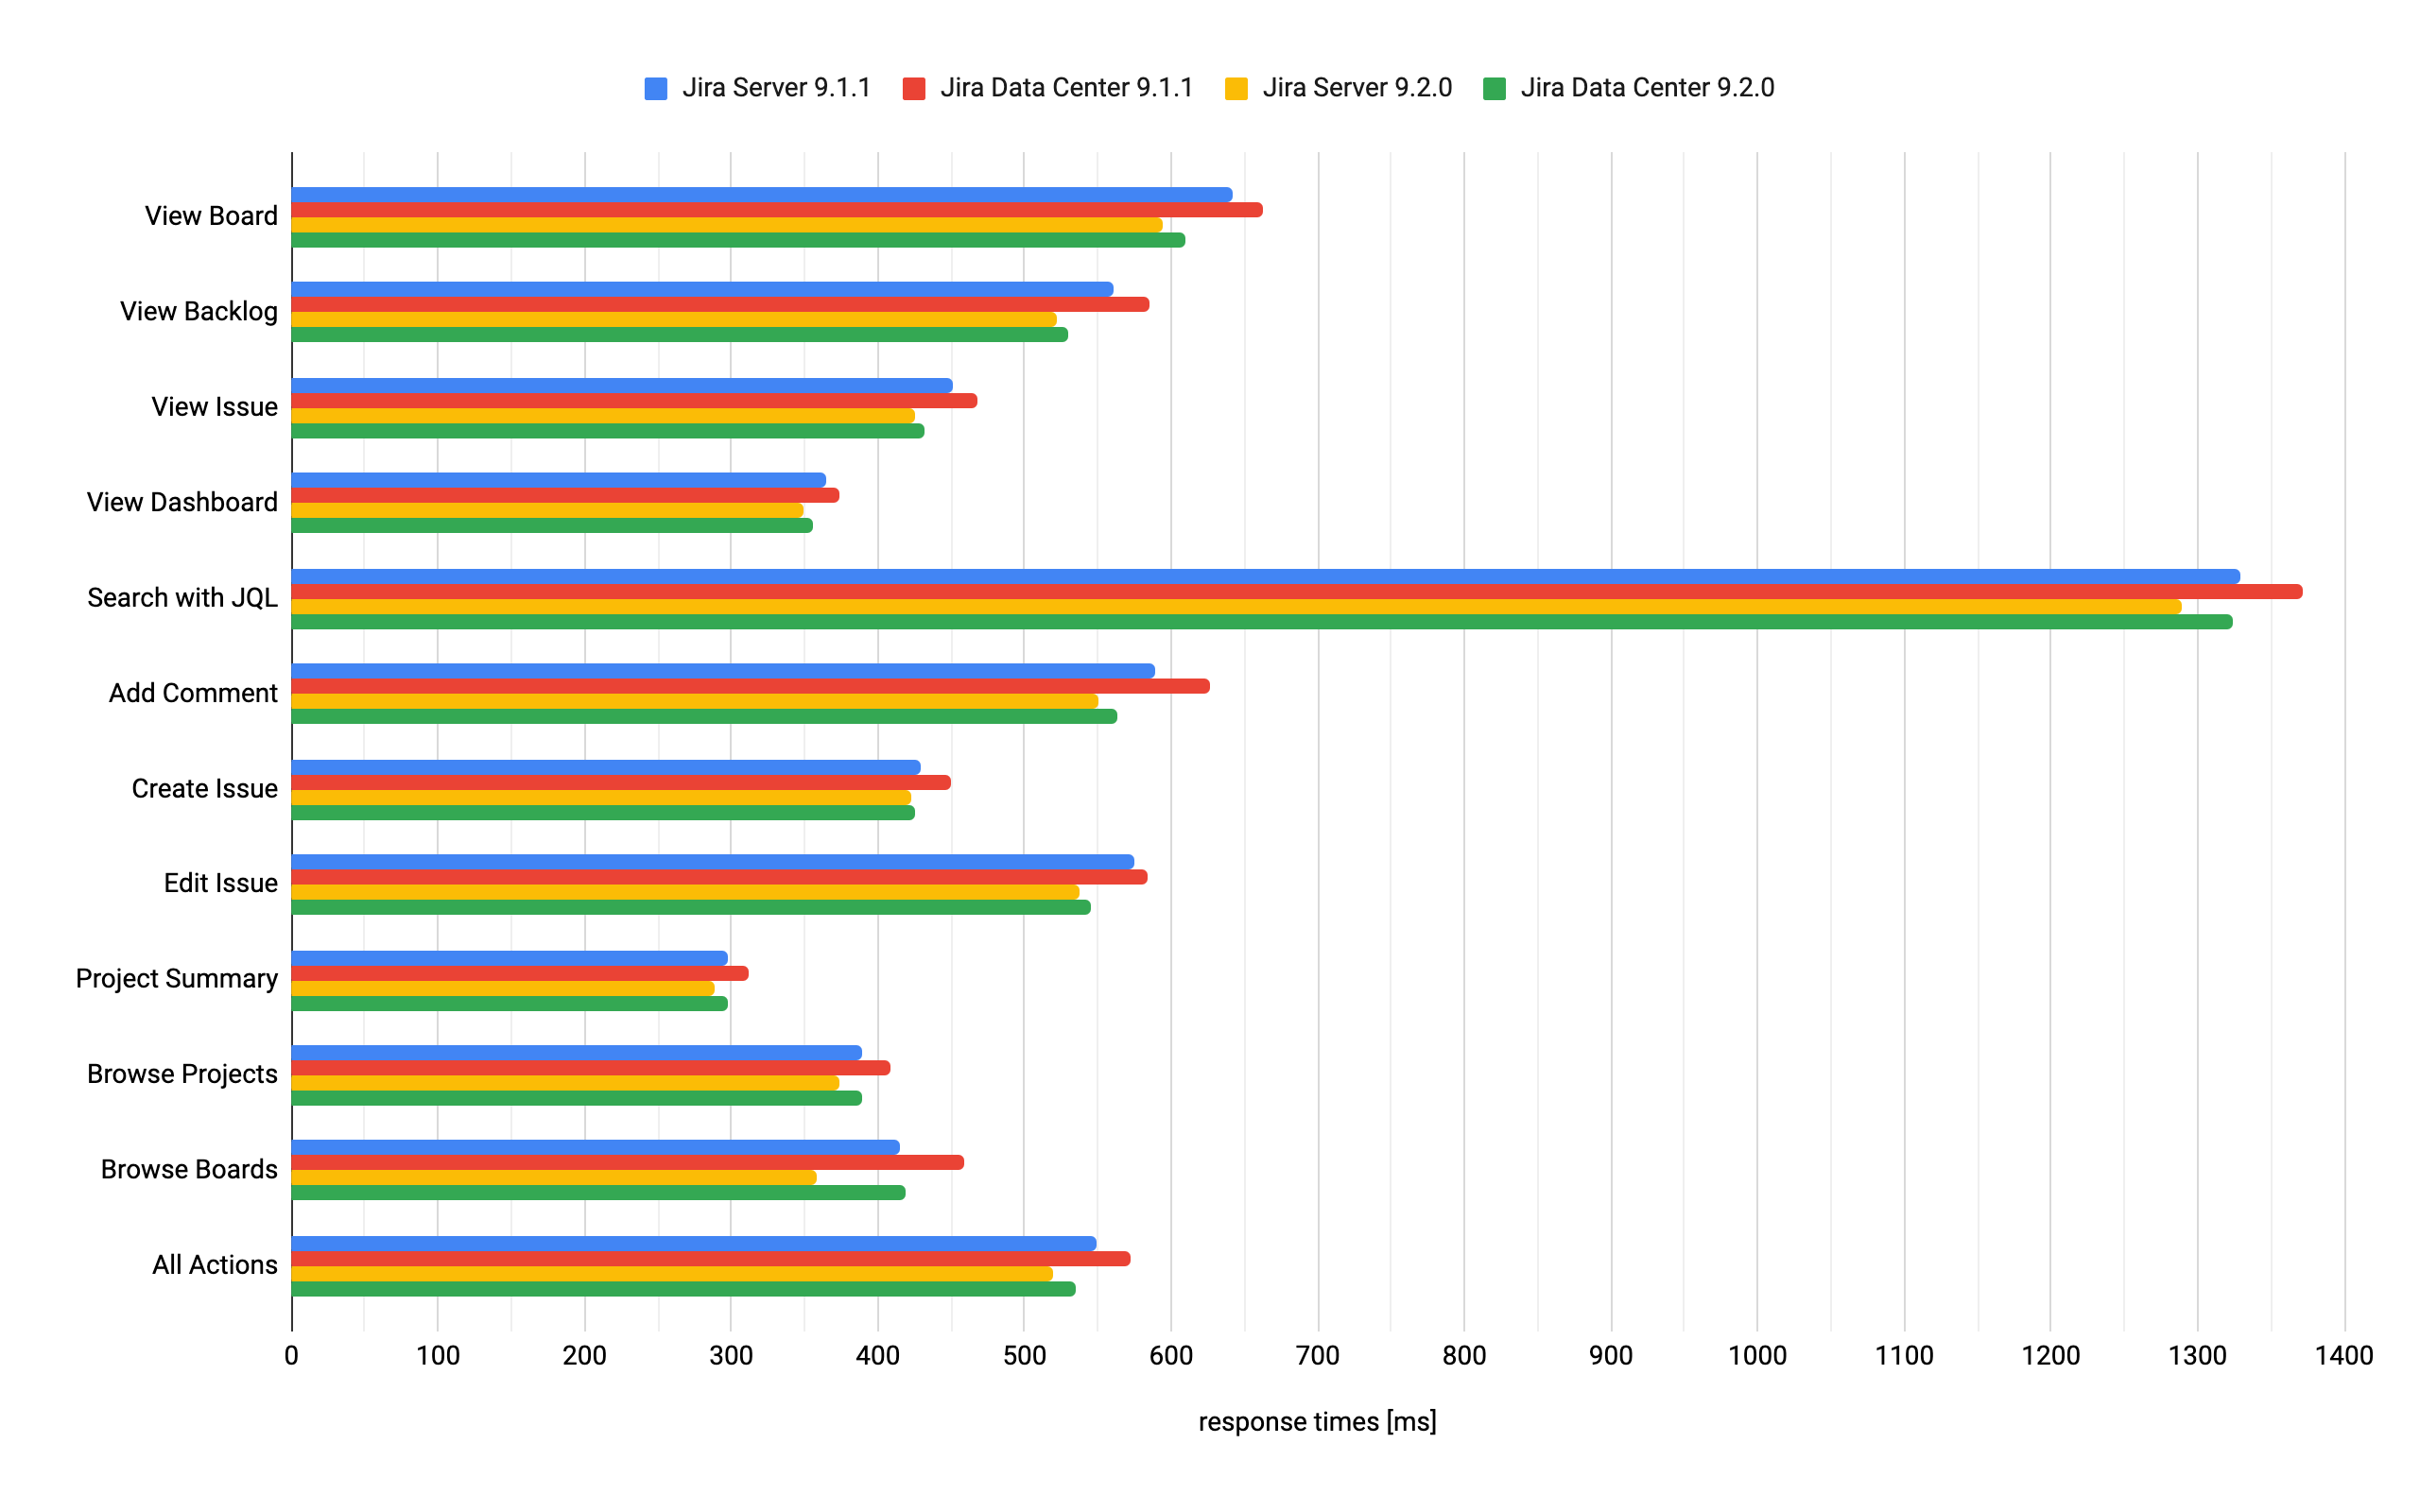
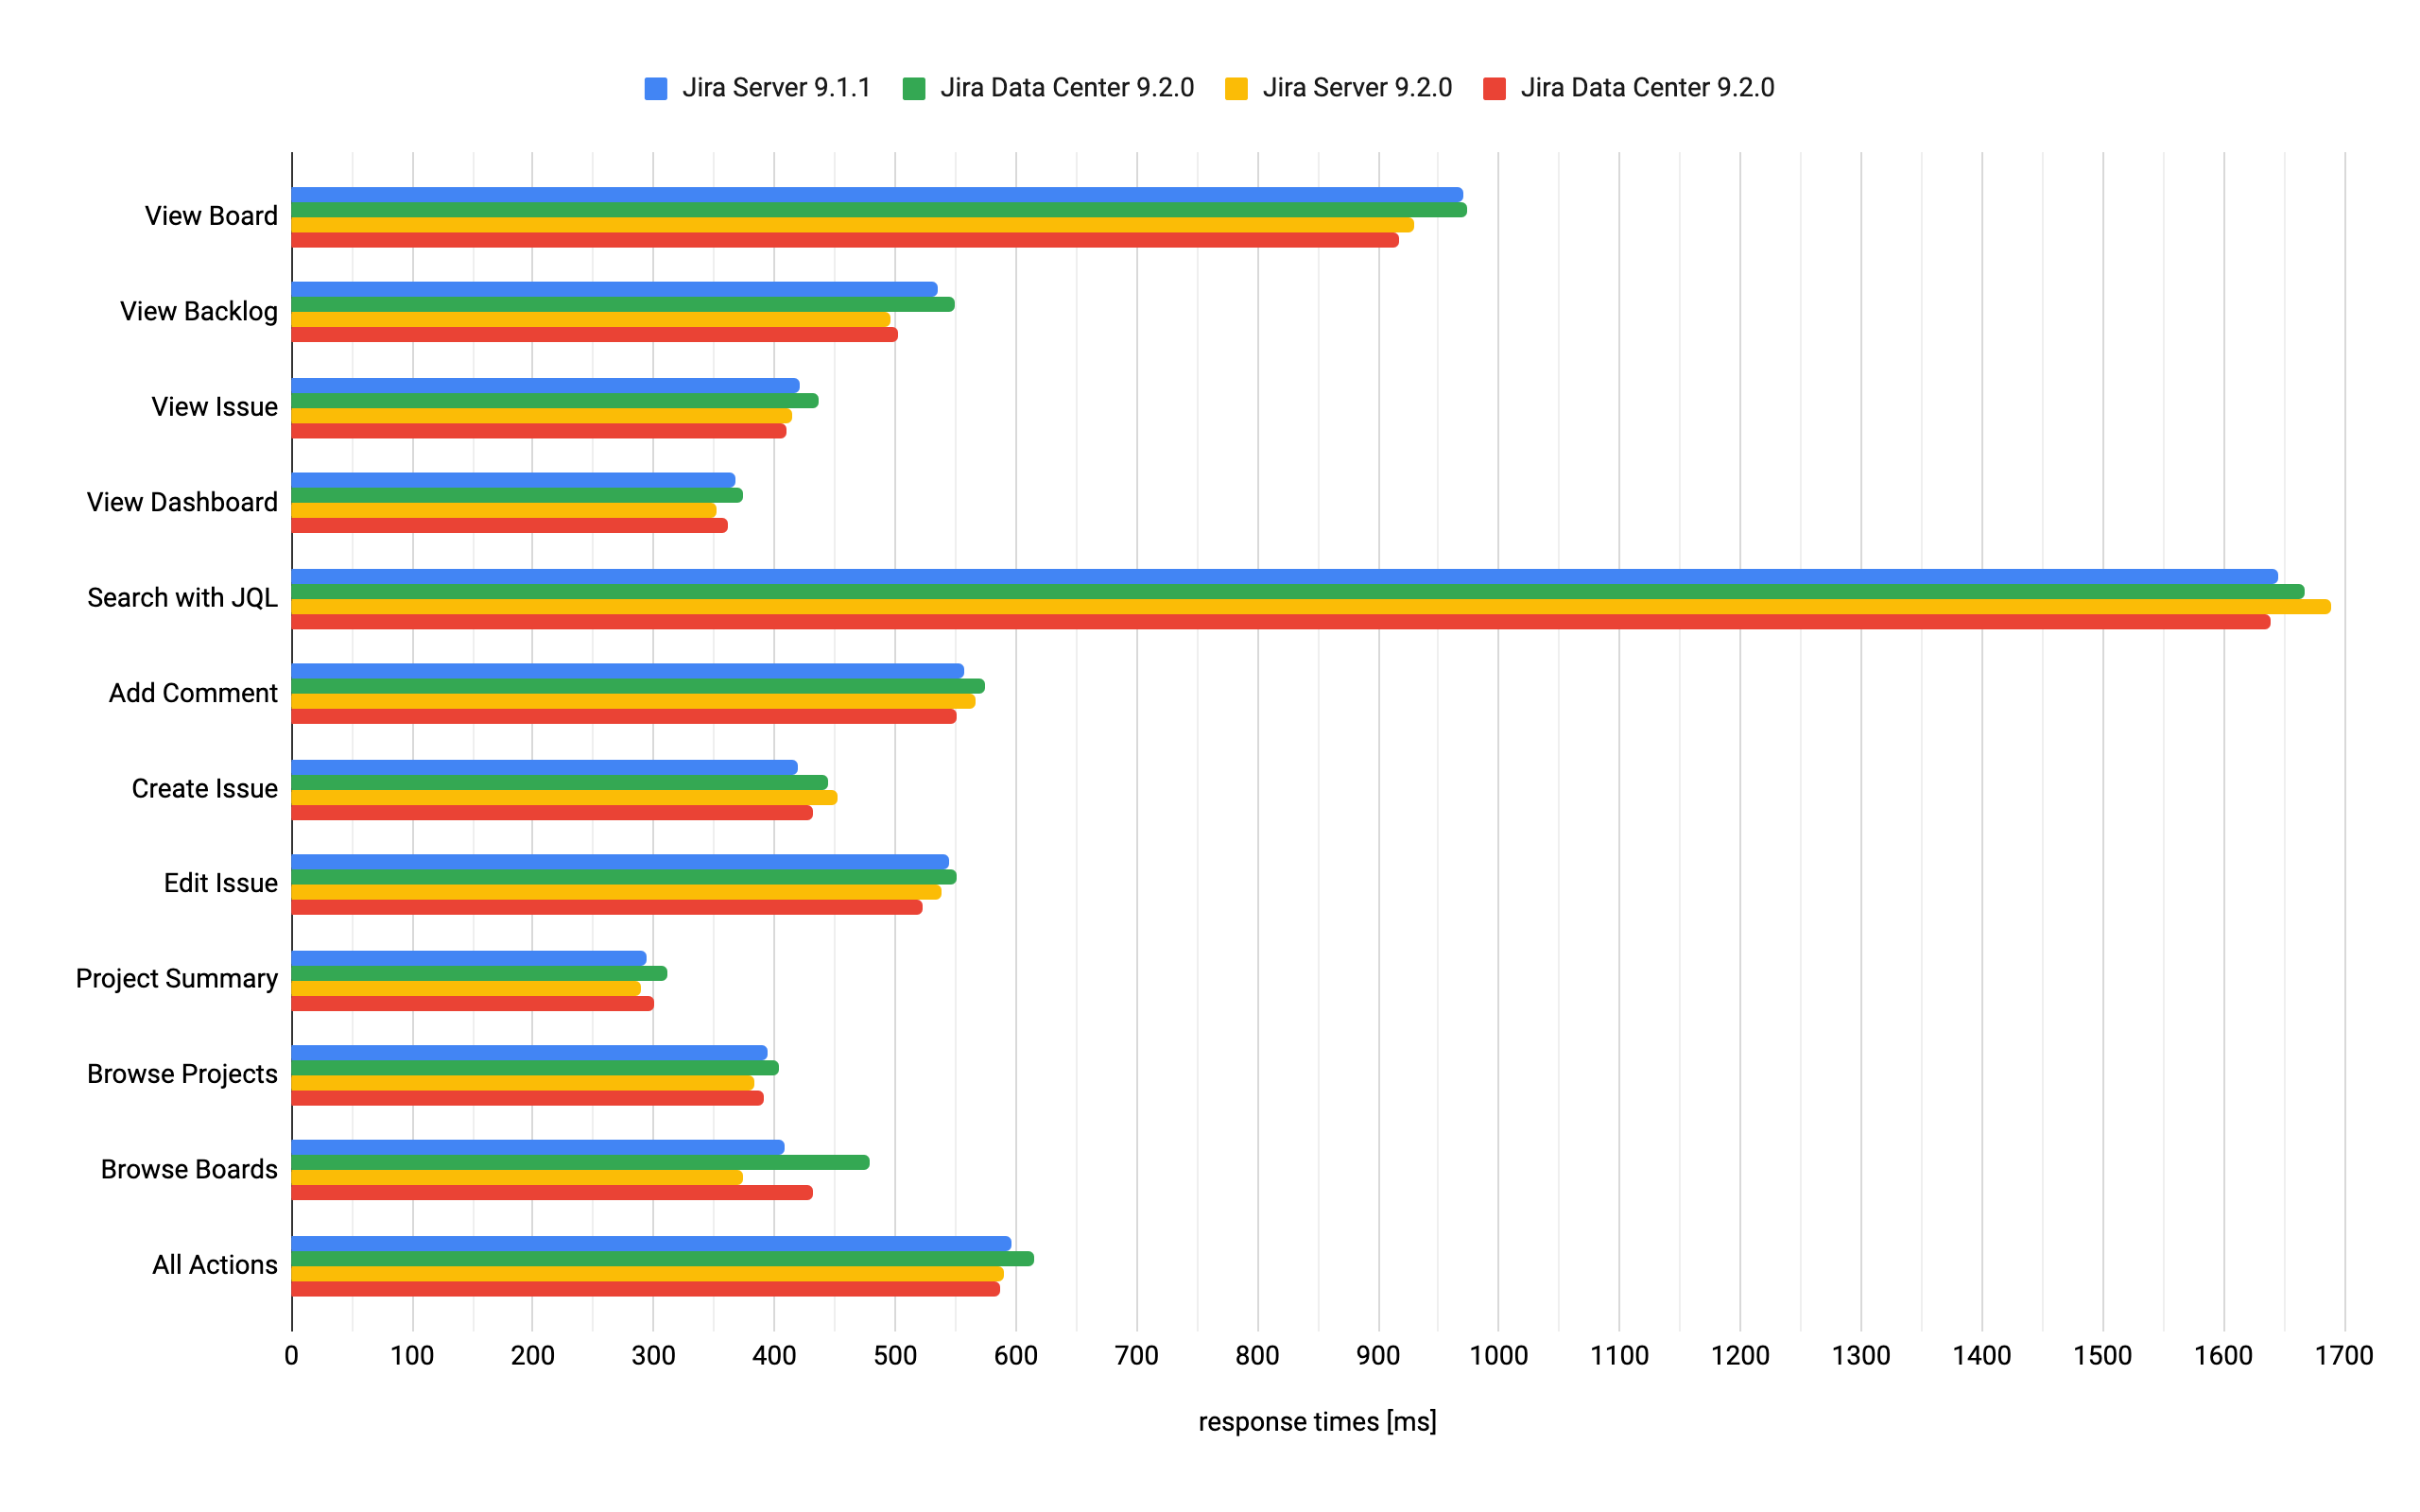
Jira 9.2 was not focused solely on performance, however we do aim to provide the same, if not better, performance with each release. In this section, we'll compare Jira 9.2.0 to Jira 9.1.1. We ran the same extensive test scenario for both Jira versions. The only difference between the scenarios was the Jira version.
The following chart presents mean response times of individual actions performed in Jira. To check the details of these actions and the Jira instance they were performed in, see Testing methodology.
Response times for Jira actions
Jira 9.2.0 vs Jira 9.1.1
Testing methodology
The following sections detail the testing environment, including hardware specification, and methodology we used in our performance tests.
Jira 9.2.0 scalability
Jira's flexibility causes tremendous diversity in our customer's configurations. Analytics data shows that nearly every customer dataset displays a unique characteristic. Different Jira instances grow in different proportions of each data dimension. Frequently, a few dimensions become significantly bigger than the others. In one case, the issue count may grow rapidly, while the project count remains constant. In another case, the custom field count may be huge, while the issue count is small.
Many organizations have their own unique processes and needs. Jira's ability to support these various use cases explains the dataset diversity. However, each data dimension can influence Jira's speed. This influence is often not constant nor linear.
In order to provide individual Jira instance users with an optimum experience and avoid performance degradation, it is important to understand how specific Jira data dimensions influence the speed of the application. In this section we will present the results of the Jira 9.2.0 scalability tests that investigated the relative impact of various configuration values.
How we tested
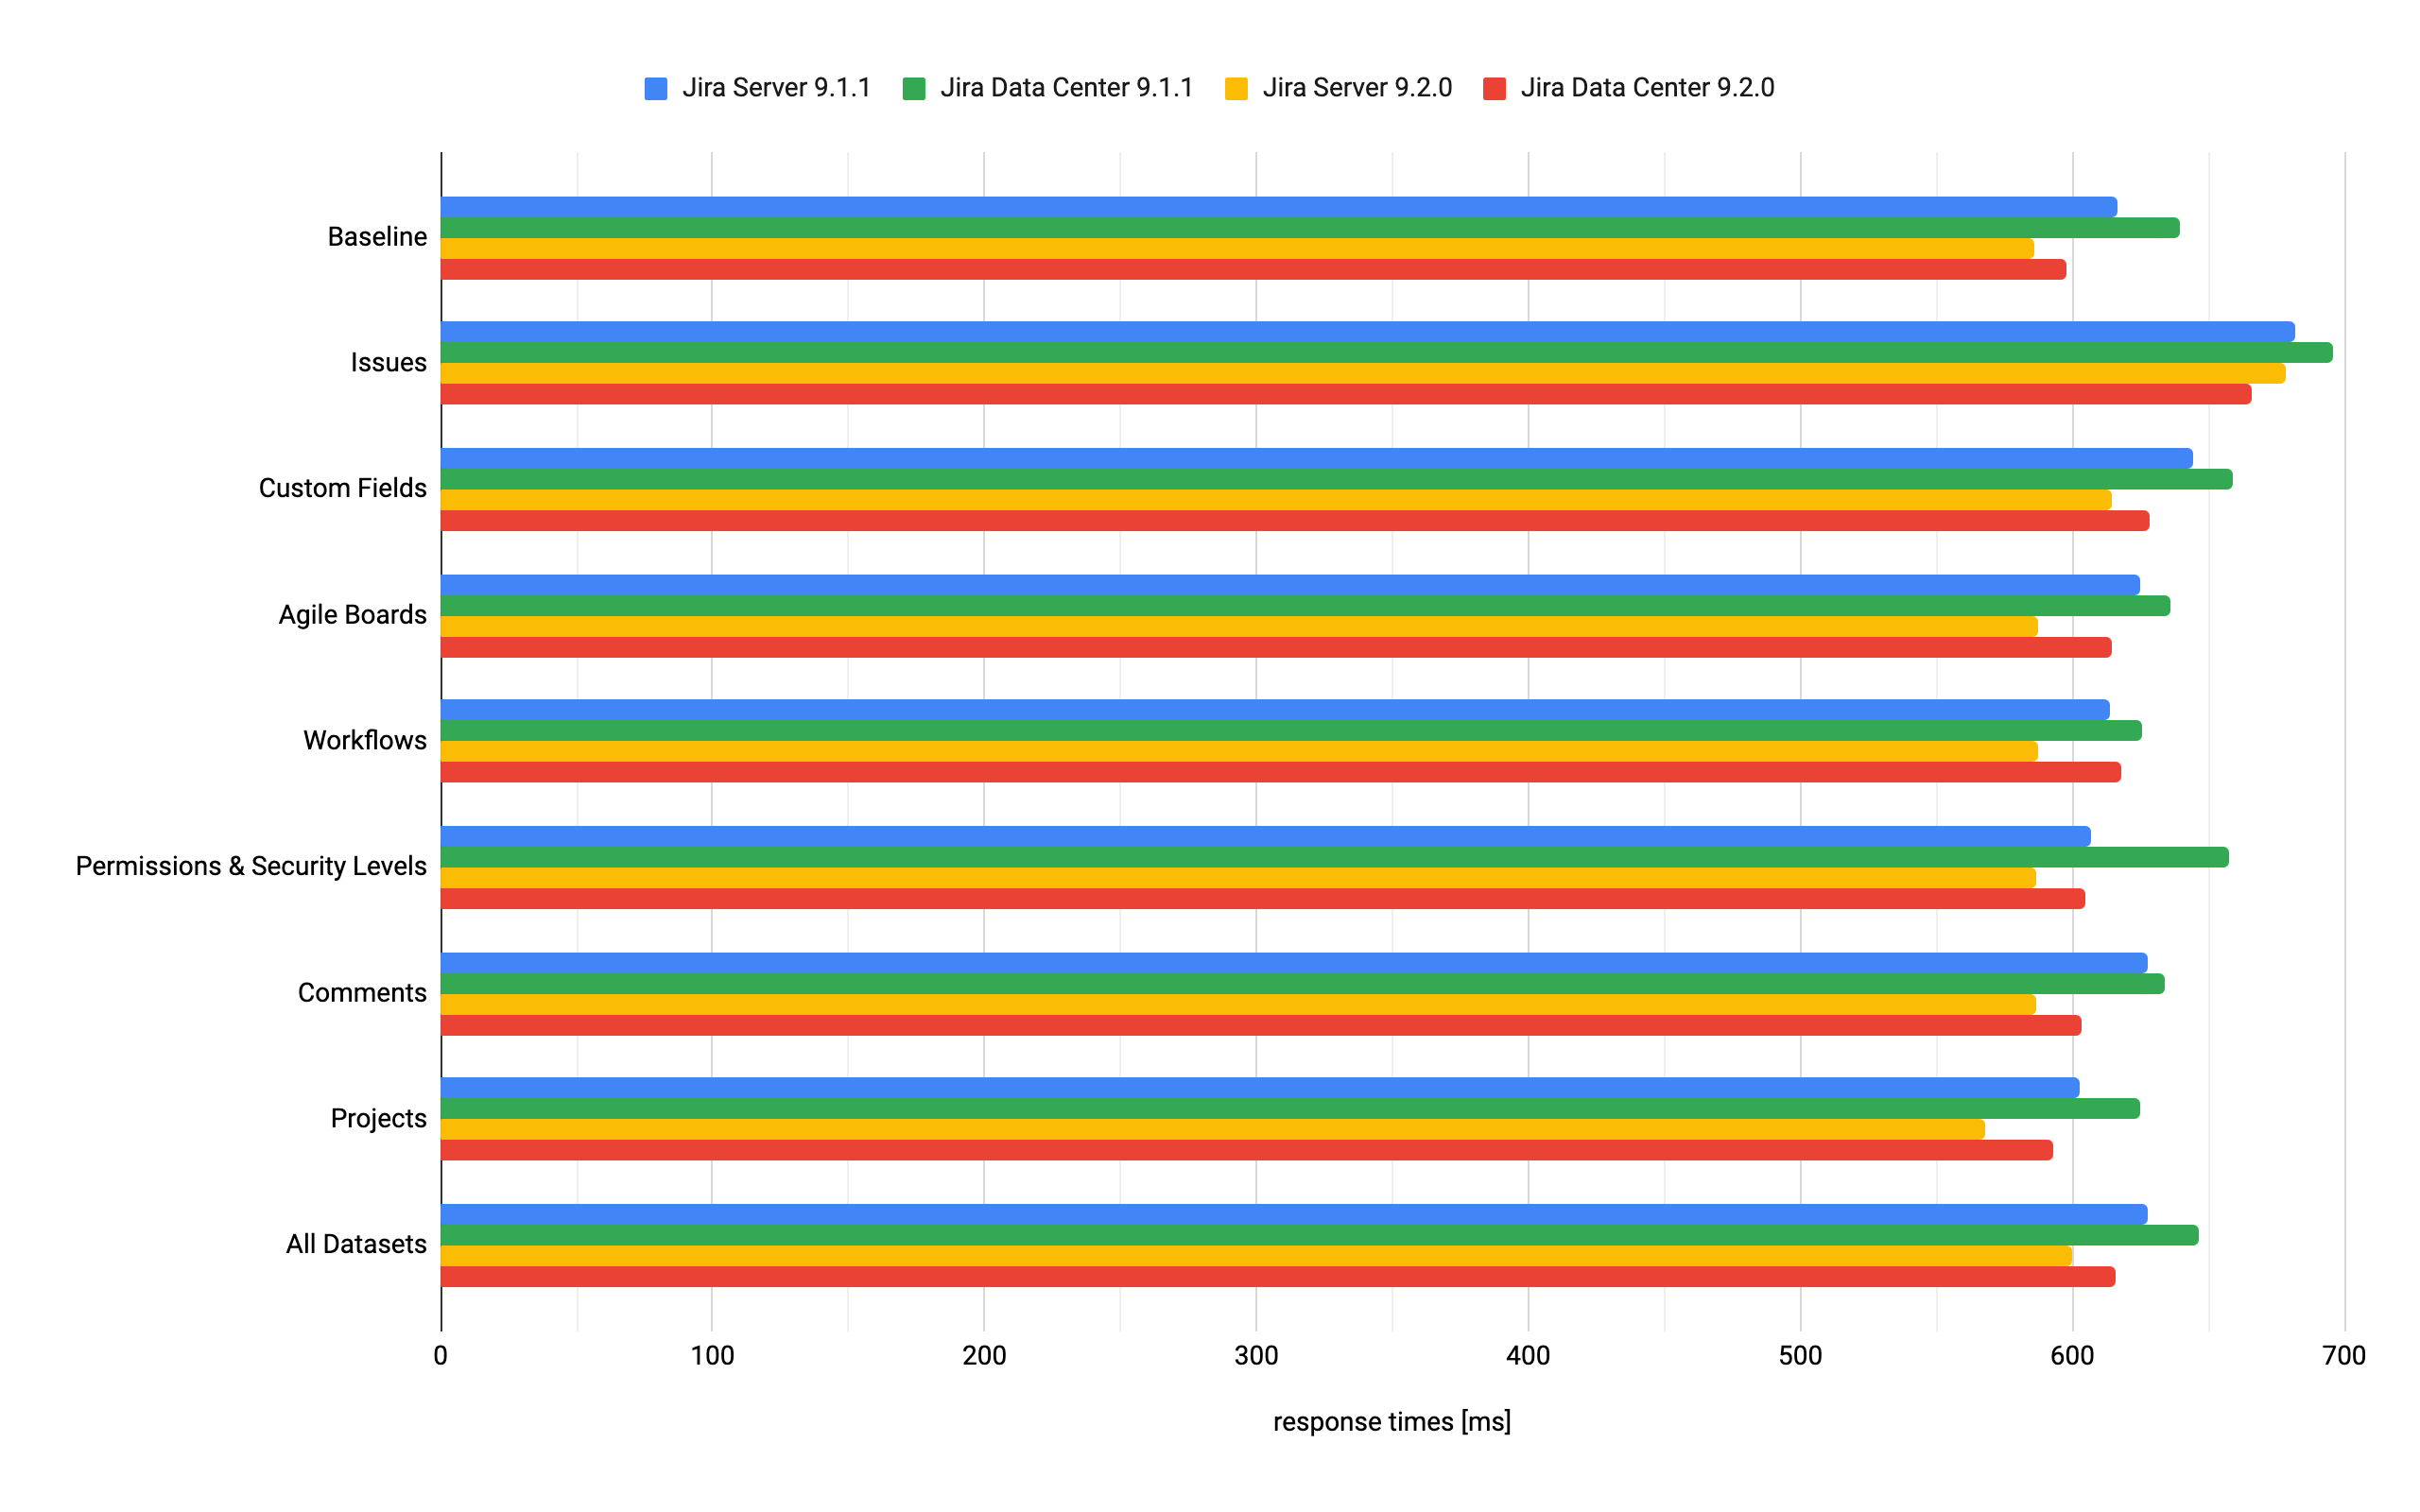
- As a reference for the test we used a Jira 9.2.0 instance with the baseline test data set specified in "Testing methodology" and ran the full performance test cycle on it.
- To focus on data dimensions and their effect on performance, we didn't test individual actions, but instead used a mean of all actions from the performance tests.
- Next, in the baseline data set we doubled each attribute and ran independent performance tests for each doubled value (i.e. we ran the test with a doubled number of issues, or doubled number of custom fields) while leaving all the other attributes in the baseline data set unchanged.
- Then, we compared the response times from the doubled data set test cycles with the reference results. With this approach we could isolate and observe how the growing size of individual Jira configuration items affects the speed of an (already large) Jira instance.
Response times for Jira data sets
Jira 9.2.0 vs Jira 9.1.1
Further resources
Archiving issues
The number of issues affects Jira's performance, so you might want to archive issues that are no longer needed. You may also come to conclusion that the massive number of issues clutters the view in Jira, and therefore you still may wish to archive the outdated issues from your instance. See Archiving projects.
User Management
As your Jira user base grows you may want to take a look at the following:
- Connecting Jira to your Directory for authentication, user and group management.
- Connecting to Crowd or Another Jira Server for User Management.
- Allowing Other Applications to Connect to Jira for User Management.
Jira Knowledge Base
For detailed guidelines on specific performance-related topics refer to the Troubleshoot performance issues in Jira server article in the Jira Knowledge Base.
Jira Enterprise Services
For help with scaling Jira in your organization directly from experienced Atlassians, check out our Additional Support Services offering.
Atlassian Experts
The Atlassian Experts in your local area can also help you scale Jira in your own environment.


