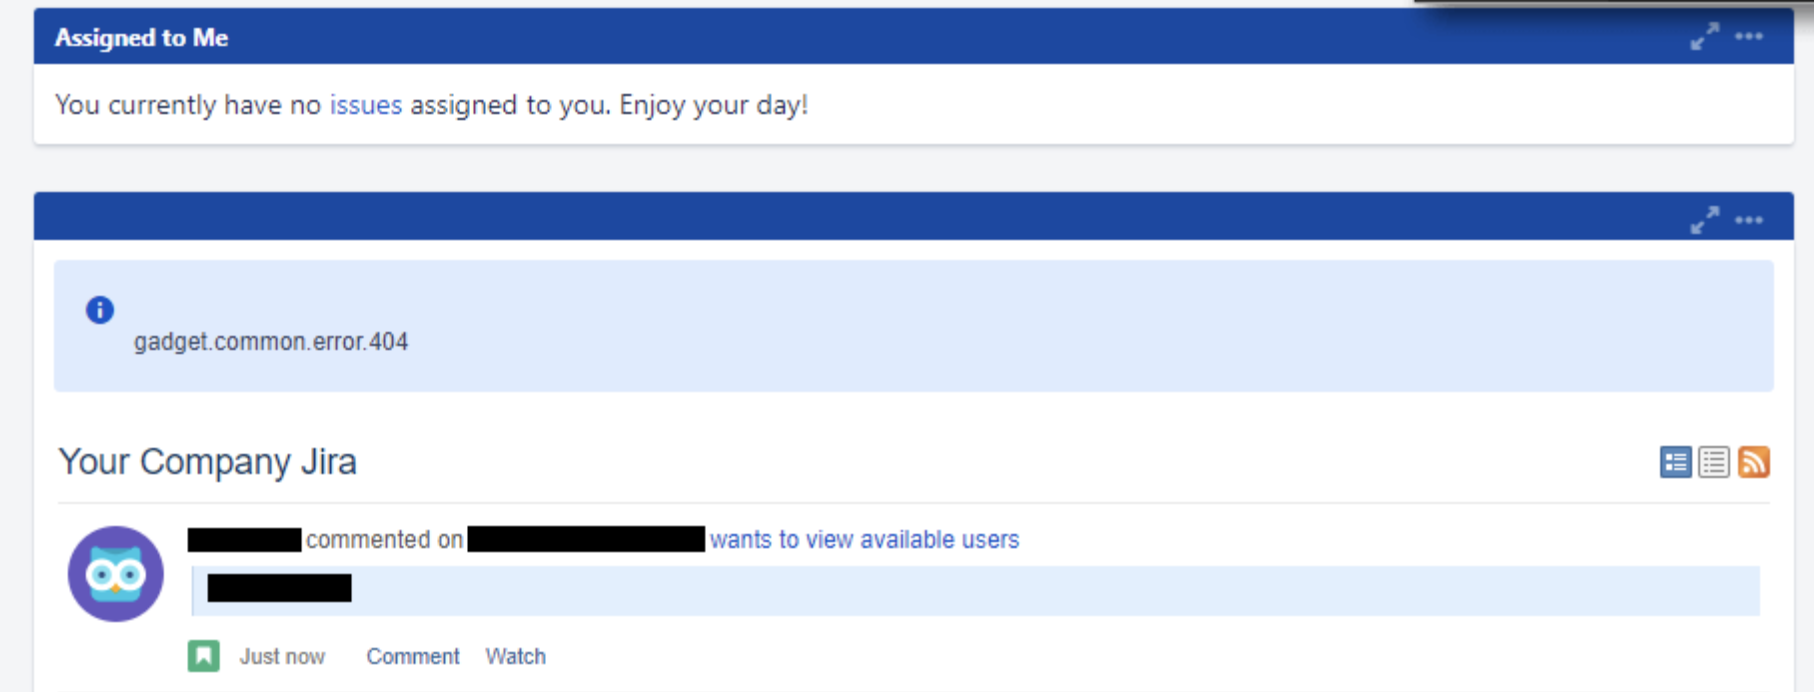
Activity Feed Gadget shows the error message gadget.common.error.404
Platform notice: Server and Data Center only. This article only applies to Atlassian products on the Server and Data Center platforms.
Support for Server* products ended on February 15th 2024. If you are running a Server product, you can visit the Atlassian Server end of support announcement to review your migration options.
*Except Fisheye and Crucible
Summary
Activity Gadget shows the error message gadget.common.error.404 although it is showing feeds from Confluence.
Symptoms
One or more of the following symptoms may be occurring:
- In Jira, the health check diagnostic fails for the Gadgets, however, the gadgets are working;
- Only the Activity feed gadget shows the error message gadget.common.error.404 although it is showing Confluence updates;
- Jira was recently upgraded or migrated to a new server;
- After removing the gadget and adding it back, the gadget title appears as __MSG_gadget.xxxxxx.
Environment
- The application link to Confluence Data Center working fine (Applink links test green);
- AWS environment, using Kubernetes, Docker, Istio (manage network), and Envoy (proxy);
- Cluster nodes are prepared using the same template Yaml.
Cause
Jira fails to communicate with itself due to a Network misconfiguration. The traffic wasn't going through Istio.
Diagnosis
1. Reproduce the issue while collecting the Har file and Http Debug:
a) Go to Jira administration > Logging and profiling, scroll down in the screen, find the link Configure (under Default loggers) and add the package org.apache.http with DEBUG logging;
b) Mark the Logs, indicating something like "TEST START" to signal the time the test is done;
c) Create a dashboard with this gadget only;
d) Enable Developer Tools on the browser, select the Network tab, and clean up the network tab content;
e) Refresh the Dashboard page, so the Network tab will show all the requests;
f) Save the Network tab content as a Har file;
g) Mark the Logs again to signal the end of the test with something like "TEST FINISHED".
h) Disable the logging for org.apache.http to OFF and then create a Support Zip, using the Customized Option and check the box to collect also Tomcat Access Logs.
2. Follow the Request failing from the Har file to the Tomcat Access Logs and Atlassian-Jira.log:
a) Using the har file, identify the node (x-anodeid=jira-0), and the user session (x-asessionid=12i38ak). They will help to follow the requests on Atlassian-jira.log:
x-asessionid 12i38ak
x-anodeid jira-0
x-ausername xxxxx
date Fri, 02 Apr 2021 20:02:28 GMT
server "istio-envoy"
b) Review the requests done by the user session on Atlassian-jira.log, searching for the request that had returned the error 404. The DEBUG org.apache.com will show each request executed for the gadget. Comparing one feed request that had returned HTTP response 200 with the request that received 404, we can observe that the request failing was issued to the own Jira host:
2021-04-02 20:01:38,757+0000 http-nio-8080-exec-1485 url: /plugins/servlet/gadgets/makeRequest; user: xxxxx DEBUG xxxxx 1201x332400x1 12i38ak 111.222.333.444 /plugins/servlet/gadgets/makeRequest [o.apache.http.wire] http-outgoing-7593 << "HTTP/1.1 404 Not Found[\r][\n]"| Confluence | Jira | ||
|---|---|---|---|
| >> | GET /plugins/servlet/streams?use-accept-lang=true&authOnly=true&local=true&maxResults=5&xoauth_requestor_id=jhunt HTTP/1.1[\r][\n] | >> | POST /rest/webResources/1.0/resources HTTP/1.1 |
| >> | Host: confluence.com:8081 | >> | Host: myjira.com |
| >> | Connection: Keep-Alive | >> | Connection: Keep-Alive |
| >> | User-Agent: Apache-HttpClient/4.5.13 (Java/1.8.0_282) | >> | User-Agent: Apache-HttpClient/4.5.13 |
| >> | GET /plugins/servlet/streams?use-accept-lang=true&authOnly=true&local=true&maxResults=5&xoauth_requestor_id=jhunt HTTP/1.1[\r][\n] | >> | POST /rest/webResources/1.0/resources HTTP/1.1[\r][\n] |
| << | HTTP/1.1 200 [\r][\n] | << | HTTP/1.1 404 Not Found[\r][\n] |
3) If needed, collect AWS Load Balancer/envoy access logs to observe if Jira requests to itself are going through the Proxy:
a) If it is not possible to capture the Envoy logs, follow the instructions from Getting Envoy's Access Logs to enable the access.log capture;
b) Reproduce the issue;
c) Verify the request in the access-logs:
- Is the URL exactly the same (URL encoding issues)?
- Is the header content equal (the entities and their values)?
- Is the target host of the request correct?
4) Docker configuration
a) Run the command Docker inspect to gather detailed information on Docker objects such as docker images, containers, networks, and volumes:
docker inspect <container name>
b) Get the running network names:
docker network ls*
c) Get the containers in this network:
docker network inspect NETWORK_NAME
d) Look for the "Containers" keyword in the JSON, which is a list of connected devices, and search for the instance with the IPv4 address (for instance, "IPv4Address": "127.0.0.11/24"). The "Name" key is the DNS name.
Check if the DNS is being resolved to the correct IP address.