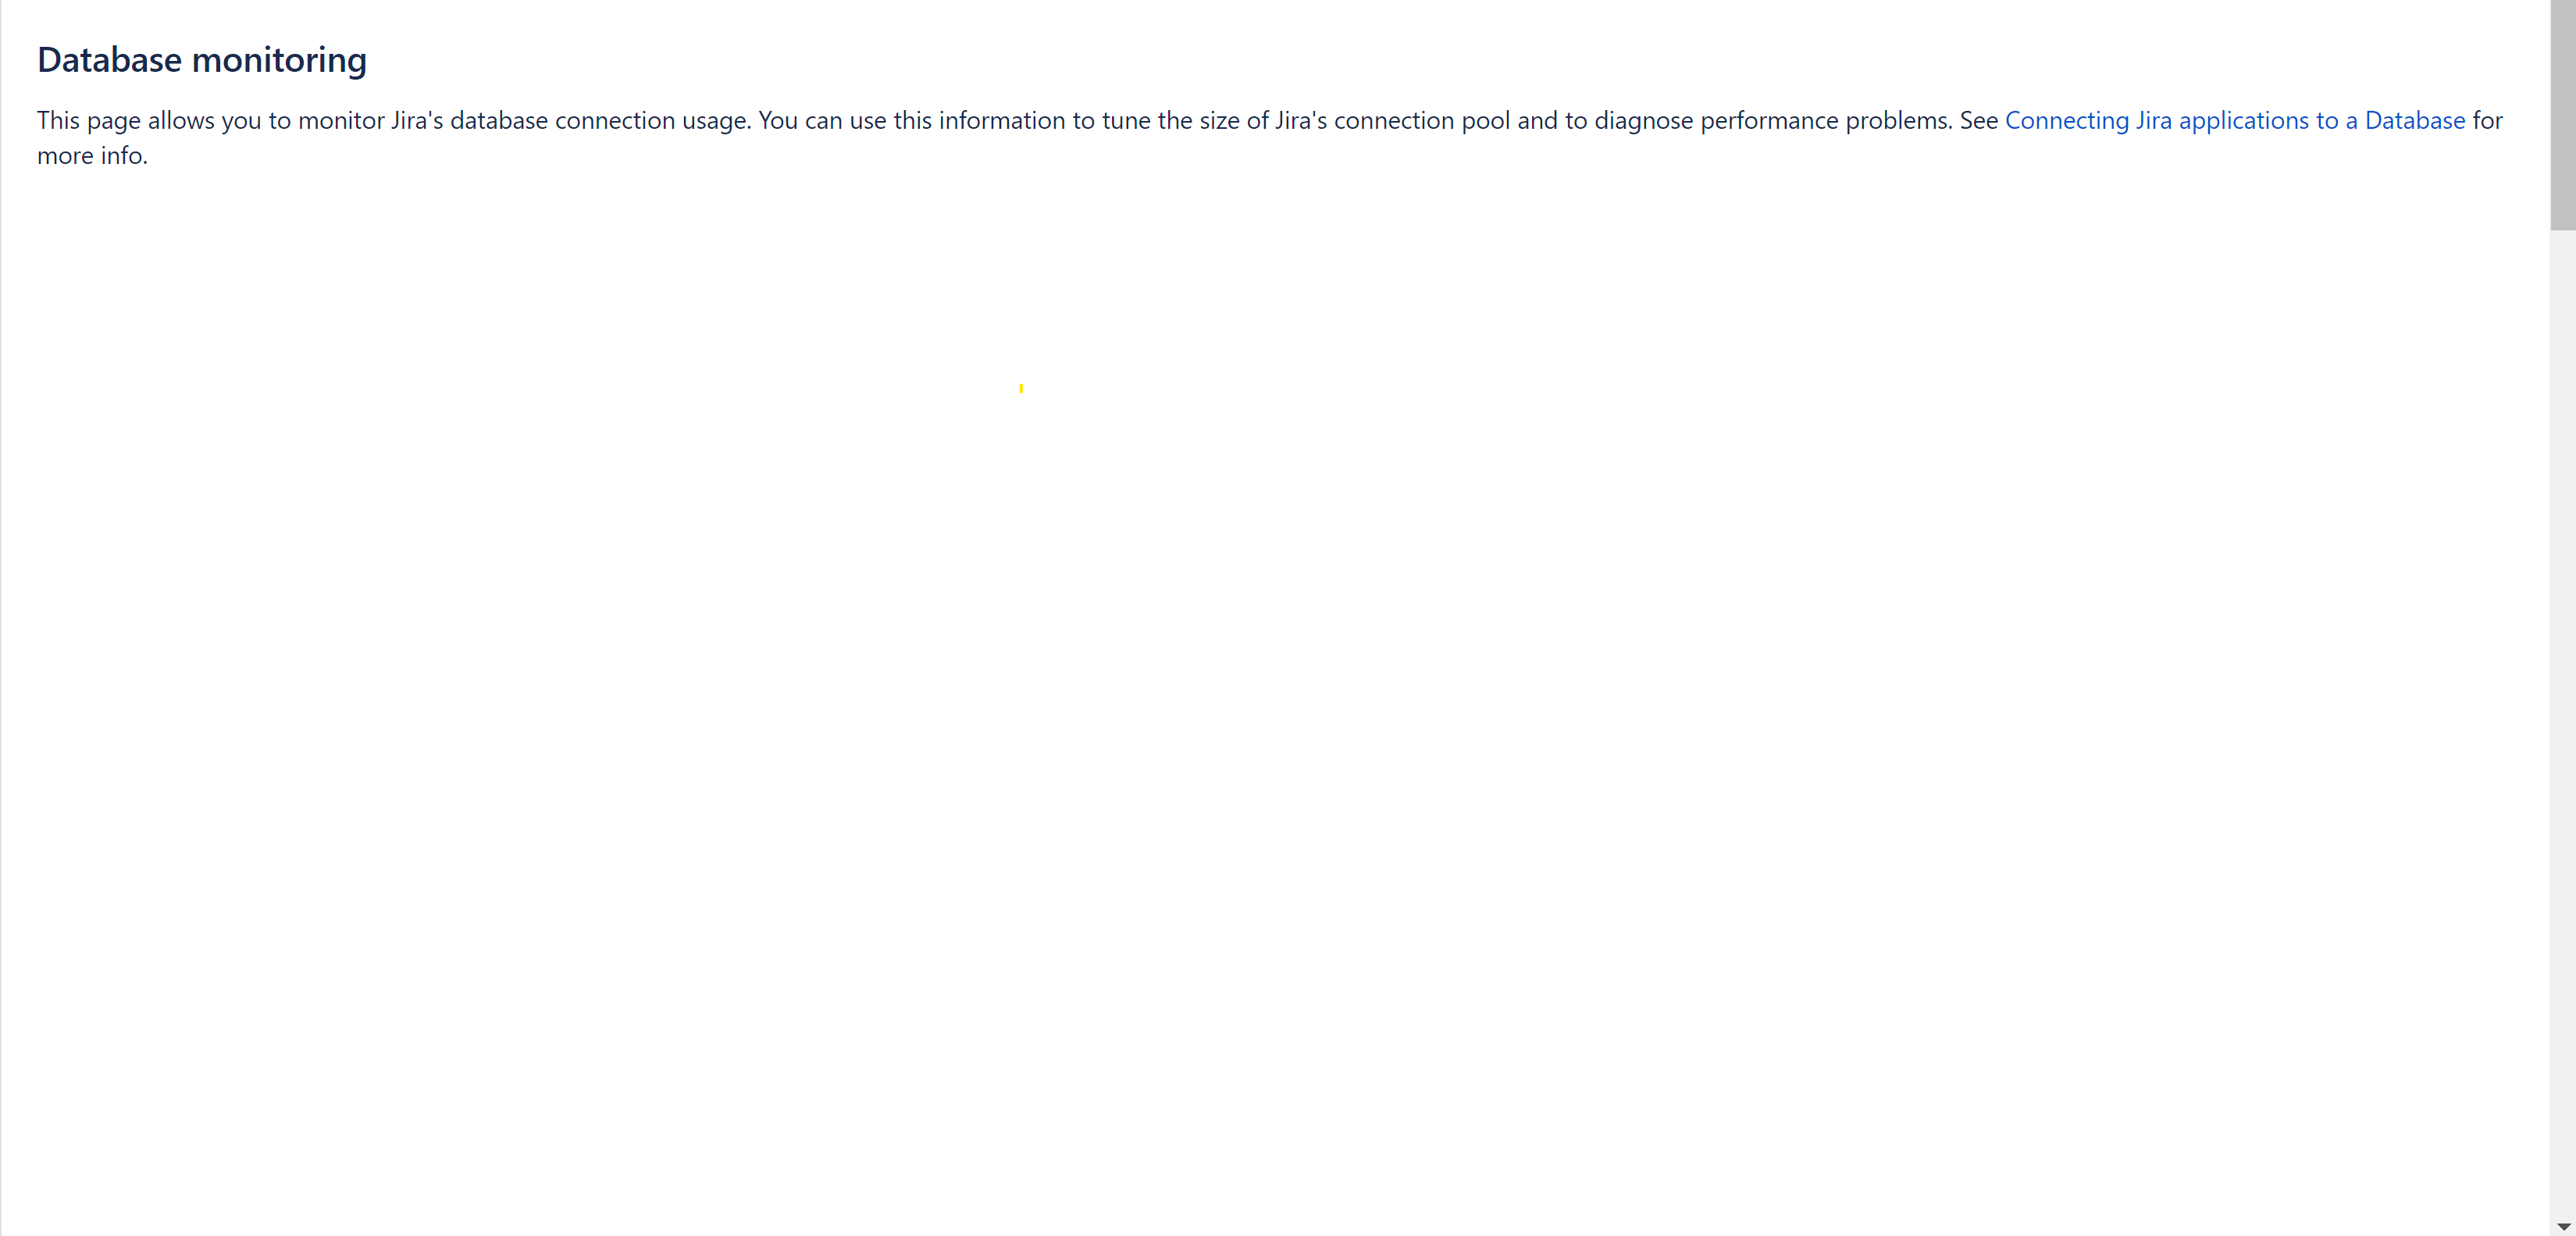
Database monitoring page of Jira not showing any data
Platform notice: Server and Data Center only. This article only applies to Atlassian products on the Server and Data Center platforms.
Support for Server* products ended on February 15th 2024. If you are running a Server product, you can visit the Atlassian Server end of support announcement to review your migration options.
*Except Fisheye and Crucible
Summary
DB monitoring page does not contain any data or is blank.
Environment
8.20.11
9.7.0
9.17.1
Diagnosis
- When opening the Monitoring database connection usage page, the graphs are empty:
Jira uses rrd4j for DB monitoring; if there is a problem with the files or permissions, the above issue arises.
Solution
Make sure Jira has proper access to the .rrd4j files located under /$JIRA_HOME/monitor directory
If permission is properly set, it is possible the files are damaged. To resolve this, rename the files and restart Jira.
- New files will be created and the information should appear properly:

