Working with reports
In Assets, you can create reports to visualize your object schema in a variety of formats. Once your report is ready, you can share it with other users, export it to a file, print it or add it to your Jira dashboard for easy access to your data. The data in your reports is automatically updated in regular intervals, so you always have an up-to-date view of your assets.
Report types
Here are all report types that you can create in Assets:
Attribute value count report
A pie chart showing how the objects of an object type are distributed based on attributes.

Attribute value report
A chart showing attribute totals reported for one or more objects of a specific type.

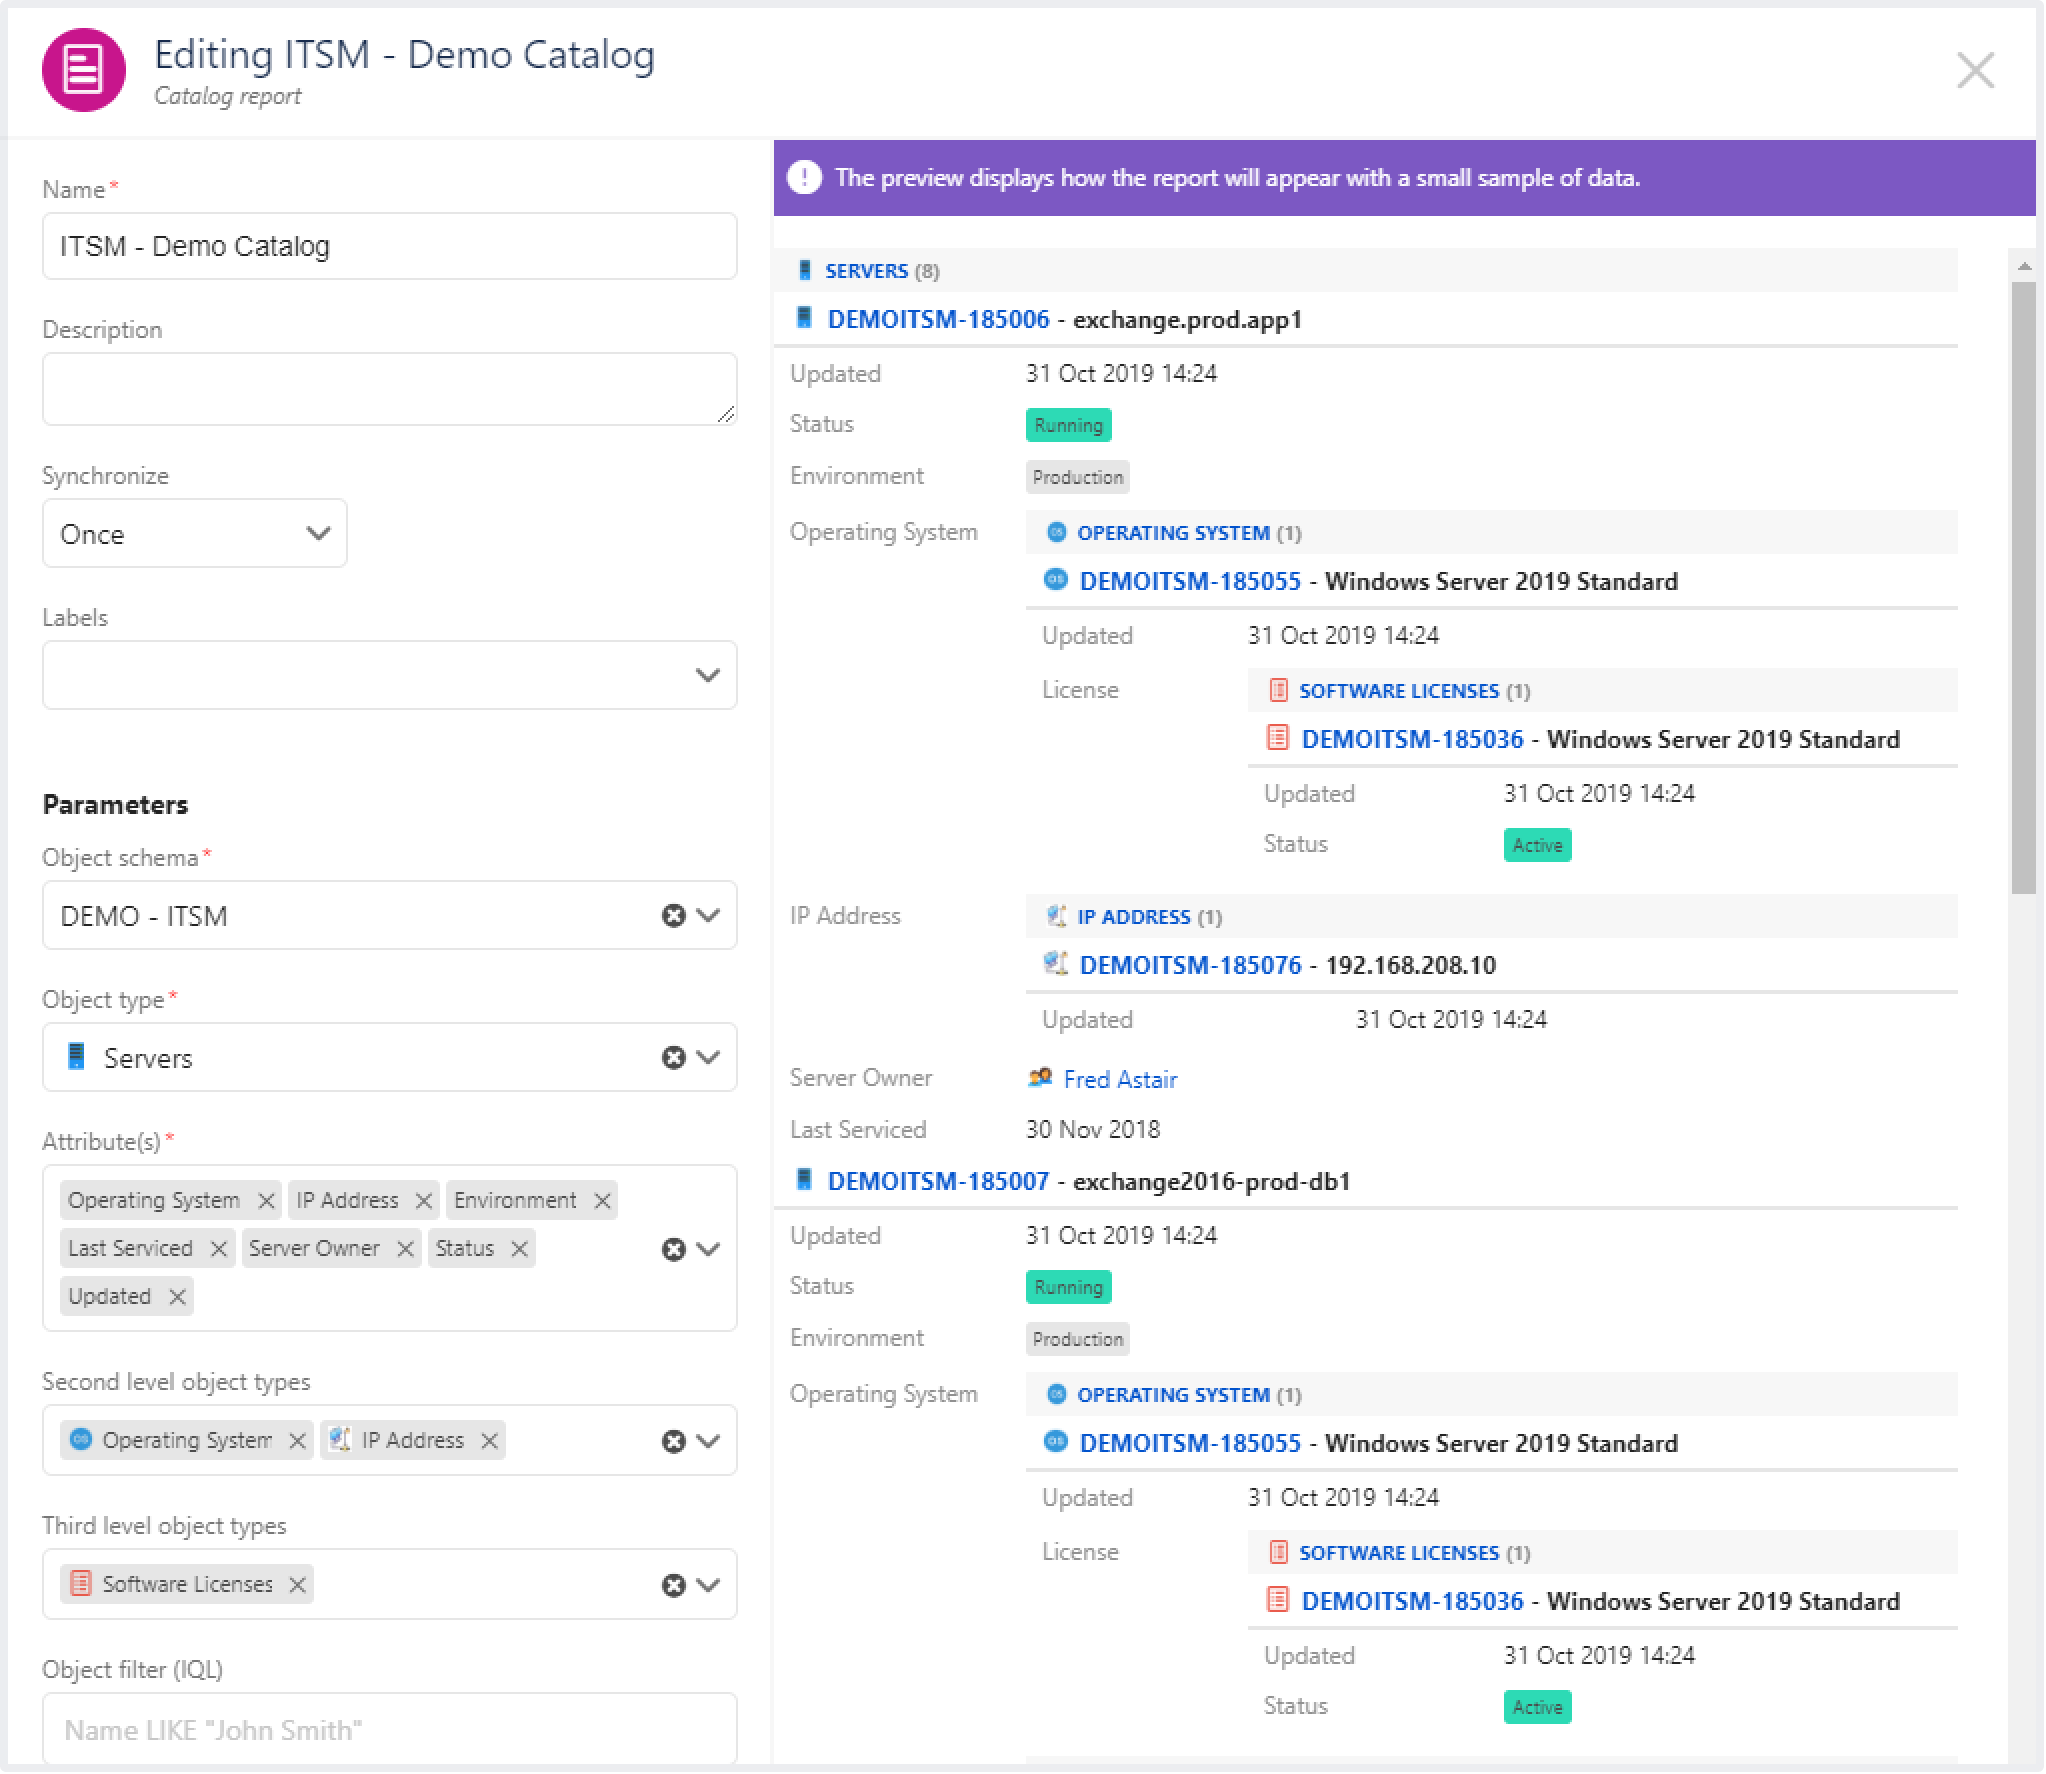
Catalog report
A catalog of objects and their attributes.
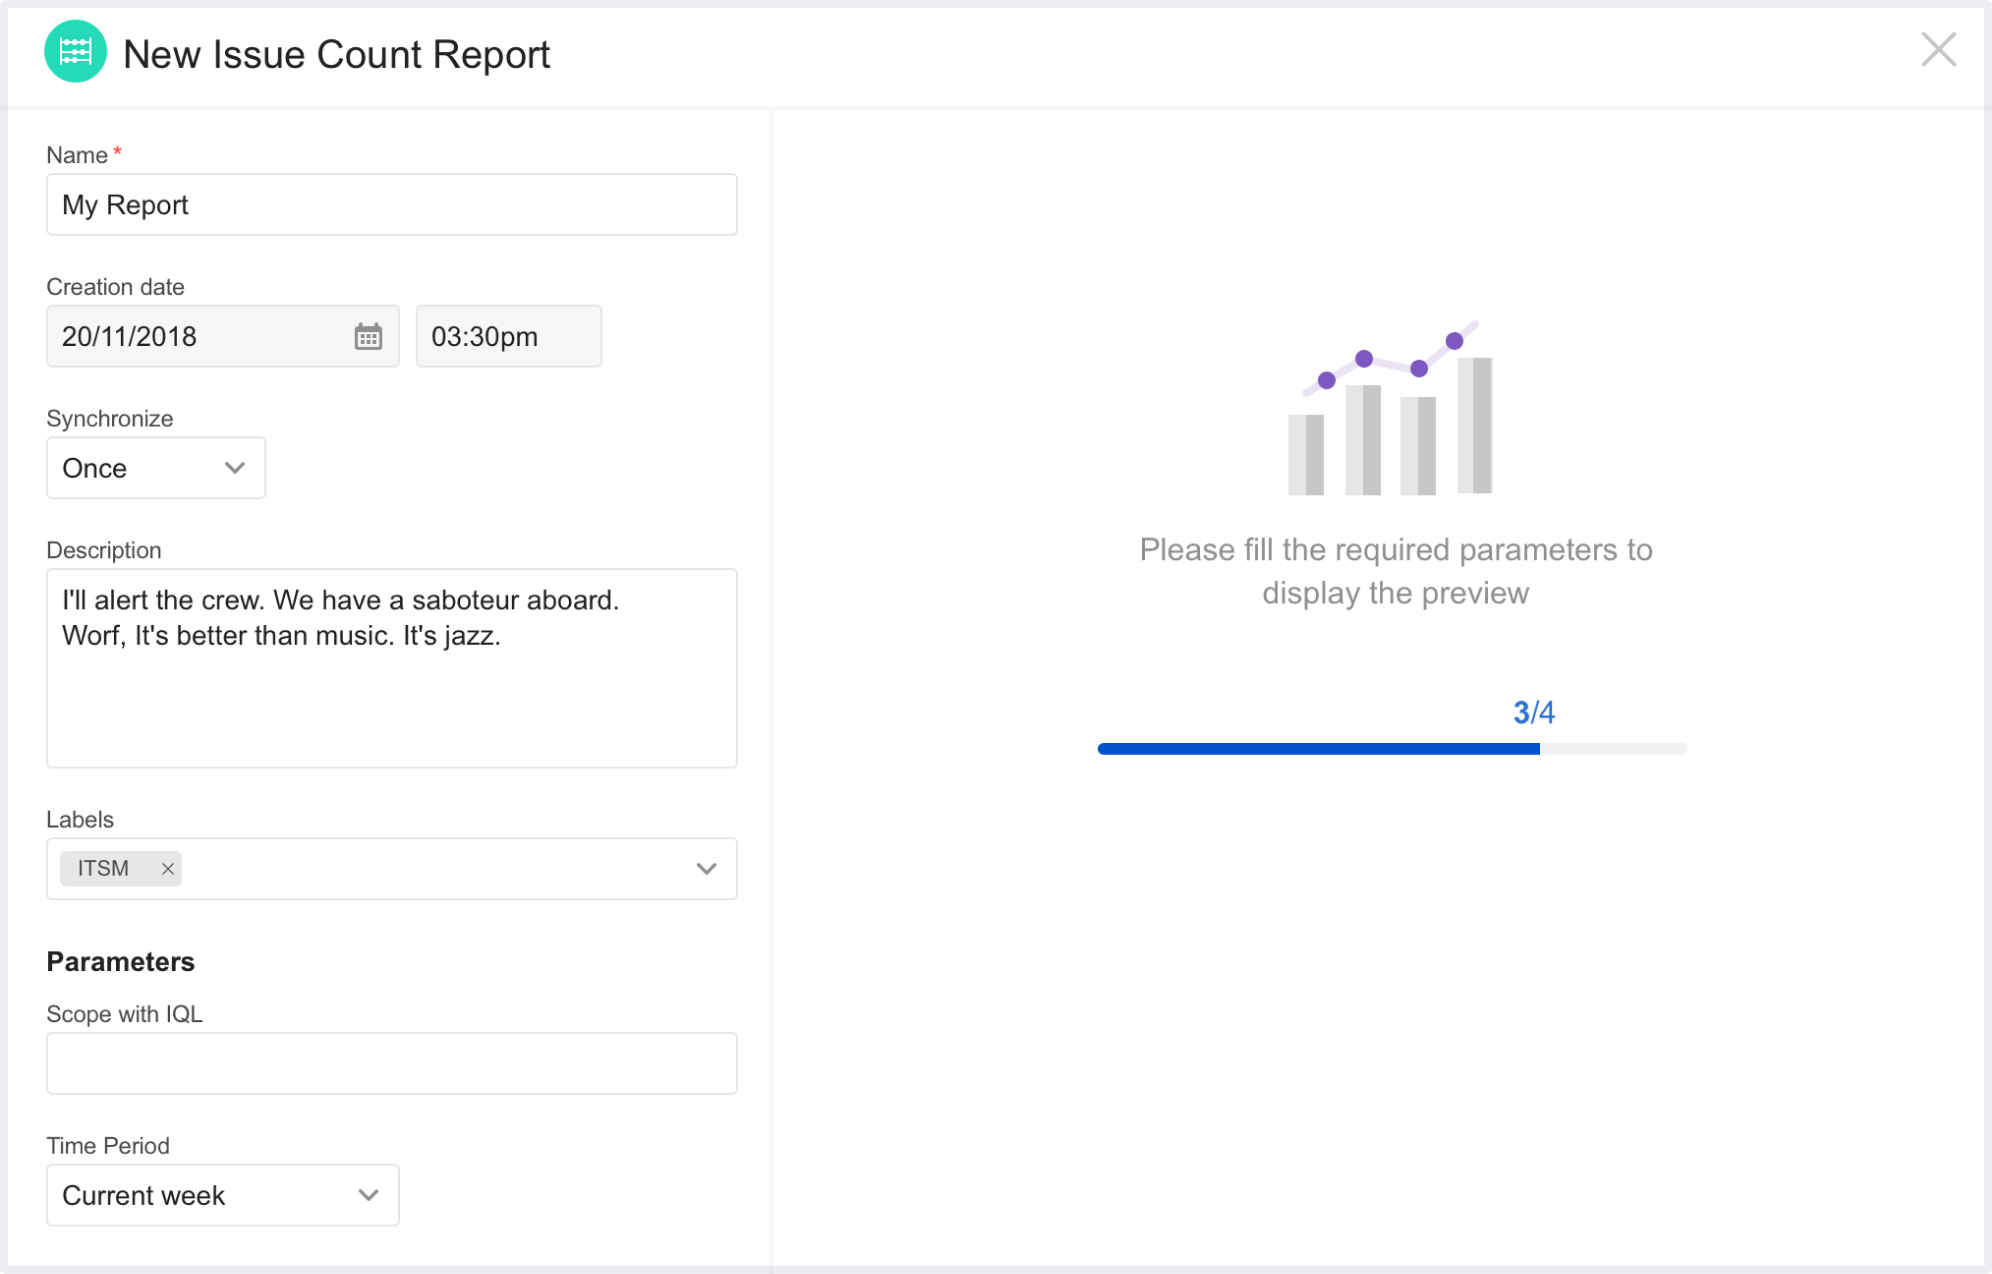
Issue count report
A line or bar chart showing historical totals of issues reported for one or more object types or objects.
Map report
A world map showing the location of objects based on an attribute with geographical data. The objects must have a text attribute with a comma-separated latitude and longitude, for example -33.8,151.2 (Sydney).

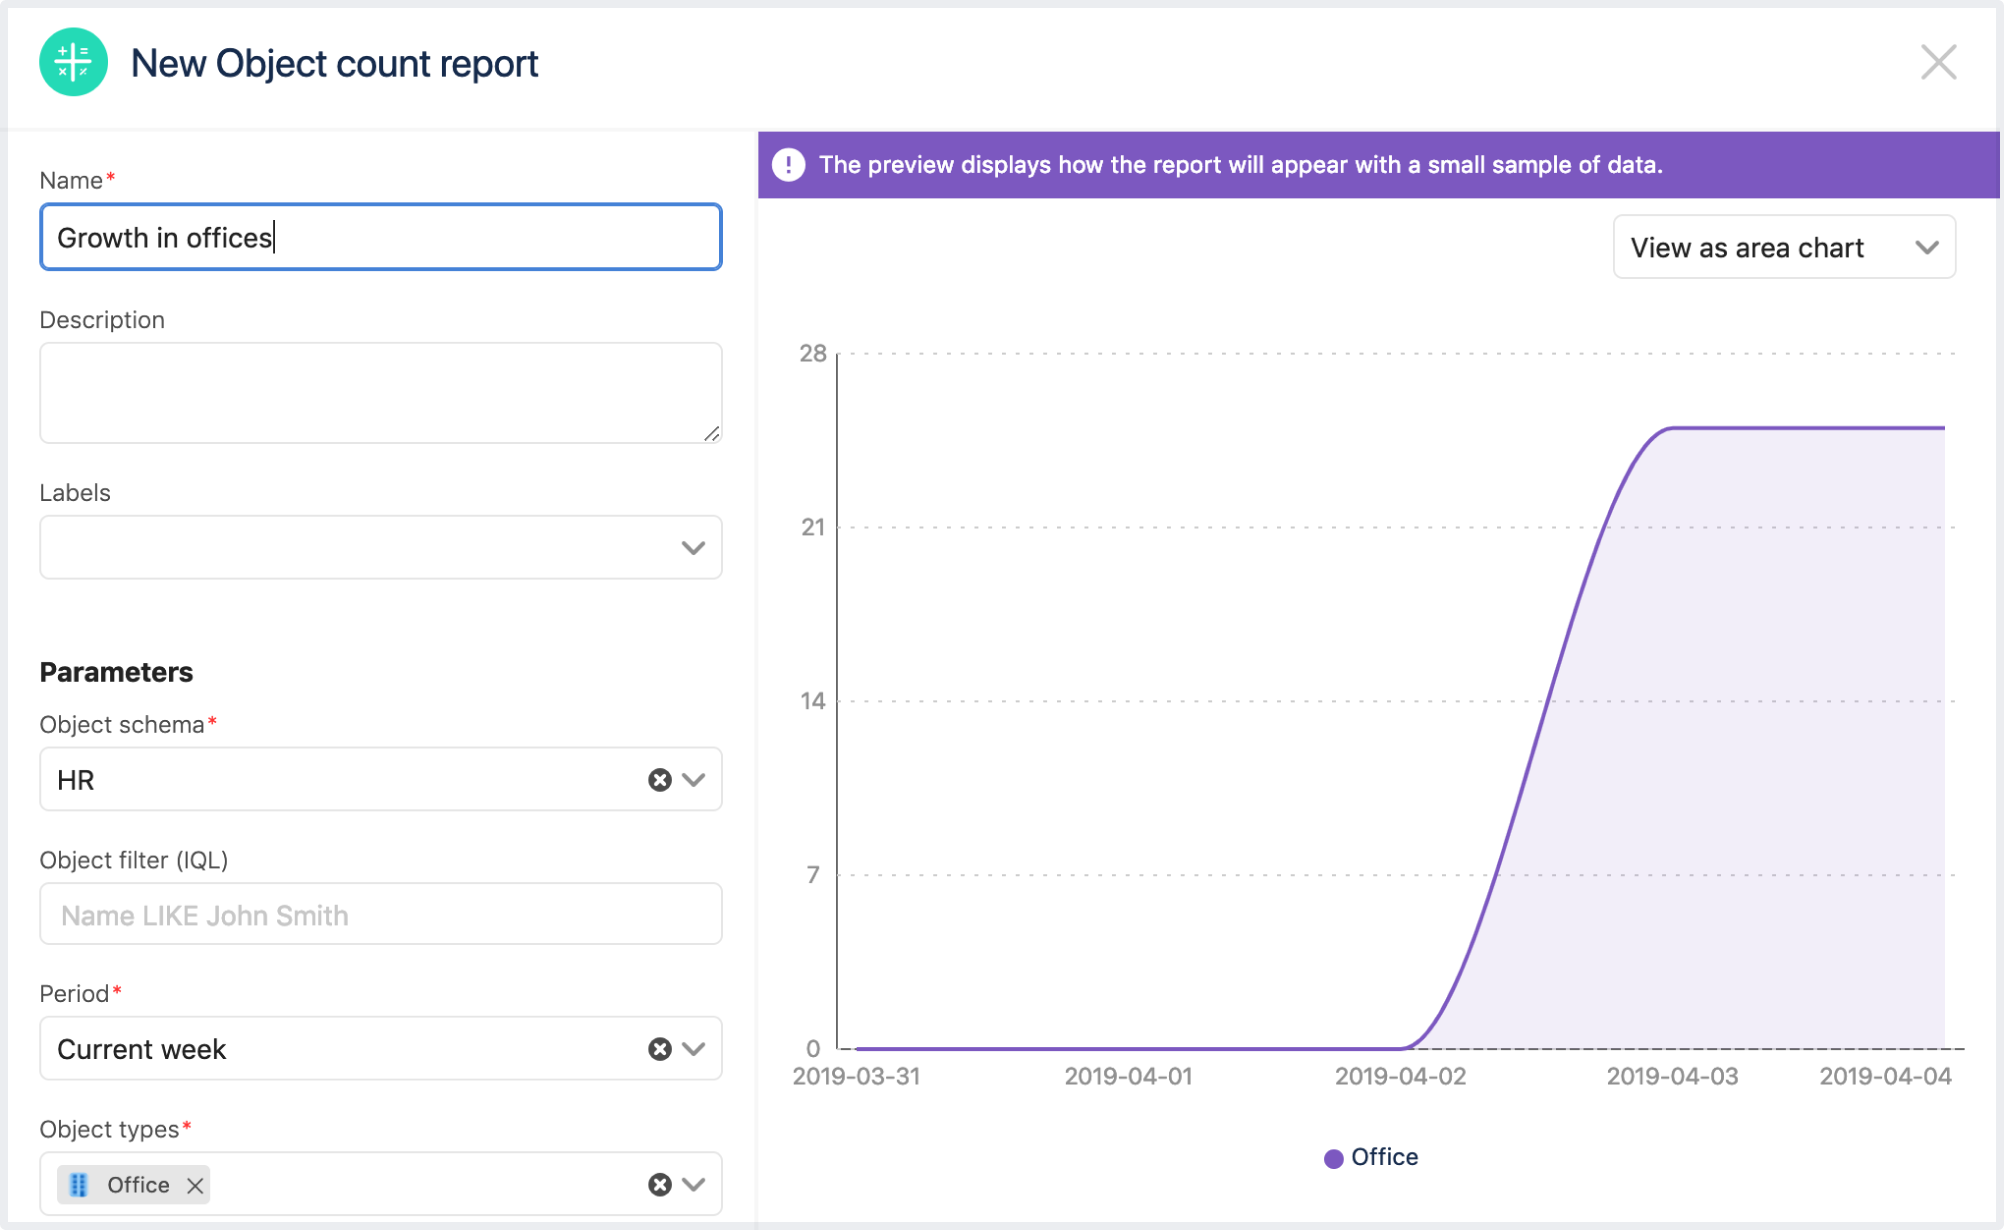
Object count report
A line chart showing historical totals of objects for one or more object types.
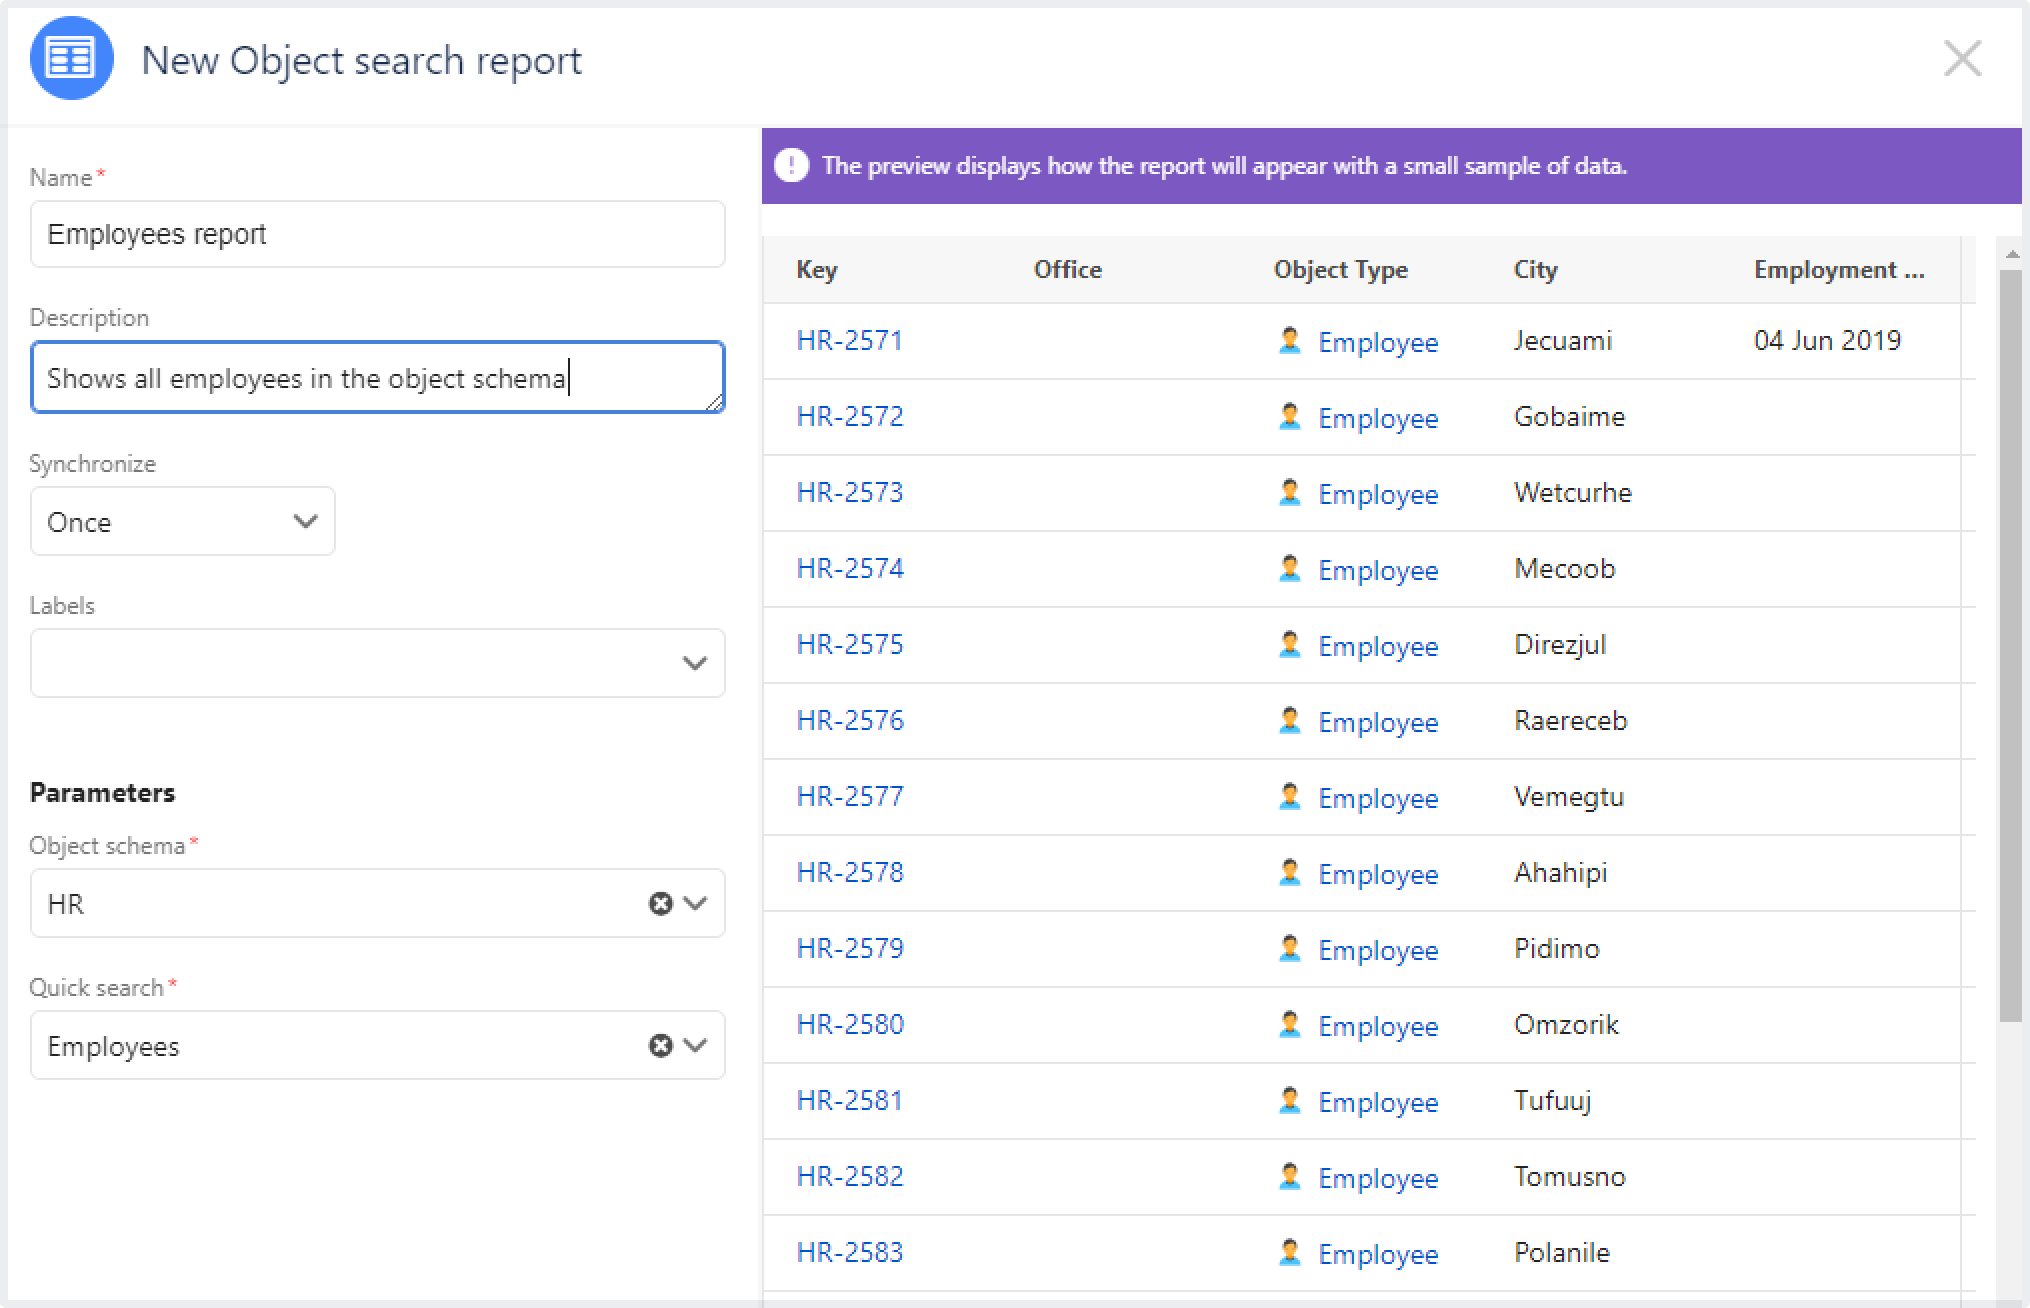
Object search
A table showing the objects of an object type and their attributes. This report is based on a saved quick search (filter) from the Assets Object Search View. When you open an object search report, you can select the Quick search link to view the filter that generates the table.
Payroll report
A chart showing payroll expenditures.

Two-dimensional report
A table showing the objects of an object type and their attributes.

User report
A table showing the total of one or more objects assigned to one or more users.

Creating a report
To create a report, you must have access to the object schema and object type that your report will contain.
- In the top navigation bar, select Assets > Reports.
- Select New Report.
- Select a report type.

- Give your new report a name, select how frequently you want to refresh the data in your report, and select the required parameters. Optionally, you can also add labels and a description to your report.
- Select Generate preview to see a preview of the report or select Create to generate the report.
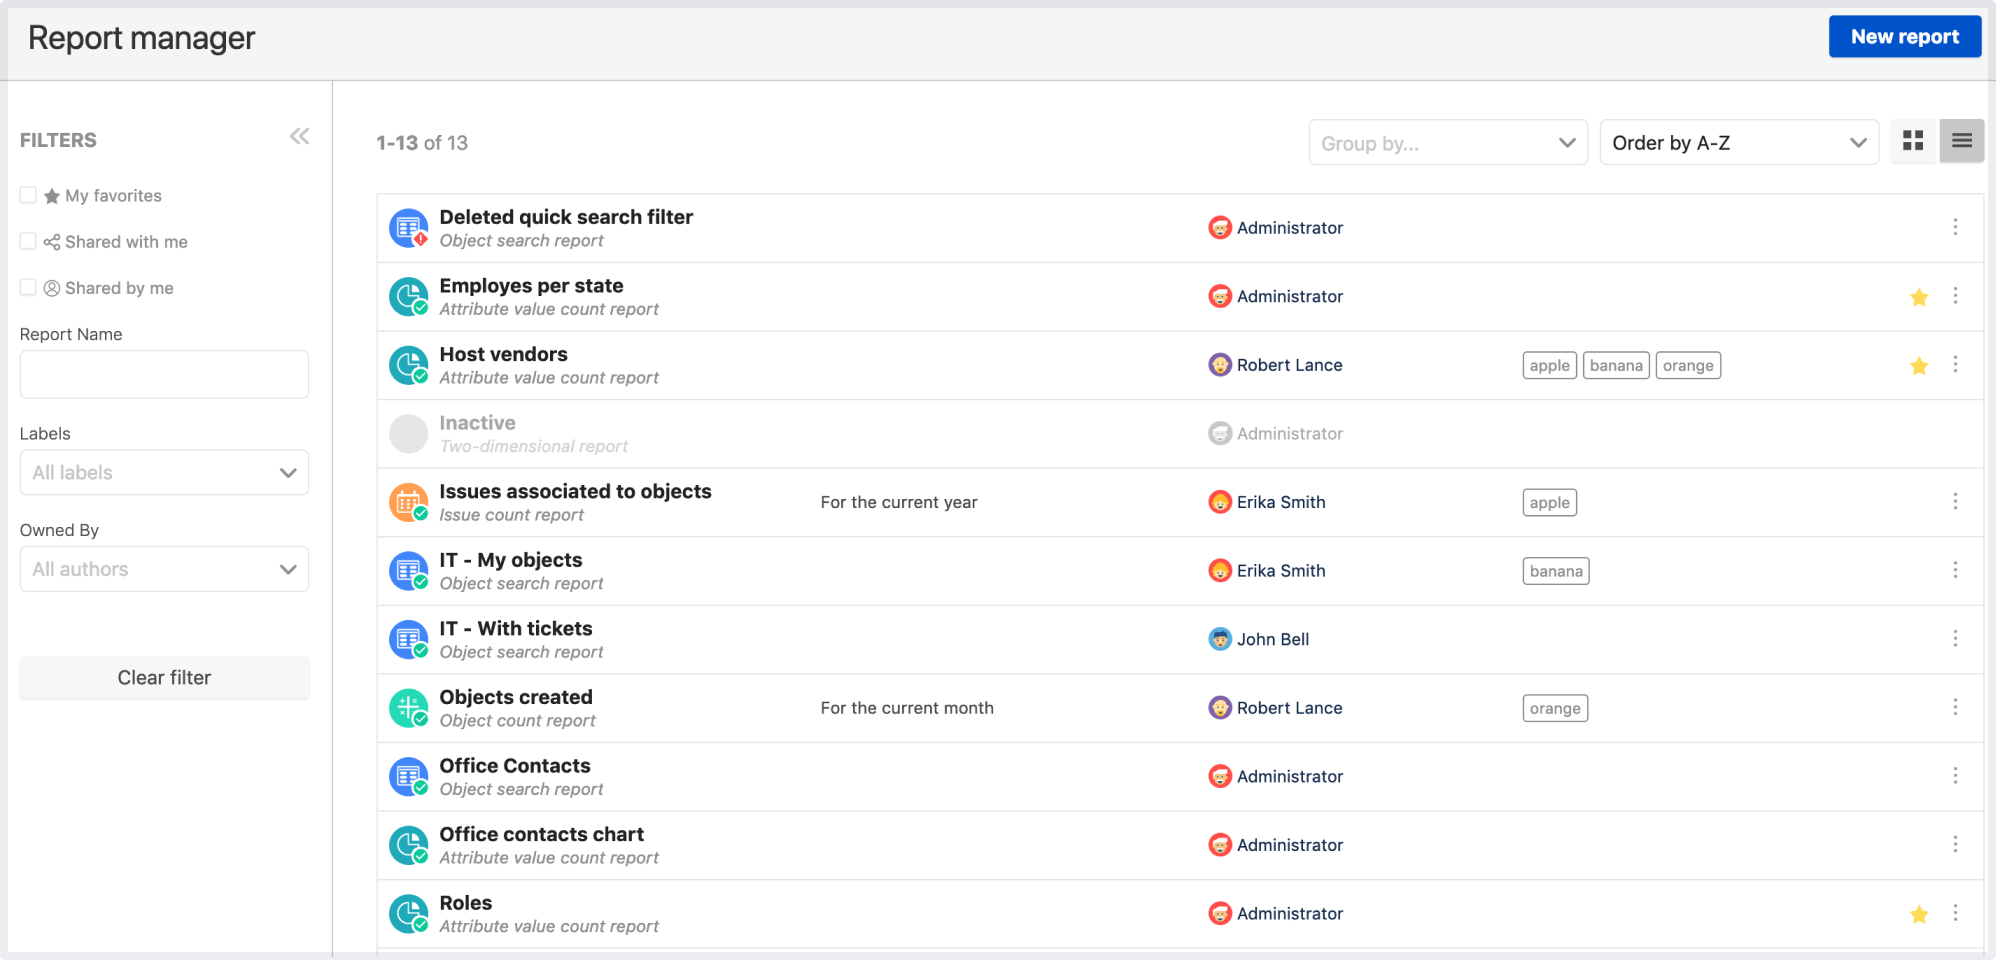
Once you start creating reports, they'll appear in the Report manager. This is where you can order and filter them, or do many other things, such as printing, sharing, and syncing your reports. To see the list of available actions for your reports, select More options next to each report. To learn more about each available option, see Working with reports in the Report manager.
Working with reports in the Report manager
Your reports (as well as reports that have been shared with you) are stored in the Report manager. In addition to viewing the reports, you can also perform actions such as editing, printing or sharing reports with other users. To open the Report manager, in the top menu go to Assets > Reports.
To edit a report, select More actions ![]() > Edit next to the name of the report you want to edit.
> Edit next to the name of the report you want to edit.
You can change any of the parameters of your report. When you’re done, select Generate preview to see a preview of your updated report or select Update to immediately save your changes.
To print your report, select the report you want to print. In the dialog, select More actions ![]() > Print.
> Print.
The visibility of the data in the reports you share is based on your own permissions. This means that the people or groups your share a report with will be able to see the data, even if they don’t have access to the object schemas or object types included in your report.
To share a report, select More actions ![]() > Share next to the name of the report you want to share.
> Share next to the name of the report you want to share.
- In the dialog, select the name of a user or group.
- Select the permissions you want to give to the user or group:
- View - users or groups you share the report with can only view this report.
- Edit - users or groups you share the report with can view and edit this report.
- Delete - users or groups you share the report with can view, edit, and delete this report.
- Select Add. Repeat this process to add more users or groups.
- When you’re ready to share, select Share.
The data in your report is updated automatically based on the frequency you selected when you created your report. You can also update the data in your report manually, instead of waiting for a scheduled update.
Updating the data may take several minutes, or longer, depending on the amount of data in your report.
To update data manually, select More actions ![]() > Resync next to the name of the report you want to synchronize.
> Resync next to the name of the report you want to synchronize.
To add a report to your favorites, select Add to favorite ![]() next to the name of the relevant report.
next to the name of the relevant report.
To delete a report, select More actions ![]() > Delete next to the name of the report you want to delete.
> Delete next to the name of the report you want to delete.
Displaying a report on your Jira dashboard
To display a report on a Jira dashboard, add an Assets Widget to your dashboard. Learn more about configuring your dashboard.
- In the top menu, select Dashboards > (name of your dashboard).
- Select Add gadget.
- In the dialog, search for Assets Widget and select Add gadget. If you don’t see Assets Widget, select Load all gadgets.
- Configure your gadget:
- Widget: select the report you want to display.
- Refresh interval: select how frequently you want to refresh the report.
- Select Save.
Viewing audit logs related to reports
To view audit logs, you must be logged in as a user with the Jira Administrators or Jira System Administrators global permission.
Some user activities surrounding Assets reports are tracked in the Jira audit log. If you’re a Jira admin, you can see who viewed, printed or shared reports.
Learn more about auditing in Jira.
See all audit logs used for Assets reports.