How to monitor Fisheye Crucible using JMX in Linux
Purpose
See real time operating data from your Fisheye/Crucible instance. For example, if you want to determine the number of repositories open in memory monitor the activeCount variable.
Other variables:
Attribute name | Values | ||||||||||||||||||||||||
|---|---|---|---|---|---|---|---|---|---|---|---|---|---|---|---|---|---|---|---|---|---|---|---|---|---|
PassivationStats |
|
What is JMX?
JMX (Java Management eXtensions) is a technology for monitoring and managing Java applications. JMX uses objects called MBeans (Managed Beans) to expose data and resources from your application.
Solution
The JMX interface allows you to see live internal information from your Fisheye/Crucible instance, via the following MBean:
com.atlassian.fisheye.rep.PassivateMXBean
Enable JMX in Fisheye/Crucible
Add the following options to your FISHEYE_OPTS environment variable and restart Fisheye/Crucible:
-Dcom.sun.management.jmxremote -Dcom.sun.management.jmxremote.port=8061 -Dcom.sun.management.jmxremote.authenticate=false -Dcom.sun.management.jmxremote.ssl=false -Djava.rmi.server.hostname=<FishEye server FQDN>Using a JMX Client
You need to use a JMX client in order to view the JMX output from Confluence. JConsole is a readily available JMX client that is included with the supported Java Developer Kit (version 5 onwards).
- Open JConsole and select Remote Process
- Specify the hostname of server and the port that JMX is running on, ie.
fisheyeserver.company.com:8061 - Click Connect
When prompted, click the Insecure button
Enable Jetty JMX MBeans
In case you want to extend the monitoring to Jetty and enable JMX for the Jetty MBeans it is possible to add one extra parameter to the FISHEYE_OPTS environment variable to enable that:
-Dfisheye.jetty.jmx.enable=trueThe full content of the FISHEYE_OPTS in this case will be the following:
-Dcom.sun.management.jmxremote -Dcom.sun.management.jmxremote.port=8061 -Dcom.sun.management.jmxremote.authenticate=false -Dcom.sun.management.jmxremote.ssl=false -Djava.rmi.server.hostname=<FishEye server FQDN> -Dfisheye.jetty.jmx.enable=trueIf this option is enabled, at restart, Fisheye/Crucible will show the following extra log line:
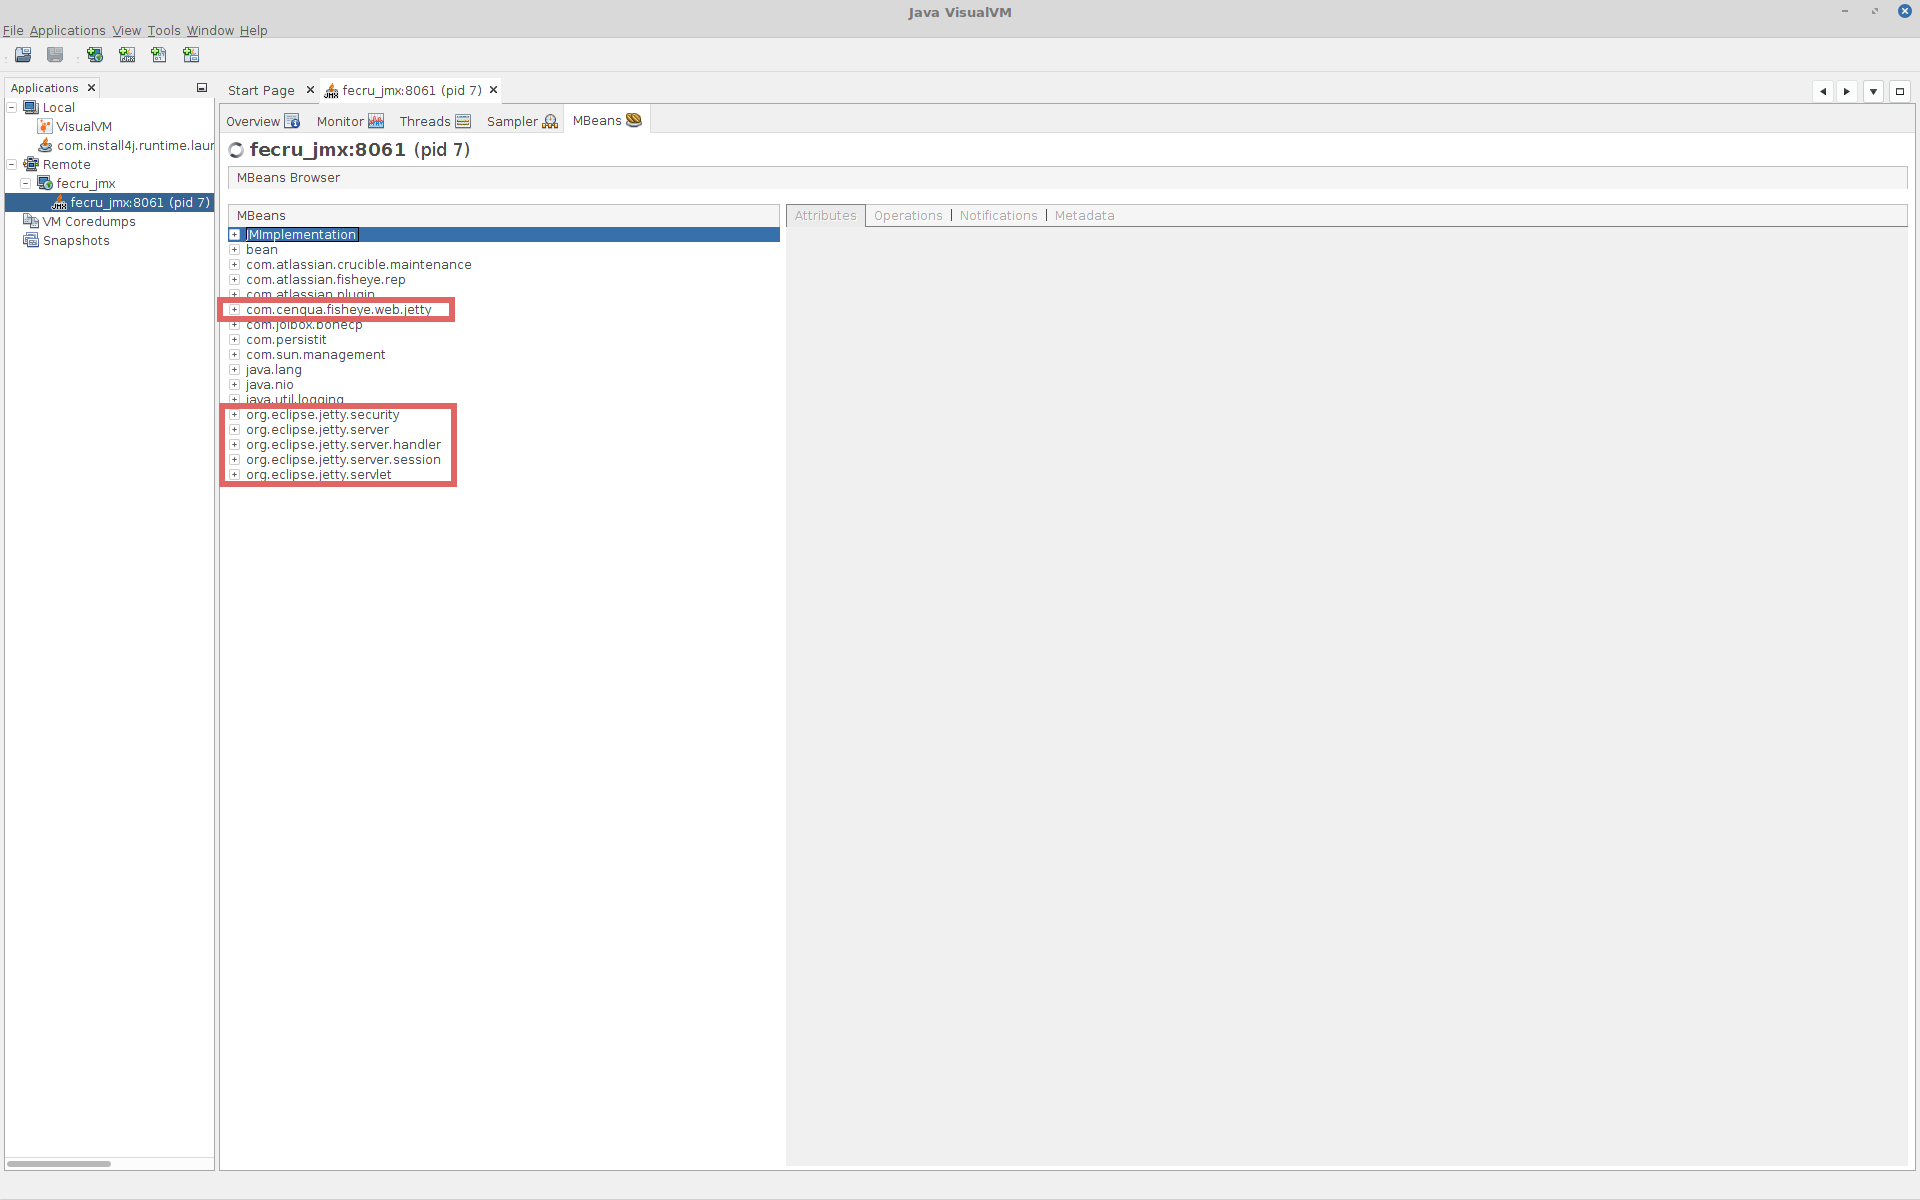
2018-03-12 10:50:02,963 INFO - System property fisheye.jetty.jmx.enable set to value: trueWhen enabled you will see extra MBean available in your JMX client. Below an example of the MBean available on VisualVM: