5 steps to a killer JIRA dashboard
Is your team agile? Check out our agile dashboard guide in the JIRA Software space!
Imagine walking into a status meeting knowing things are on track before anyone says a word. Or coming back from vacation and seeing detailed project updates from a quick glance, before even checking email. This could be you!
And what about when things (inevitably) go wrong? You want to know the moment the items on your team's to-do list start increasing faster than your ability to get 'em done. You want to be able to demonstrate which team members are critical to your project's progress before they're poached by another team.
So let's create a killer JIRA dashboard that helps you keep an eye on progress and identify bottlenecks ahead of time:
Step 0: Create a new JIRA dashboard
Go to Dashboards > Manage Dashboards > Create New Dashboard. Give your dashboard a unique name that you can remember easily (kinda like choosing a password, but lower-stakes).
Step 1: Add these five gadgets
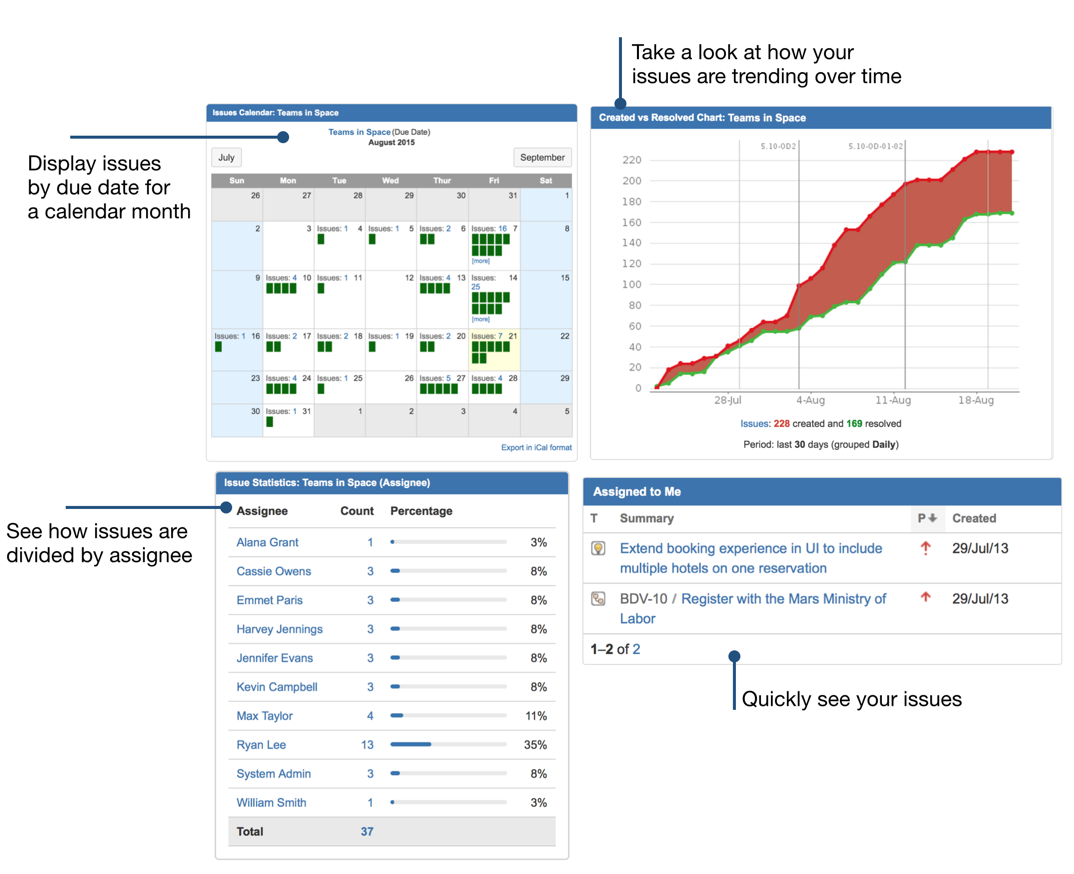
Start with the bare necessities. We'll put the team's overall workload, incoming tasks, work split by team member and due date, and high-risk issues front and center on your JIRA dashboard. Add:
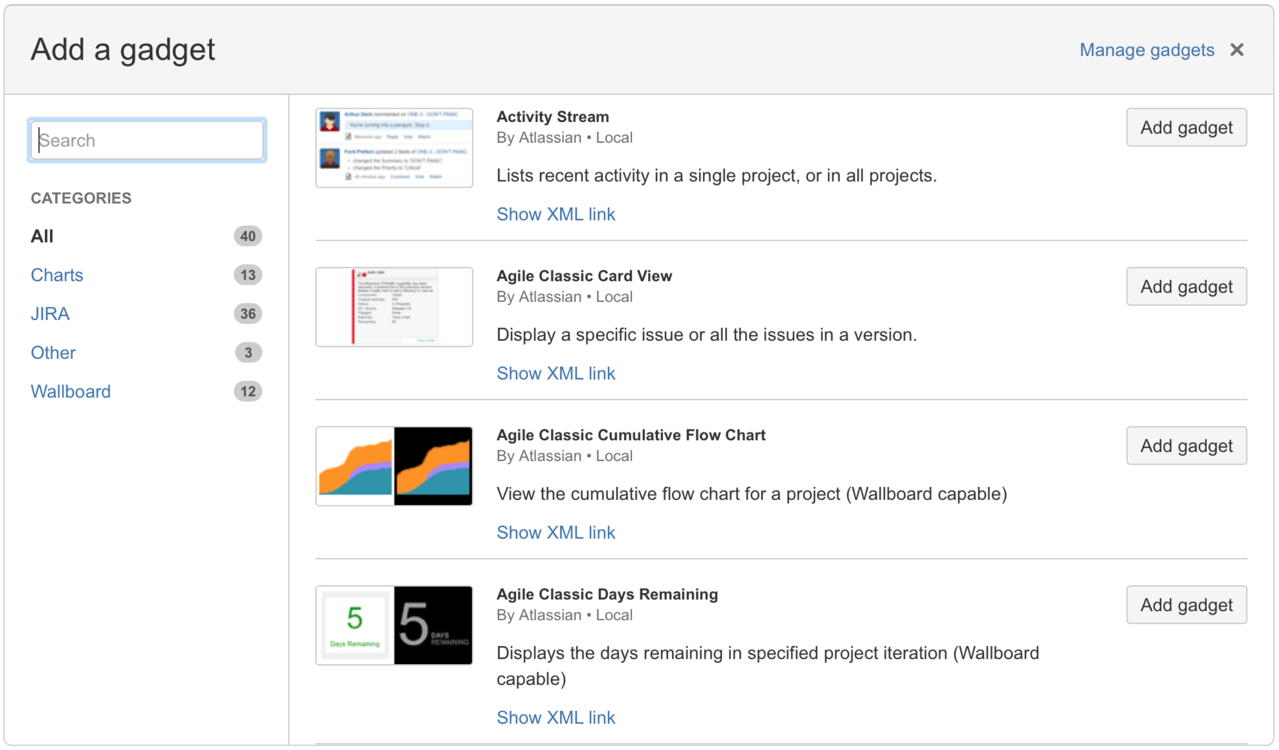
- Filter Results (add this one twice)
- Created vs Resolved Chart
- Assigned to me
- Issue Statistics
- Issues Calendar (see note below)
Once you've added all five, close the dialog. You can drag and drop the gadgets to change where they're placed on the dashboard at any time. For now, though, let's just get the gadgets themselves set up.
Pro tip
Avoid dashboard blindness! When you start with too much information, it's like highlighting every sentence in the entire book. Start small, then tweak and evolve your dashboard over time.
Step 2: View your team's workload at-a-glance
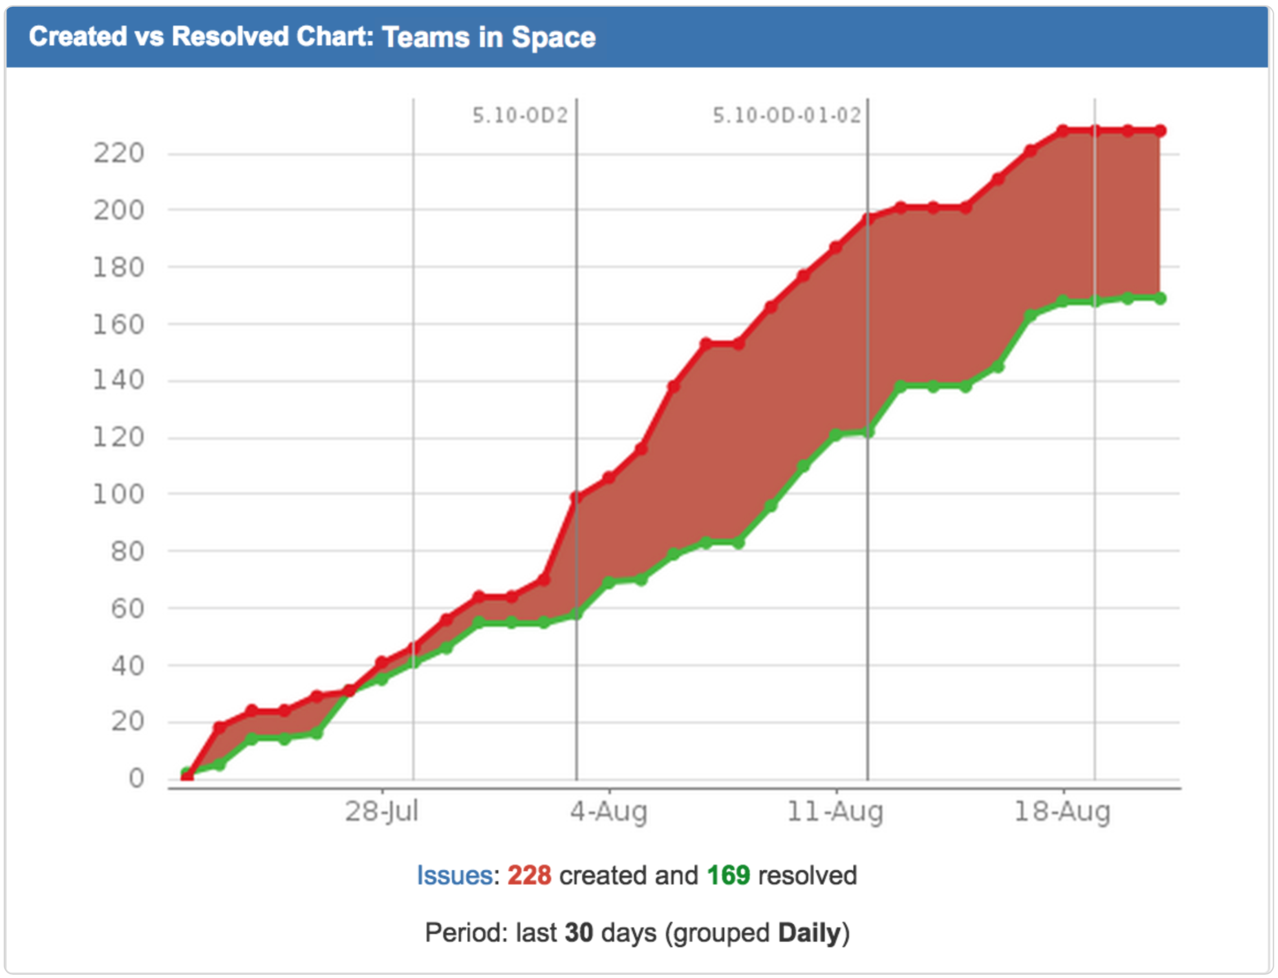
Every morning you come in with a "feeling" about how things are going. Is your team crushing it? Keeping pace? Drowning? Use the Created vs. Resolved gadget to reaffirm your hunch every time you glance at the JIRA dashboard.
The Created vs. Resolved gadget gives you a quick view of the number of issues assigned to your team as compared to the number of issues being completed.
- To keep things simple, configure this gadget to show just one project (we'll stick with this same project for the entire dashboard), and leave the other fields with the default selections.
- Click Save and you'll see an aggregated view of where your workload is trending.
Step 3: Spot bottlenecks & problems ahead of time
Who's carrying the weight?
How much work will be pushed back if a team member calls in sick? What if someone gets pulled in to help on a side project?
You need to know which team members have a larger workload, so you can demonstrate who is critical to your project and maintain a backup plan. A visual indication of workload per person is critical to keeping a handle on team progress.
- For the first Issue Statistics gadget, pick the same project as above (find project via Filter field), and select Assignee from Statistic Type to compare stats by assignee.
- Set Show Resolved Issue Statistics to No, because resolved issues aren't going to affect future progress.
- Click Save.

What's due soon?
Naturally, some aspects of your project are more pressing than others, and it's up to you to keep your team working on the right parts at the right time. Visualizing your workload by due date will let you see where (and when!) your team needs to invest extra energy so your project hits its milestones on time. The JIRA Issues Calendar plugin is meant just for this.
If you're a JIRA Cloud user, you're in luck: the plugin comes pre-installed. If JIRA is hosted on your company's own network, you're still in luck: this plugin is free, maintained by Atlassian, and is compatible with JIRA Data Center. Ask your JIRA admin to add it using the Universal Plugin Manager, or grab it from the Atlassian Marketplace
Ok. So...
- For the Issues Calendar gadget, pick the same project again.
- In the Date to Display field, select Due Date (or whatever date-flavored field your team pays attention to).
- Click Save.
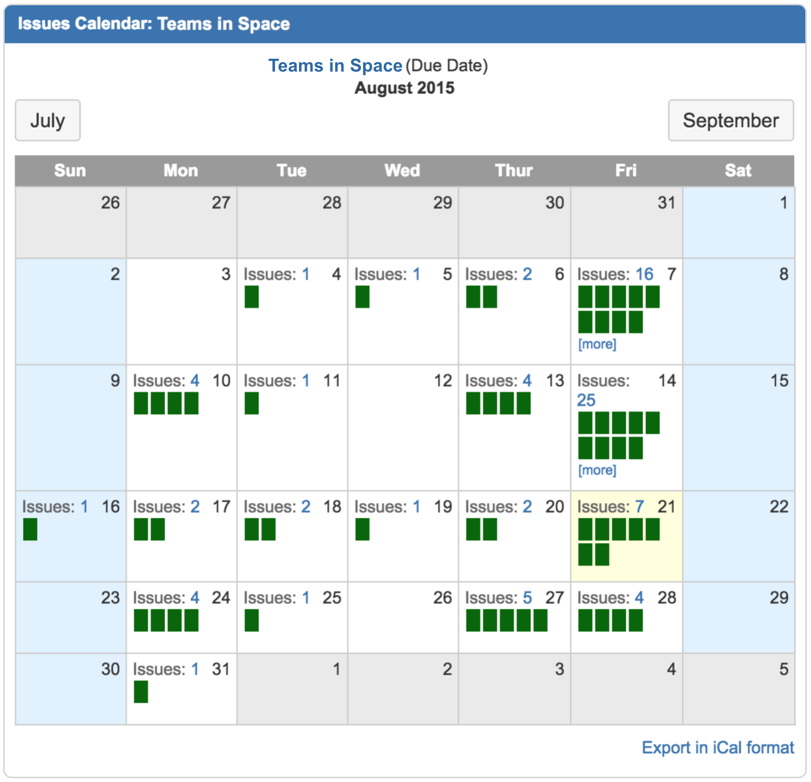
Now you'll have a high-level view of which dates are most important for your project, and be able to plan accordingly.
Step 4: Keep tabs on your own tasks
You want to know immediately when new work comes at you – not to mention make sure lower-priority items on your list don't get forgotten entirely – and the easiest way to do that is with the Assigned to Me gadget. It pulls up all your unresolved issues and highlights the fields that are most important to you.
- Leave Number of Results set to its default value of 10.
- The gadget suggests Issue Type, Key, Summary, and Priority as the default fields to display. Remove Key, and replace it with Created.
- Click Save.
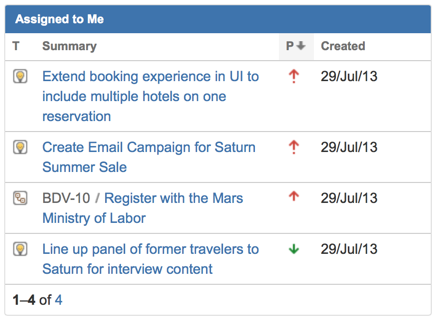
Note that you can sort your issues by any of the fields displayed – sort by Created to see what's just arrived on your plate, for example. If you want to use this gadget to keep track of when your tasks need to be completed, try editing the gadget's configuration and adding the Due Date field.
Pro Tip
For a more refined view of your tasks, try creating a saved filter that captures and presents your issues just the way you want, then pull them onto your dashboard using the Filter Results gadget. For example, if you want to see only your most urgent tasks, go to Issues > Search for Issues and click Advanced to bring up the JQL editor. This query will bring up your un-finished, high-priority tasks that are due within the next 3 days:
assignee = currentUser() AND priority in (Major, Critical) AND resolution = Unresolved AND due <= 3d
Save it as a filter, then come back to your dashboard and replace your Assigned to Me gadget with a Filter Results gadget. Boom!
Step 5: Watch out for orphaned issues
Issues that are left unassigned present a risk to your project. If you don't keep them visible, important pieces of work are liable to slip through the cracks while the rest of your project moves along, blissfully unaware – until the missing piece causes an emergency. Fortunately, you can create a saved filter that keeps these items in plain sight.
- From the top nav bar, select Issues > Search for Issues.
- Use the drop-down to select your project in the Project field. (Be sure you're in basic and not advanced search mode.)
- Leave Type and Status set to their default values of All so you make sure to capture everything.
- Set Assignee to Unassigned.
- From the More menu, select Resolution > Unresolved.
- (Optional) Go back to More and select Priority > Blocker and Critical if you want to isolate only high-priority issues.
- Save this as a new filter, giving it a descriptive name like "Unassigned issues".
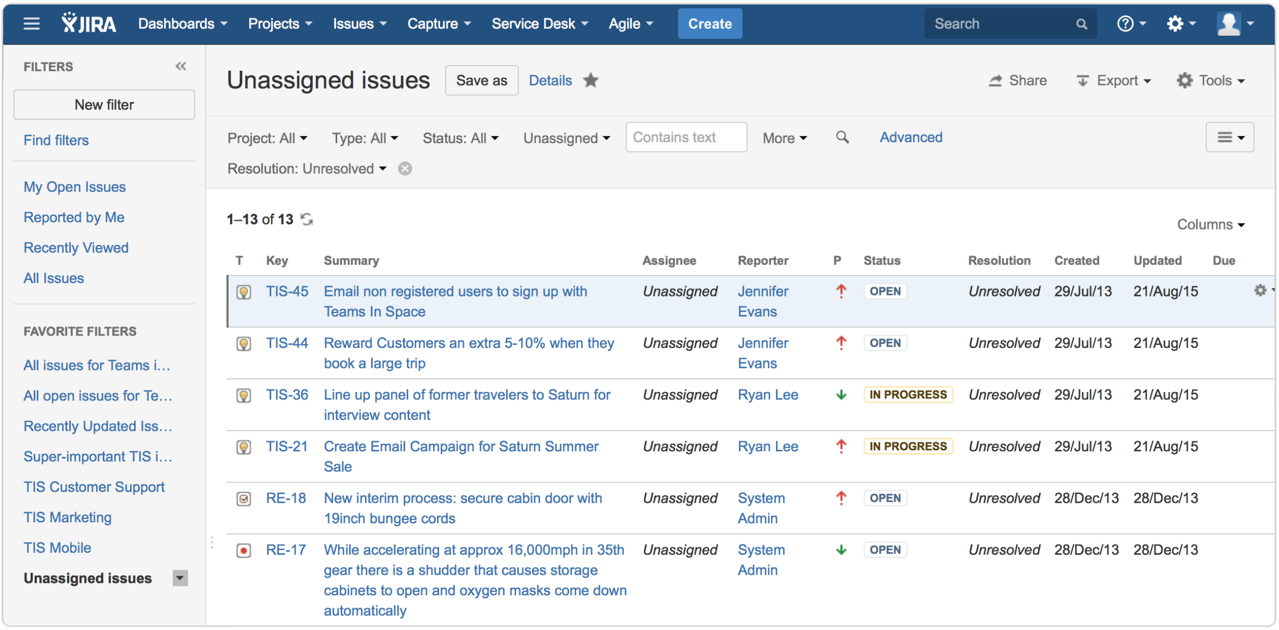
Now go back to your dashboard and configure your new filter to appear in the Filter Results gadget.
- Select the "Unassigned issues" filter, and add any other fields you'd like to see in addition to the four default columns. For example, Due Dates or Linked Issues are handy for highlighting urgency or dependencies.
Finish your dashboard: what else is missing?
This tutorial was designed to give you an idea of what's possible. You'll naturally spot areas where you'll want to dive into a deeper subset of project work. A JIRA dashboard is a living page, and you should tweak and evolve things as necessary. Here are some ideas:
- Toward the end of a project, last-minute items often pop up. A saved filter showing issues created in the past 24 hours and displayed through the Filter Results gadget help project leaders stay on top of them.
- Some people like charts better than percentage bars, so display work breakdowns visually. Try the Heat Map or Workload Pie Chart gadget instead of Issue Statistics to see which team members are heavily loaded.
- If you're afflicted with severe FOMO (fear of missing out), the Activity Stream gadget can keep you up to date when issues change statuses, get re-assigned, or get new comments.
Hungry for more?
Watch the blogs in this space to get notified when new tips articles like this are posted. And if that's still not enough, sign up for JIRA Insiders – our monthly newsletter covering all things JIRA.
![]() Written by Christina Swearengin, Head of Marketing Campaigns
Written by Christina Swearengin, Head of Marketing Campaigns