Cumulative Flow Diagram
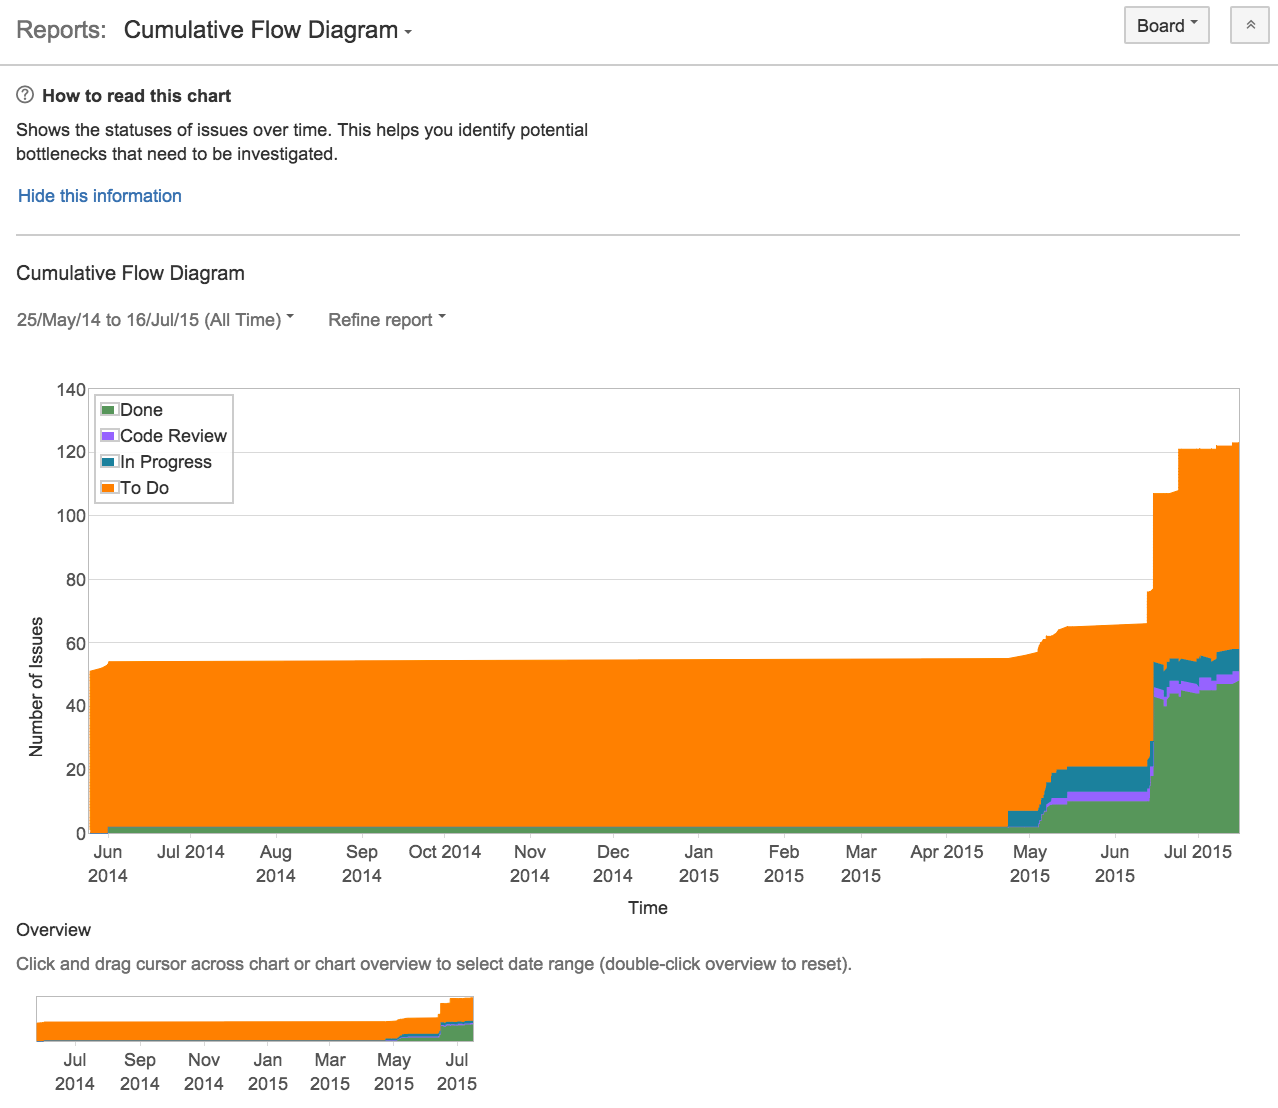
Screenshot: Cumulative Flow Diagram
Viewing the Cumulative Flow Diagram
- Navigate to your desired board.
- Click Reports, then select Cumulative Flow Diagram.
- To refine the data shown in the report, click Refine report, and select the desired filters.
- To select a different timeframe, click the date range drop-down at the top of the chart.
- To select a different date range, drag your cursor across the 'Overview' at the bottom of the chart.
Tip: Click How to read this chart at the top of the report to view a short description of the report.
Understanding the Cumulative Flow Diagram
Before you start using the CFD, you should get to know how it works. The following information will help you understand the key functionalities of the CFD:
- The CFD is board-specific – that is, it will only include issues that match your board's saved filter.
- The CFD is based on your board's column mapping. An issue is considered to be 'To Do' when it is in a status that has been mapped to the left-most column of your board. Similarly, an issue is considered to be 'Done' when it is in a status that has been mapped to the right-most column of your board. See Configuring columns for more information.
Next steps
Need help? If you can't find the answer you're looking for in our documentation, we have other resources available to help you. Check out Getting help.
Last modified on Mar 12, 2021
Powered by Confluence and Scroll Viewport.