Velocity Chart
A team’s velocity is the amount of value it can deliver in each sprint. Whether your team is using story points, issue count, or hours to estimate their stories, the chart will show how well you’re keeping up with your commitments. Over time, you’ll be able to predict the amount of work you can realistically commit to and get done in future sprints, making sure you’re not running around in panic.
Viewing the Velocity Chart
The chart is available for all Scrum boards and requires that you’ve completed at least one sprint to show any meaningful data.
- Navigate to your desired board.
- Click Reports, then select Velocity Chart.
- The chart will be displayed. By default, it shows all sprints completed in the past 3 months, but you can change this timeframe.

Timeframe: Choose one of the predefined timeframes, or select a date range. Whatever you choose, it will be retained in the URL, so you can share the link with your teammates.
Sprint details: Hover over a sprint to see the details, and the work committed and completed. This gives you an idea of whether your team is over- or under-committing. Ideally, the two bars for each sprint should be the same.
Save as image: Click to save the chart for future reference.
Focus: Use focus to zoom in on the sprints you’re most interested in.
Good to know
Here are some things to keep in mind when viewing the chart.
| Details | |
|---|---|
| Boards | The chart is board-specific, and will only include estimates from issues that match your board’s saved filter. |
| Sprints | The chart includes only completed sprints whose End date is within your chosen timeframe. By default, it shows the maximum of 120 sprints—if your timeframe includes more, we’ll show the latest 120. |
| Issues | The chart includes estimates (committed and completed) from all issues in your sprints. For performance reasons, we’re showing the maximum of 25,000 issues. |
| Permissions | When a user is viewing the chart, they will only see the estimates from the issues they’re allowed to see. It might happen that the chart is showing different data for different users, because they don’t have the right permissions. |
| Estimation | The estimates shown on the chart can be based on story points, hours, issue count, business value, or any numeric field of your choice. For more information, see Configuring estimation and tracking. |
Using viewing options to hide unrelated sprints
The chart has a Viewing options section that allows you to hide unrelated sprints. This is useful to make sure that the chart includes only sprints that really matter for your team.
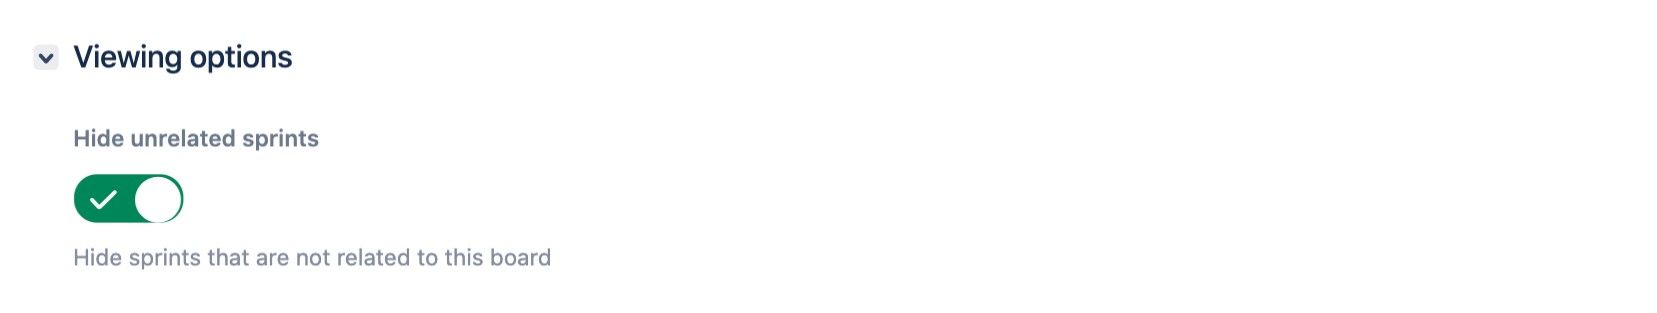
For example, if an issue in Sprint 1 on your board was moved to Sprint 2 on a different board, Sprint 2 would be included in the chart. This might affect your team’s velocity, because Sprint 2 belongs to a completely different board (and most likely a different team, too). With this option enabled, only sprints that belong to your desired board are included in the chart.
Next steps
Need help? If you can't find the answer you're looking for in our documentation, we have other resources available to help you. Check out Getting help.
Read the following related topics: