Viewing a build result
The instructions on this page describe how to view the build results for a plan.
Every completed build has a build result:
- Successful — the code compiled, with or without errors, and all tests completed successfully.
- Failed — either the code did not compile, or at least one test failed.
- Incomplete — the build was not completed, e.g. it may have been stopped manually.
Additionally,
- if the build result is Failed, and the previous build result was Successful, the build is labeled as Broken.
- if the build result is Successful, and the previous build result was Failed, the build is labeled as Fixed.
Viewing the most recent build result for a plan
To view the most recent job build result of a plan:
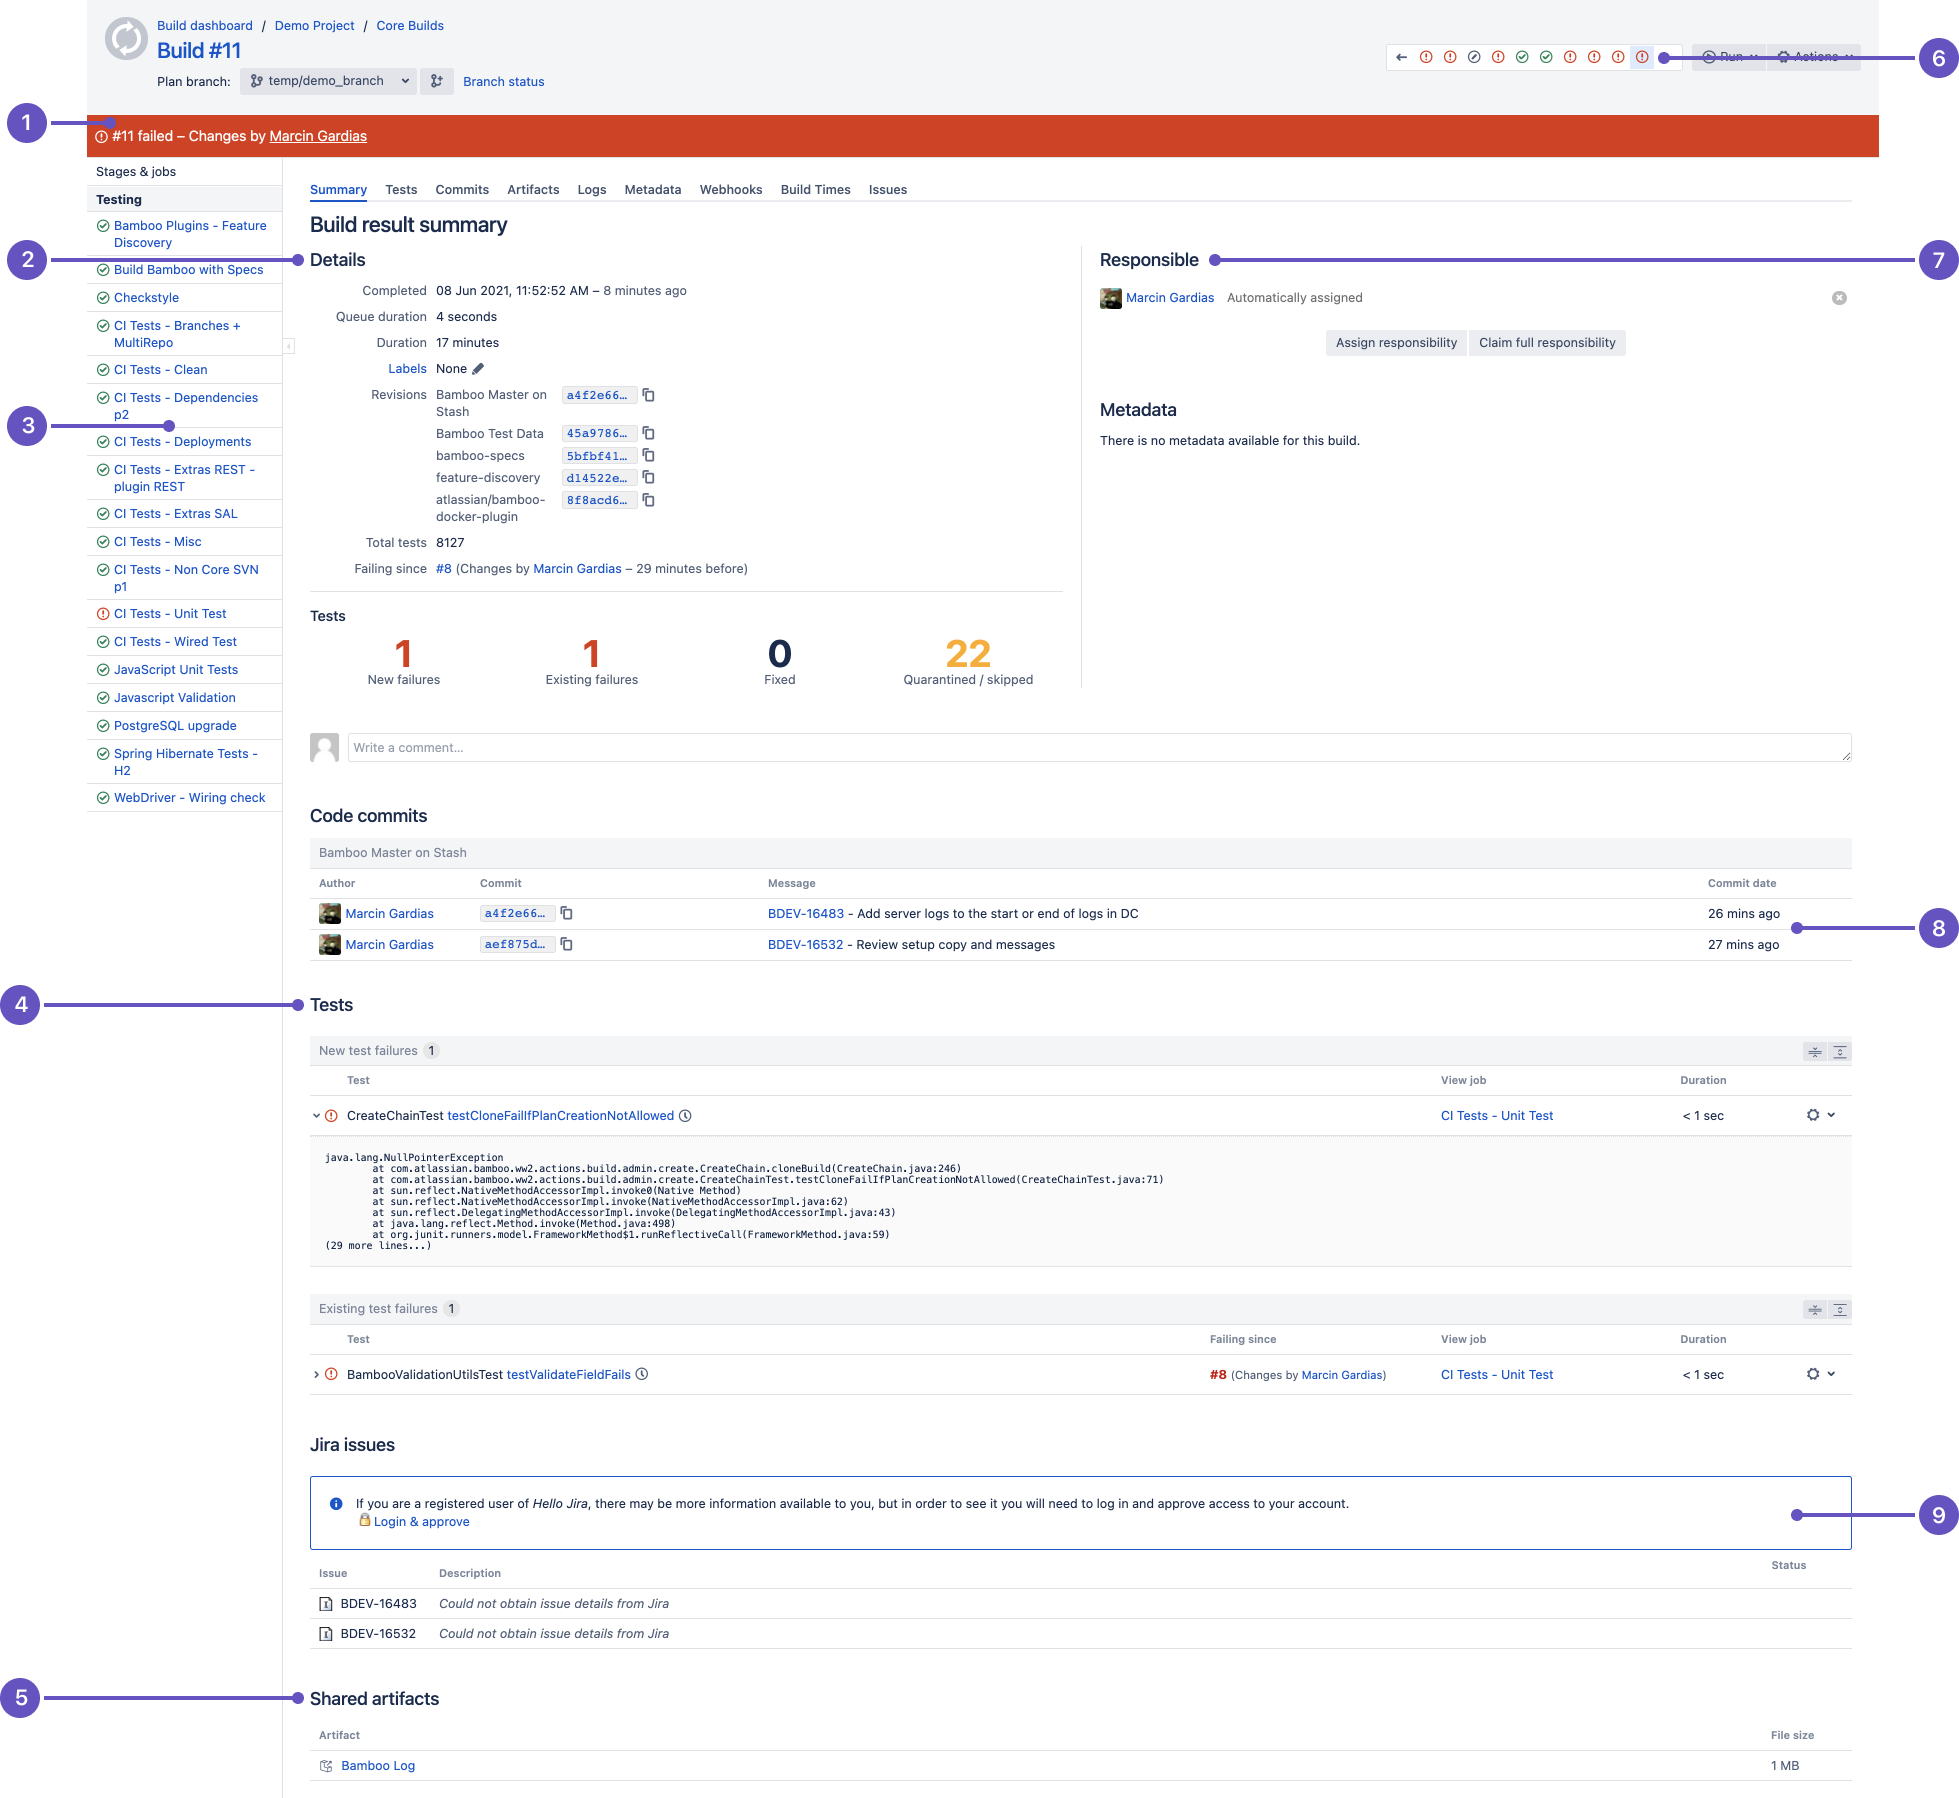
- From the top navigation bar select Build > All build plans, and select the build number.
- Status ribbon: Did the build succeed or fail?
- Details: Scan details of the build easily.
- Stages and jobs in the plan: Scan the success of job builds. Select an icon to see details.
- Test summary: Quickly see how many test are failing and how many were fixed in this build.
- Shared artifacts: See the artifacts shared from this build and download them.
- History: Scan the status of recent builds.
- Who is responsible? Users who commit code are automatically assigned.
- Code changes: See the code changes associated with this build.
- Jira issues: See the JIRA issues related to this build. Select to go to the issue in Jira for details.
| Tab | Description |
|---|---|
| Build summary | Displays a snapshot of the build result.
|
| Tests | Provides details of the build's test results. |
| Changes | Provides details of the code changes that triggered this build (if applicable). |
| Artifacts | Shows any artifacts relating to this build. |
| Logs | Displays a complete build log. |
| Metadata | Displays any metadata that relates to this build. |
| Build times | Displays a histogram of build times for jobs, and a list of which agents were used to build each job. |
| Issues | Provides details of the Jira issues linked to this build (if applicable). Availability depends on Bamboo's configuration. |
| Clover | Displays the Clover code-coverage that relates to this build (if applicable). The clover tab is located on the job level because a build can have more than one jobs, and each job might have different Clover results or not have clover tab at all. That's why in order to see the Clover tab, you need to drill down to the individual job that contains the clover report. |
- You can assign responsibility for a broken build, either to yourself (select Claim full responsibility) or to someone else in your team (select Assign responsibility).
Viewing all build results for a plan
To view all build results for a plan:
- From the top navigation bar select Build > All build plans, and select your plan.
- The ten most recent builds will be displayed in the Recent history section on the Plan summary tab. See Viewing a plan's build information.
- Select the History tab to view all builds for the plan.
Viewing all build results for a job
To view all build results for a job:
- Navigate to the desired job, as described on Configuring jobs. The ten most recent builds will be displayed in the Recent history section of the Job summary tab.
- Select the History tab to view all builds for the job.
Last modified on Aug 10, 2021
Powered by Confluence and Scroll Viewport.

