'Current' Report
Clover 4 brings new HTML report developed according to the Atlassian Design Guidelines; it's shortly named "ADG". Clover 3 offers an old-style JavaDoc-like format, named "Classic".
ADG report style (Clover 4 only)
Project overview page
General
On the project overview page you will find several tabs, thanks to which you can quickly learn about your project:
- Dashboard - contains several widgets with statistics and most critical issues
- Application code - browse through application classes
- Test code - browse through test classes
- Test results - contains results from your unit tests
- Top risks - the most complex and the least covered classes
- Quick wins - "low hanging fruits"
- Coverage tree map
Blue application header
- Clover logo - opens the Atlassian Clover home page
- Linked reports - shows reports linked with the current one (optional, see the <clover-report> task for more details)
- Help icon - opens the Clover documentation home page
Dashboard tab
It contains several useful widgets:
- Code coverage - shows Total Coverage Percentage metric of your application code (i.e. excluding test code)
- Test results - shows number of tests executed and their success ratio
- Code metrics - shows code metrics of your application code of the entire project (i.e. excluding test code)
- Class coverage distribution - histogram showing number of classes vs coverage
- Class complexity - dot chart showing class complexity vs coverage
- Coverage tree map - size of the rectangle represents package complexity, while color shows its coverage
- Top project risks - the most complex and the least covered classes
- Most complex packages - packages with the highest cyclomatic complexity
- Most complex classes - classes with the highest cyclomatic complexity
- Least tested methods - methods having the lowest code coverage
Package tree view
You can use it to navigate through the project structure. You can also search for packages matching given sub-string.

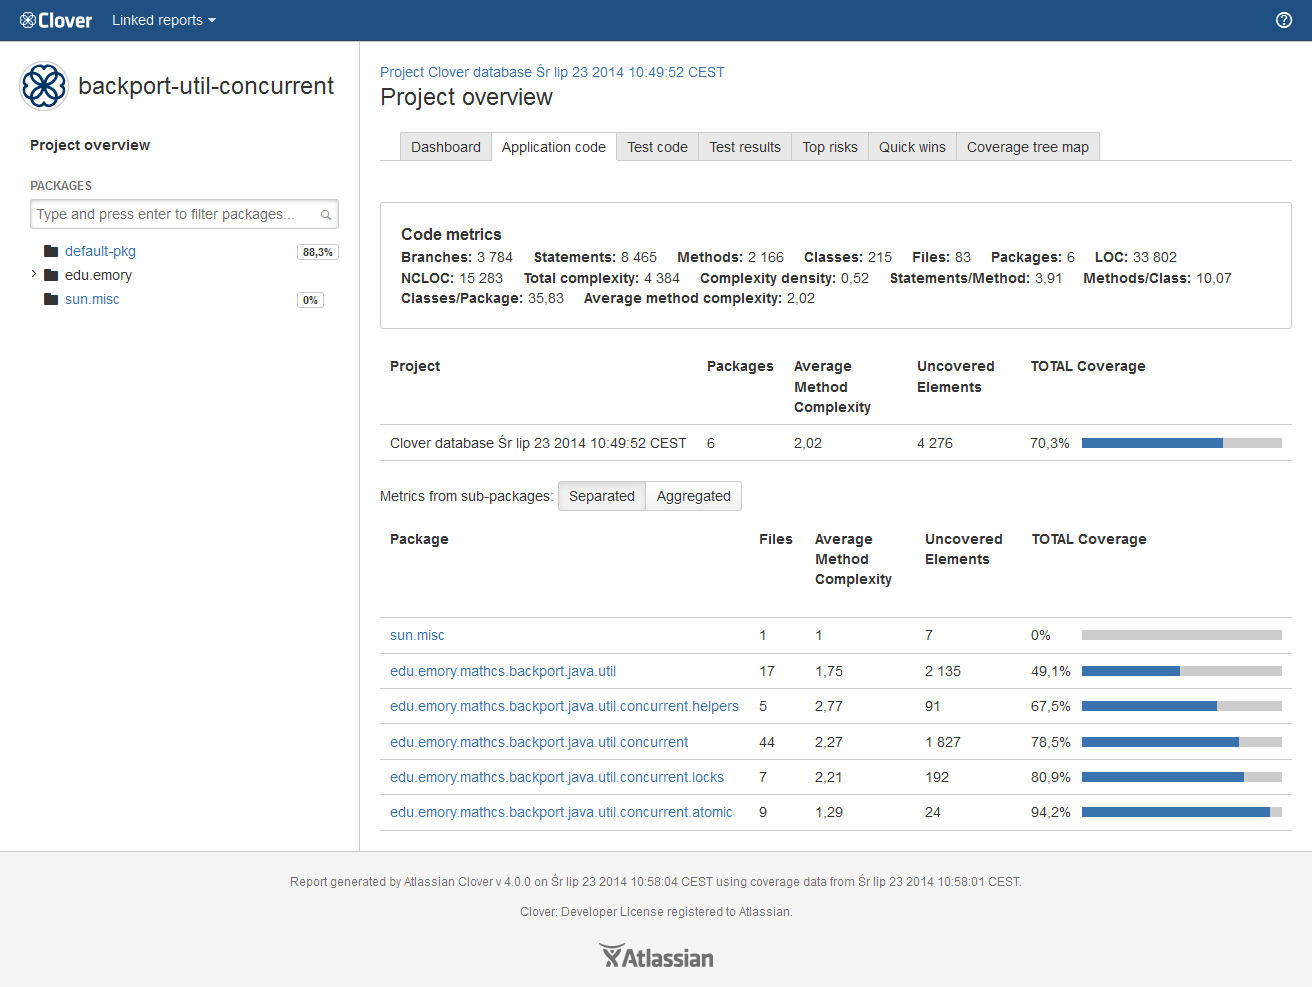
Package-level and project-level overview of application and test code
The "Application code" and the "Test code" tabs show list of packages along with their metrics and their code coverage.
In case of a project-level overview, there is an additional toggle "Metrics from sub-packages: Separated / Aggregated", which allows to calculate an aggregated code coverage and code metrics, i.e. given package will include also metrics from its sub-packages.
Table columns are sortable and customizable.
Source file view
This page contains few sections:
- code metrics for current source file
- list of classes in the source file, the "Show methods" opens a dialog showing detailed data for a class
- number of tests "hitting" the source file, the "Select tests to highlight the test coverage" opens list of tests; it's possible to select them to see per-test coverage
- source code view page with highlighted code coverage
In the source view, the left-most column shows line numbers. The second column shows the number of times a particular line has been executed during the test run.
If a line is never executed or has only been partially executed, the entire line of code will be highlighted in red. You can hover the mouse over a line to get a pop-up describing in detail the coverage information for that line.
You can click on the 'Show legend' button to see more details about highlighting.
Rendered code provides also source cross referencing and stack trace navigation.

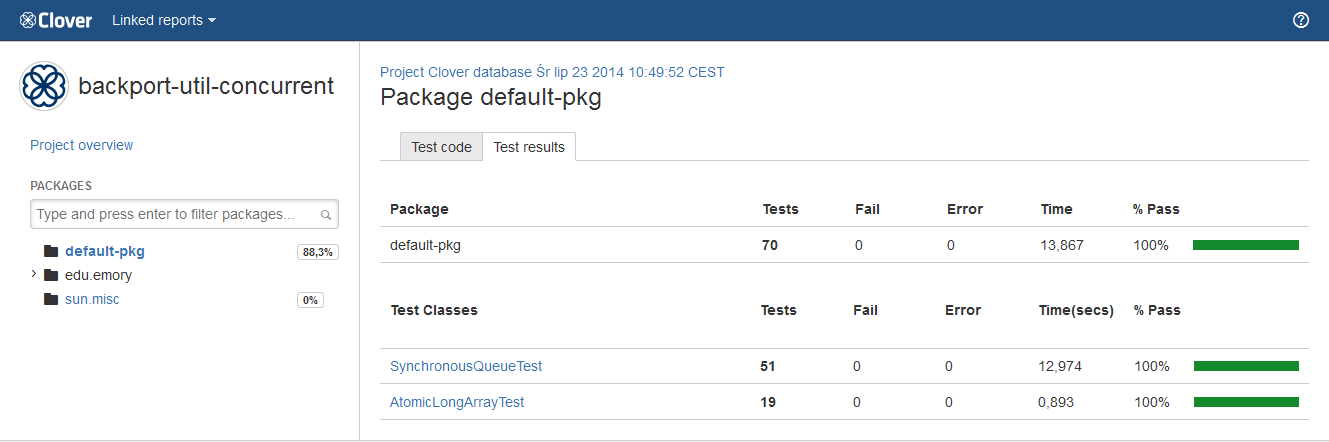
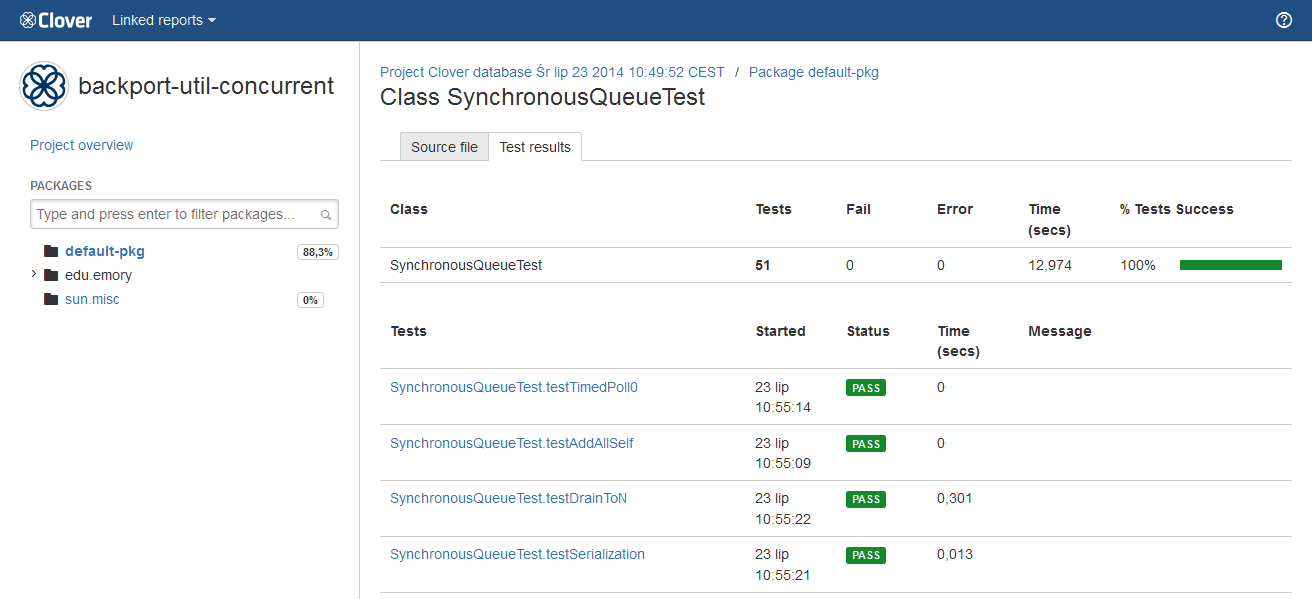
Test results
The "Test results" tab shows information about executed tests - for an entire project, a package, a class as well as for a single test case.
What is worth to note is that a class-level summary may contain multiple tests having the same name - it may happen in case you have executed test several times or you have used a test framework allowing test iterations (for instance, the JUnit4 with @Parameterized annotation or the Spock framework).
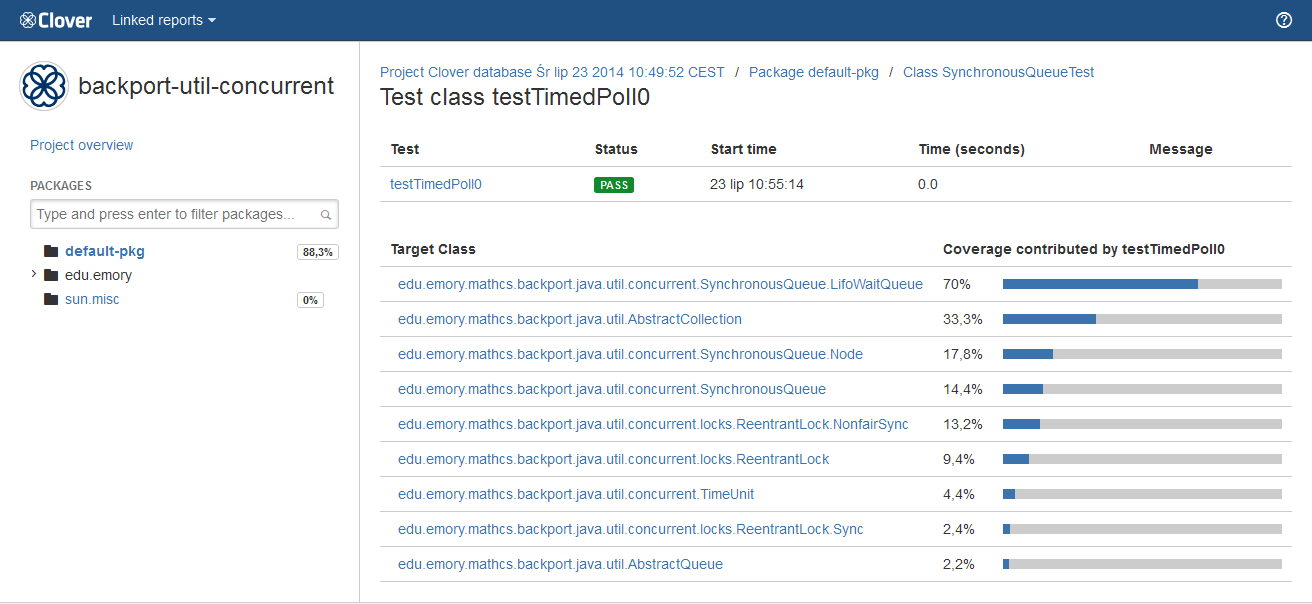
A test case page shows detailed information like test result, duration, stack traces (if any) as well as a list of classes which were covered by the test.
'Top risks' and 'Quick wins' tag clouds
The Top Risks tag cloud highlights those classes that are the most complex, yet are the least covered by your tests. The larger and redder the class, the greater the risk that class poses for your project or package. Font size represents the Average Method Complexity metric, while the color represents the Total Coverage metric (red for 0%, green for 100%).
The Quick Wins tag cloud highlights the "low hanging coverage fruit" of your project or package. You will achieve the greatest increase in overall code coverage by covering the largest, reddest classes first. Big red classes contain the highest number of untested elements. Font size represents the Number of Elements metric, while the color represents the Number of Tested Elements from red - minimum tested elements to green - maximum).
Note: For Clover 4.0.4 and lower those metrics had different color scheme.


Coverage tree map
The coverage tree map report allows simultaneous comparison of classes and packages by complexity and by code coverage. This is useful for spotting untested clusters of code. The tree map is divided by a package (labeled) and then further divided by a class (unlabeled). The size of the package or class indicates its complexity (larger squares indicate greater complexity, while smaller squares indicate less complexity). Colors indicate the level of coverage, as follows:
- green for most covered
- red for least covered
Clicking on a class will navigate you to the corresponding source file view.
Note: For Clover 4.0.4 and lower this metric had different color scheme.

See also: 'Historical' Report.
Classic report style (Clover 3 and Clover 4)
Classic report style has been removed in Clover 4.1.0. See Clover 4.0 documentation.
Appendix: naming convention of lambda functions
Naming convention for Java 8 lambda functions is as follows: <lambda_prefix><parameter_list><sequence_number> where:
- <lambda_prefix> is $lam
- <parameter_list> is a list of argument names separated by underscore, like x_y_z; list can be empty
- <sequence_number> is #N where N counts definitions of a lambda function in given source file (starting from 0)
For example: $lam_x_y_z#6 means a sixth lambda in the source file having the (x, y, z) => signature.
Why such naming convention?
- if you use meaningful names of lambda arguments, you'll be able to easily find such lambda function on a list
- sequence number helps to distinguish zero-argument lambda functions