Trace requests in Jira
If you’re having performance issues, Tracing can give you the information you need to be able to diagnose the cause – either through finding which URLs are slow for users, or by finding which users are triggering an action that may be causing performance issues.
How to trace requests in Jira
You’ll need a set of tools to trace requests for Jira. The tools we recommend and have tested with Jira are:
OpenTelemetry’s Java Agent: used to perform tracing out-of-the-box and send this data to a third party component.
Jaegar: the distributed tracing system to which the OpenTelemetry Agent will export the trace data.
Grafana: used to visualise the trace data captured by Jaeger.
1. Download OpenTelemetry and configure Jira
Download the OpenTelemetry Java agent.
Configure Jira to run with the following system properties:
-javaagent:/Users/wyasvoin/Documents/temp/OpenTelemetry/opentelemetry-javaagent.jar
-Dotel.traces.exporter=jaeger
-Dotel.resource.attributes=service.name=jira
2. Install Jaeger
In order to graph the traces, you’ll need a third party tool like Jaeger or Zipkin. We recommend Jaeger, purely because of the way it groups and allows for searching for traces within Grafana, though there are other tools available.
Read Jaegar documentation for more information on Jaeger and distributed tracing.
3. Install and configure Grafana
Next, install and configure Grafana. Jaeger does include its own UI, but we recently published a set of dashboards and guidance around using Grafana and Prometheus for monitoring Confluence and Jira, so keeping all Observability UI aspects within Grafana makes it easier to administer.
For more information on setting up Grafana, refer to the Grafana documentation.
Once Grafana and Jaeger are up and running, navigate to the “Data Sources” section within Grafana. From there, add a new Data Source for Jaeger. Test that it’s able to access Jaeger. You should get a result similar to the following screenshot.

Screenshot: Jaeger Data Source in Grafana
Once Jira is up and running with the OpenTelemetry Agent (mentioned earlier), you’ll be able to search and view trace information for requests within Jira.
The following screenshot shows the trace information for an Issue View request (i.e. http://{host}:{port}/jira/browse/{issue-id} ).

Screenshot showing Issue View trace data.
In the screenshot you’ll notice there’s plenty of information related to the request, including all the SQL statements executed for that specific request (and more that have been cut out of view in the screenshot). We’ve highlighted some useful, high level information such as the request duration and http.target. In the example you can see that it took 1.79 seconds to render the request to http://localhost:8090/jira/browse/FUB-1.
As well as providing the ability to trace all requests within Jira, using OpenTelemetry Agent allows you to trace requests across products. The following screenshot highlights the Development tools view within a Jira Issue View. This view is only present when an Applink exists between Jira and Bitbucket. Clicking the link will make an Applink request against the configured Bitbucket instance, and fetch data about the branch and its repository.
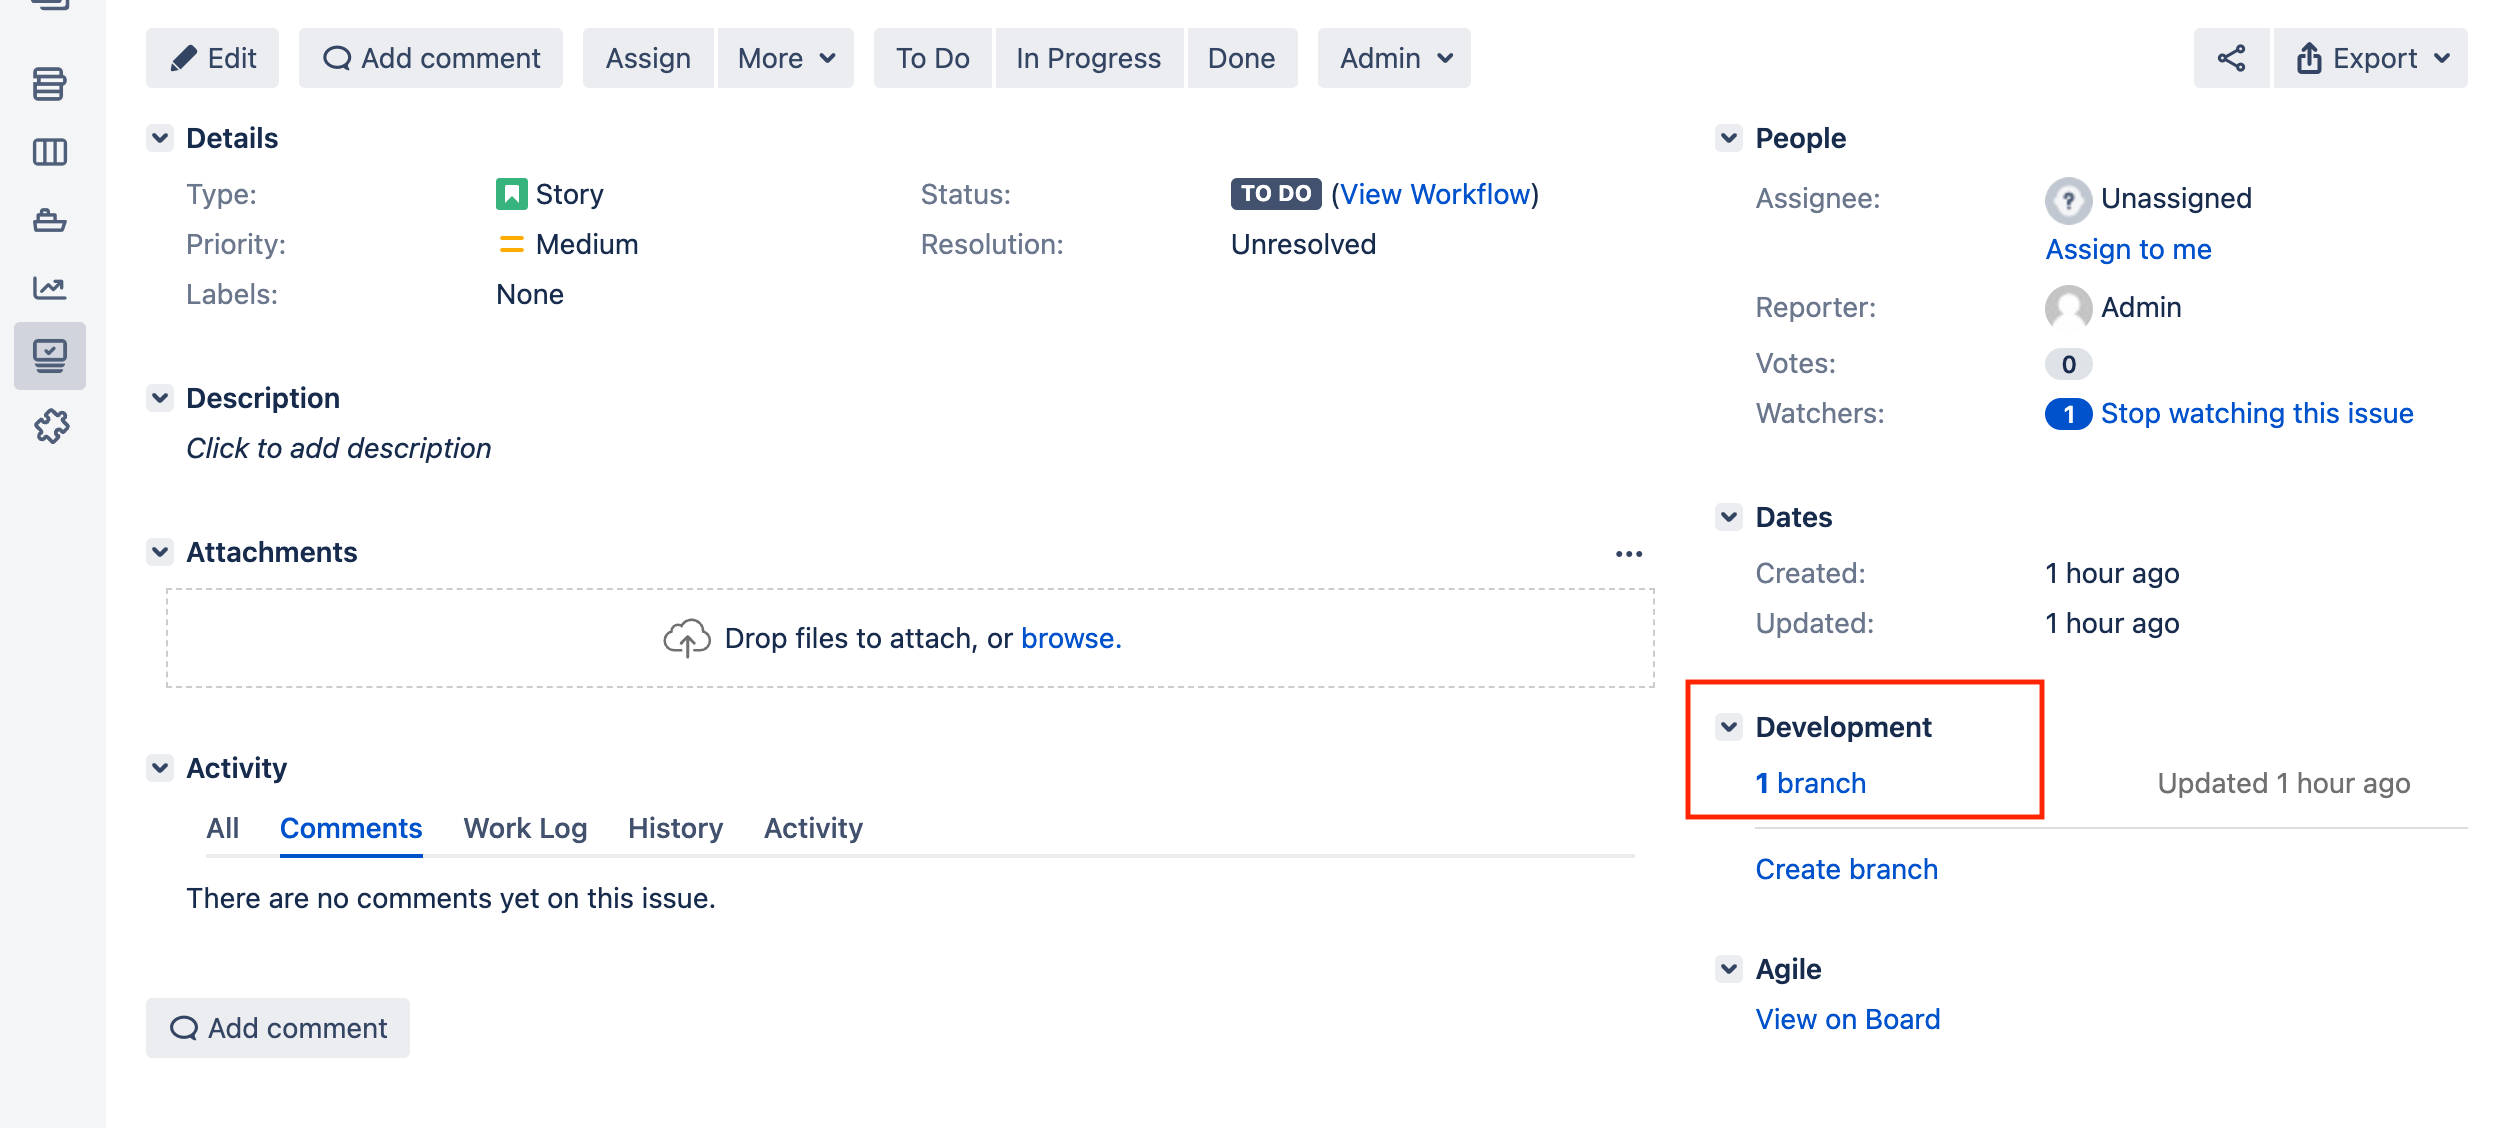
Screenshot: Development tools in the Jira Issue View
The following screenshot shows the trace data for the corresponding request. Note that the request is coming from the Jira DVCS Connector plugin, and that it goes off (HTTP GET) to the configured Bitbucket instance (http://localhost:7990/bitbucket...) to get information about pull requests for the branch associated with the Jira Issue. This tells you how long outbound requests to other products are taking. The converse of this is also true, and you can trace these incoming requests from Bitbucket to see the amount of traffic placed on the instance by other Atlassian products.
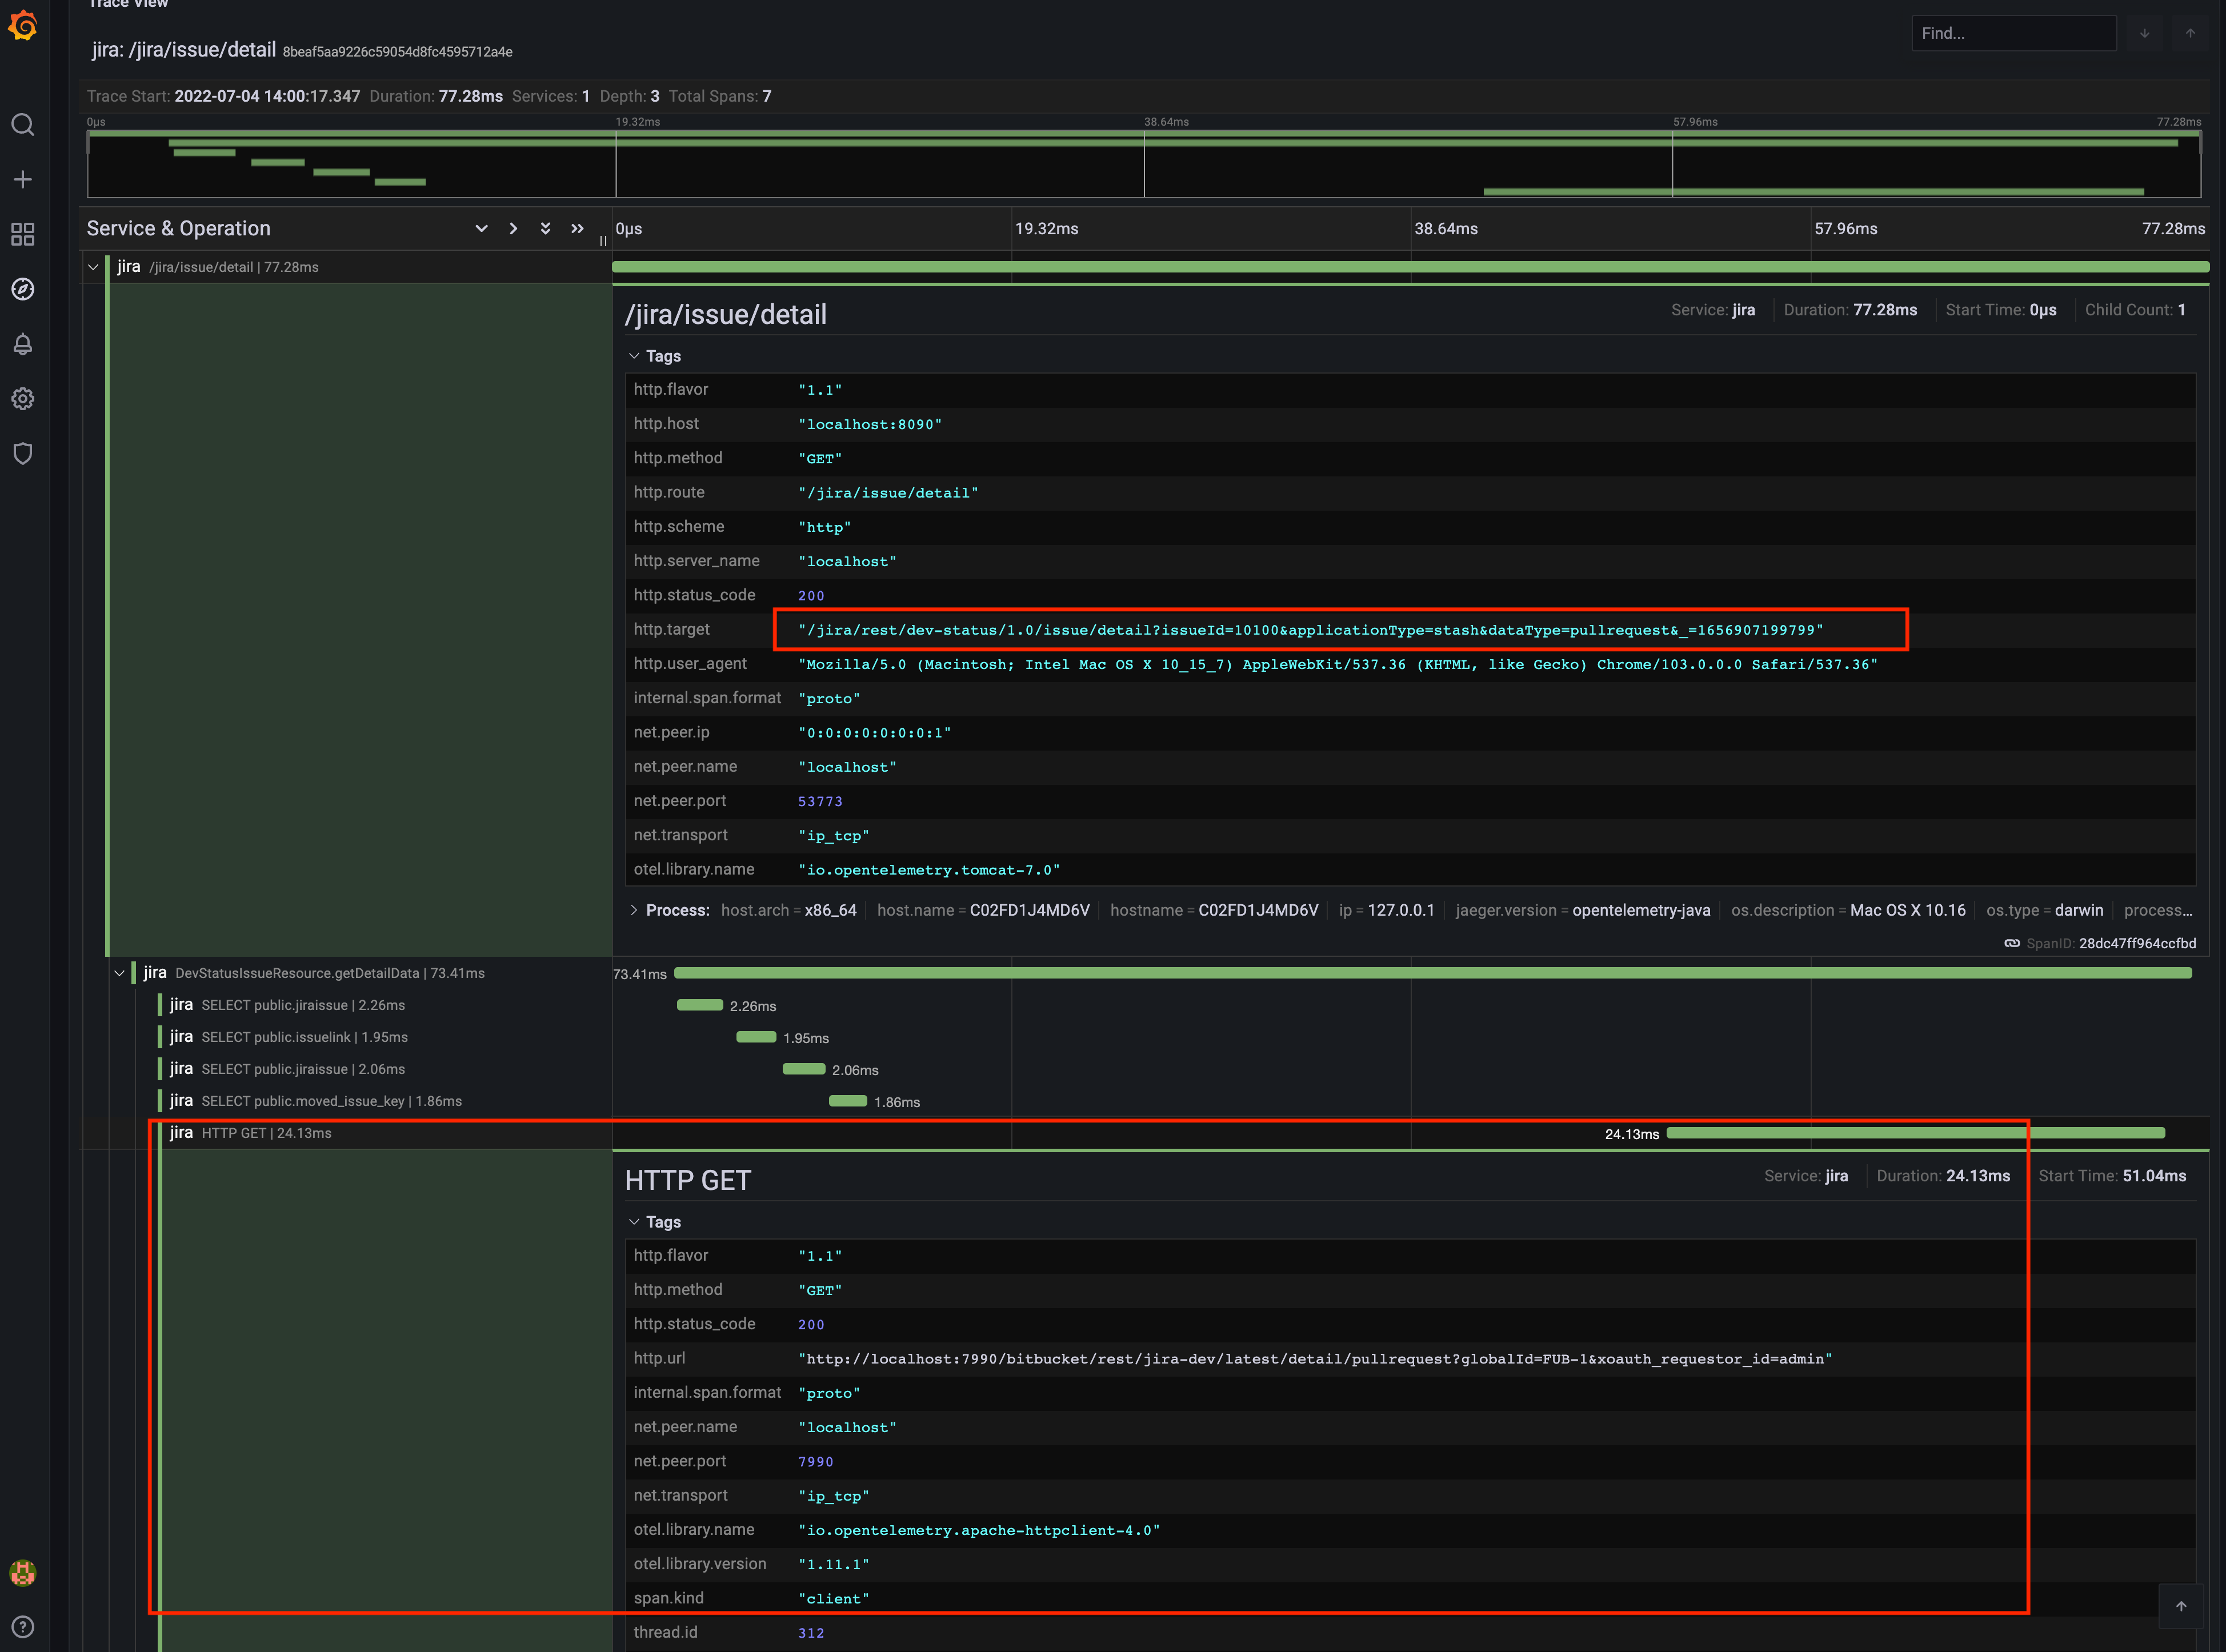
Screenshot of Development tools trace data