Generating a Heap Dump
Sometimes you may see that Confluence is holding onto a chunk of memory over a period of time (for example, tenured space is increasing close to Xmx). In such a situation, it is useful to find out what is stacking up in the memory by analyzing the heap dump.
On this page:
Automatically Generating a Heap Dump when Confluence Hits OutOfMemory Error
Typically, we would like to analyze the heap dump produced when Confluence died from an OutOfMemory Error. For this, you can add additional JVM parameters like below:
-XX:+HeapDumpOnOutOfMemoryError -XX:HeapDumpPath=<path to this heap dump file>If you do not set the HeapDumpPath parameter, by default the heap dump will be saved in the folder where Tomcat is run from.
If you are setting these parameters in the Windows registry (when running Confluence on Windows as a service), be sure that each parameter is on its own line.
Manually Generating a Heap Dump when Confluence Stops Responding
It is also possible to get a heap dump manually using a JDK bundled tool called jmap, although we recommend that you use the automatic method above for best result.
For Linux/Solaris-based Operating Systems:
Please execute the following command on Linux OS:
$JAVA_HOME/bin/jmap -dump:format=b,file=heap.bin <pid>
For Windows:
Please find your Confluence process ID (see below) and then execute the command below on a Windows command line:
%JAVA_HOME%\bin\jmap -dump:format=b,file=heap.bin <pid>
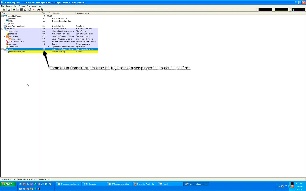
To find out the process ID for your Java process in Windows, you can use Process Explorer from Microsoft. This is what it looks like:
Using Process Explorer to find your Tomcat process ID |
|
|---|---|

|

|
|
Tomcat run from startup.bat script
|
Tomcat run as Windows Service
|
Submitting a Heap Dump to Atlassian Support
Please zip the file and then send it to Atlassian Support.