How to resolve slow queues view with high CPU in Jira Service Management
Platform Notice: Data Center - This article applies to Atlassian products on the Data Center platform.
Note that this knowledge base article was created for the Data Center version of the product. Data Center knowledge base articles for non-Data Center-specific features may also work for Server versions of the product, however they have not been tested. Support for Server* products ended on February 15th 2024. If you are running a Server product, you can visit the Atlassian Server end of support announcement to review your migration options.
*Except Fisheye and Crucible
Summary
Jira Service Management nodes present high CPU usage and the queues page (which looks like https://myjira.com/projects/ITSD/queues/custom/1) is very slow to load in at least one heavily used project.
Environment
Jira Service Management Server or Data Center.
Diagnosis
In a HAR File, we see that the REST call to a URL like this is slow: https://myjira.com/rest/servicedesk/1/ITSD/webfragments/sections/sd-queues-nav,servicedesk.agent.queues,servicedesk.agent.queues.ungrouped
In thread dumps with thread diagnostics enabled, we can also see several calls to that same URL using high CPU.
Cause
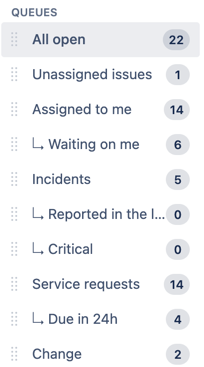
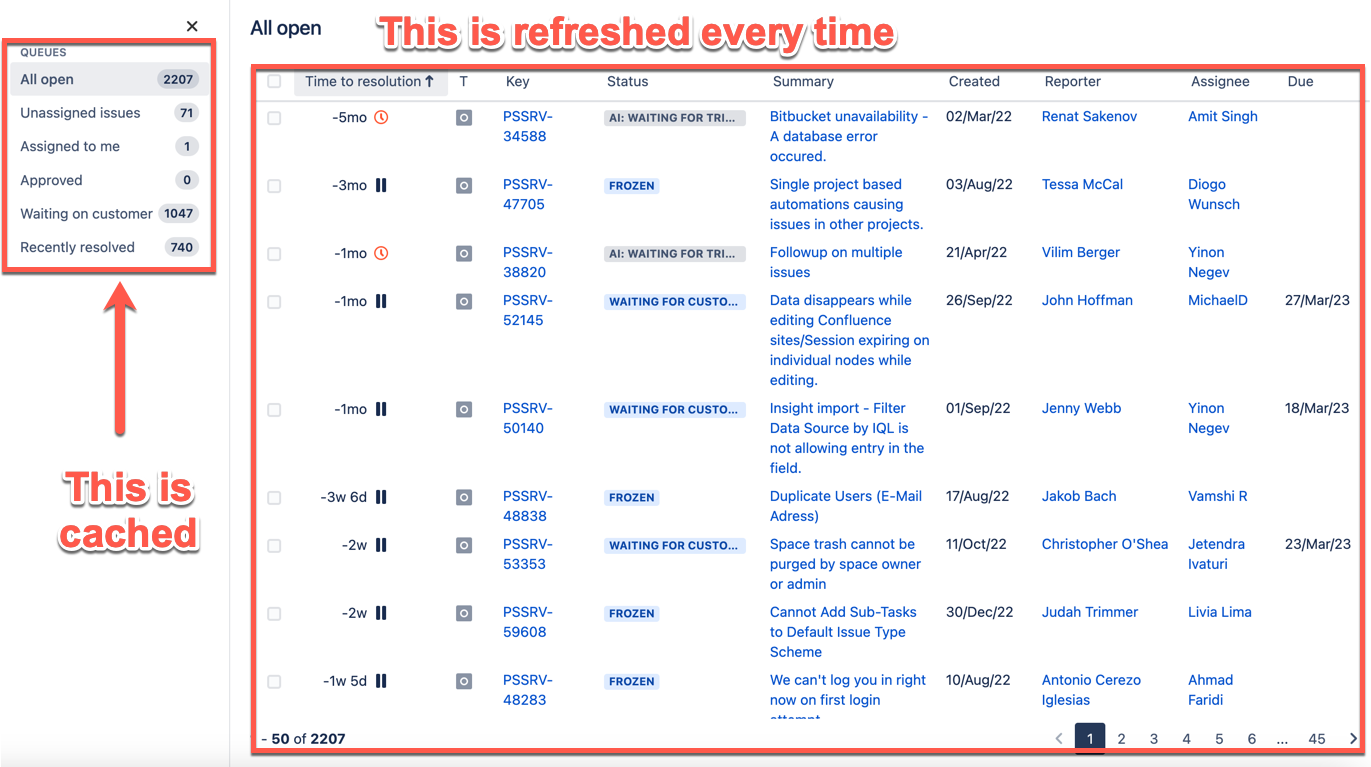
The URL that causes the high CPU runs JQLs to update the queue counts on the left of the screen, which is refreshed:
The high CPU can be caused by a combination of:
- A large number of queues;
- Complex queue JQLs;
- Many non-archived issues present on the project;
- A large number of users using this page.
This is documented in JSDSERVER-4897 - Loading issue count is slow when there are many queues in single project
Solution 1 - Optimize the JQLs
Using the thread dumps, identify the projects that are impacting the CPU the most.
Check the queues for particularly slow JQLs. Queues that have been added or edited recently are excellent candidates for optimization or removal.
Solution 2 - Archive old issues
Especially for projects that have many years, archiving old issues might be a good idea to reduce the amount of data the JQL will search through.
Here are some ways to archive issues:
- Archiving multiple issues as part of bulk change
- An example of leveraging the REST API: Is there an easy way to archive a lot of issues?
- Use ScriptRunner archiving job
Solution 3 - Enable queue count caching
Queue count caching was introduced in JSM 3.4.2 by JSDSERVER-4897 - Loading issue count is slow when there are many queues in single project.
With caching enabled, the JQLs are run every 2 minutes in the worst case, instead of running on every request. The downside is that the queue counts are only updated every 2 minutes.
When queue caching is enabled, only the issue count is cached, and not the issue list. This means that the count on the left might be up to 2 minutes behind the issue list.
To enable caching:
First, enable caching globally. This will not enable caching yet.
Call a PUT request to the/rest/servicedeskapi/admin/queues/cache-countendpoint, like this:curl -D- -u username:password -X PUT -H "Content-Type: application/json" -H "X-ExperimentalApi: true" --data-binary true https://myjira.com/rest/servicedeskapi/admin/queues/cache-countThen enable the cache for the desired projects with a request like this:
curl -D- -u username:password -X PUT -H "Content-Type: application/json" -H "X-ExperimentalApi: true" --data-binary true https://myjira.com/rest/servicedeskapi/admin/queues/<projectkey>/cache-countNote: enabling the cache for a single project doesn't work if the global setting is disabled.
Finally, validate the status by navigating to
https://myjira.com/rest/servicedeskapi/admin/queues/<projectkey>or using curlcurl -D- -u username:password https://myjira.com/rest/servicedeskapi/admin/queues/<projectkey>
To revert the caching configuration, call the same endpoints using --data-binary true/false as desired.
Solution 4 - Disable the queue counts
To disable for a specific project:
curl -D- -u username:password -X PUT -H "Content-Type: application/json" -H "X-ExperimentalApi: true" --data-binary false https://myjira.com/rest/servicedeskapi/admin/queues/<projectkey>/include-countTo disable globally:
curl -D- -u username:password -X PUT -H "Content-Type: application/json" -H "X-ExperimentalApi: true" --data-binary false https://myjira.com/rest/servicedeskapi/admin/queues/include-count Note: when the issue queue count is disabled globally, this setting takes precedence. This means that even if it is enabled for specific projects, it will still remain disabled due to the global configuration.

