Thread diagnostics
A thread dump is a log containing information about currently running threads and processes within the Java Virtual Machine (JVM).
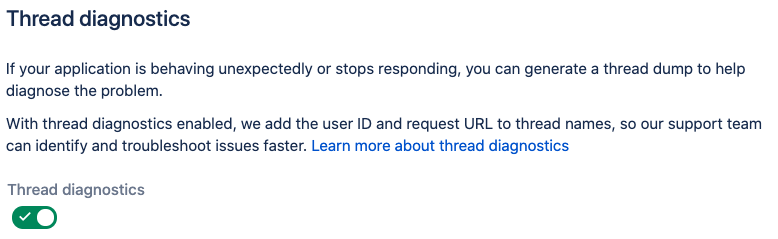
If your application is performing poorly, behaving unexpectedly or stops responding, you can generate a thread dump to help diagnose the cause of the problem. If you create a support request, including a thread dump into a support zip can help the Atlassian support team investigate your problems.
What is thread diagnostics?
Thread diagnostics is a feature of the Atlassian Troubleshooting and Support tools app. It adds diagnostic information to thread dumps, making troubleshooting faster. Learn more about Troubleshooting and Support tools
The app adds the following details to thread names:
- user ID
- request URL
If you don’t want this data included in thread dumps, you can disable the feature:
Open Troubleshooting and Support Tools in your Atlassian application. Learn how to access Troubleshooting and Support Tools
Go to the Diagnostic settings tab.
Turn off the Thread diagnostics toggle.
Generate a thread dump
There are a two main ways to generate thread dumps.
Generate thread dumps within your application
To generate thread dumps:
- Open Troubleshooting and Support Tools in your Atlassian application. Learn how to access Troubleshooting and Support Tools
Go to the Create support zip tab.
In the Customize support zip contents section, choose Selected files, and make sure that the Thread dumps checkbox is selected.
Select Create zip.
The support zip file includes three thread dumps taken at five-second intervals.
Generate thread dumps externally
There are a number of methods for creating thread dumps externally. Learn more about generating a tread dump
You can also refer to our product-specific guides:
- Confluence: Generating a thread dump externally
- Jira Software: Generating a thread dump
- Bitbucket: Generating a thread dump externally
- Bamboo: Performing a thread dump