Portfolio colors and symbols reference guide
This page contains a visual guide explaining all the key elements you see on the schedule and its different views.
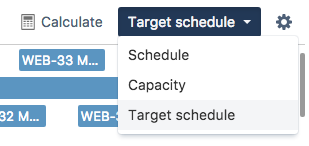
To enable the different views, open the drop-down menu located next to the plan settings icon and select Schedule, Target Schedule or Capacity view.
The schedule view will change automatically.
Timeline
This section explains the key elements of your timeline.
- Current date indicator: Indicates the current date (today).
- Release start date indicator: Indicates the release start date. The indicator is displayed in green if the release is on-track or underbooked, and red if the release is overbooked.
- On-track release date indicator: A green release date indicator showing that the fixed release is on-track. If you're using dynamic release dates, you will always see this green indicator on your timeline. The timeline for an on-track release is displayed in green.
Release date indicator for overbooked fixed release: Indicates that a fixed release is overbooked. The indicator and timeline for an overbooked release are displayed in red.
- Calculated release date indicator for overbooked fixed release: Indicates when your release will be done based on the realistic date that Portfolio has calculated. The indicator is displayed in red.
- Calculated release date indicator for underbooked fixed release: If Portfolio calculates that a fixed release is underbooked and able to be finished early, it will indicate an earlier release date. The indicator is displayed in green.
Timeline with checkered background: Indicates the time between the fixed release date and the realistic release date calculated by Portfolio. The timeline is displayed in green for an underbooked fixed release and red for an overbooked fixed release
Empty roadmap indicator (white timeline): A white timeline indicates that no work has been scheduled in your plan during a given period of time.
Release date/Release name: The release date and the release name are located below the release date indicator. They are displayed in the following format: "release date - release name". For example "21/Mar/18 - IOS 1.0
Schedule
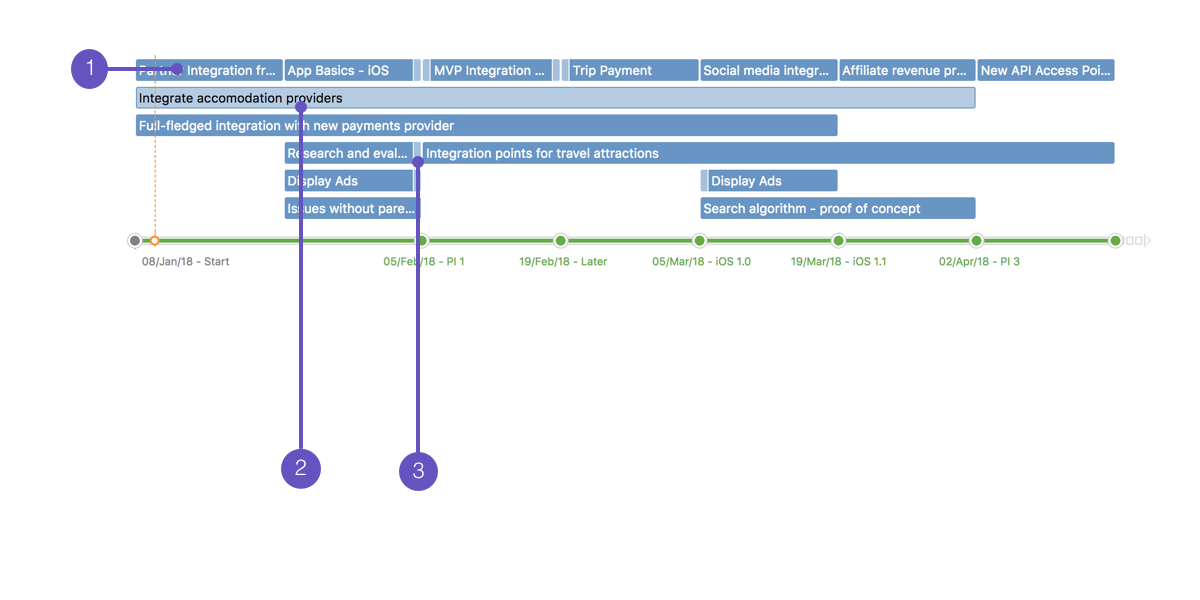
This section explains the key elements of the schedule view. The schedule view shows a visual roadmap of all the issues in your plan and any dependencies they may have.
- Issue bar: Represents an issue in your plan at the hierarchy level you're currently viewing the schedule at.
- Placeholder issue bar for an unscheduled issue: An issue bar with a light blue background that represents an unscheduled issue. These are placeholder issues that Portfolio will show on your visual roadmap but doesn't take into consideration when running it's scheduling algorithm. An unscheduled issue is likely caused because the issue not being estimated but it's assigned to a release. In this case, Portfolio is able to create a placeholder for the duration of the release.
- Dependency indicators: A light blue tag on the left or right end of an issue bar indicating the issue has a dependency. If the indicator is located on the left, the issue is blocked by another issue. If the indicator is located on the right, the issue blocks another issue.
Target Schedule
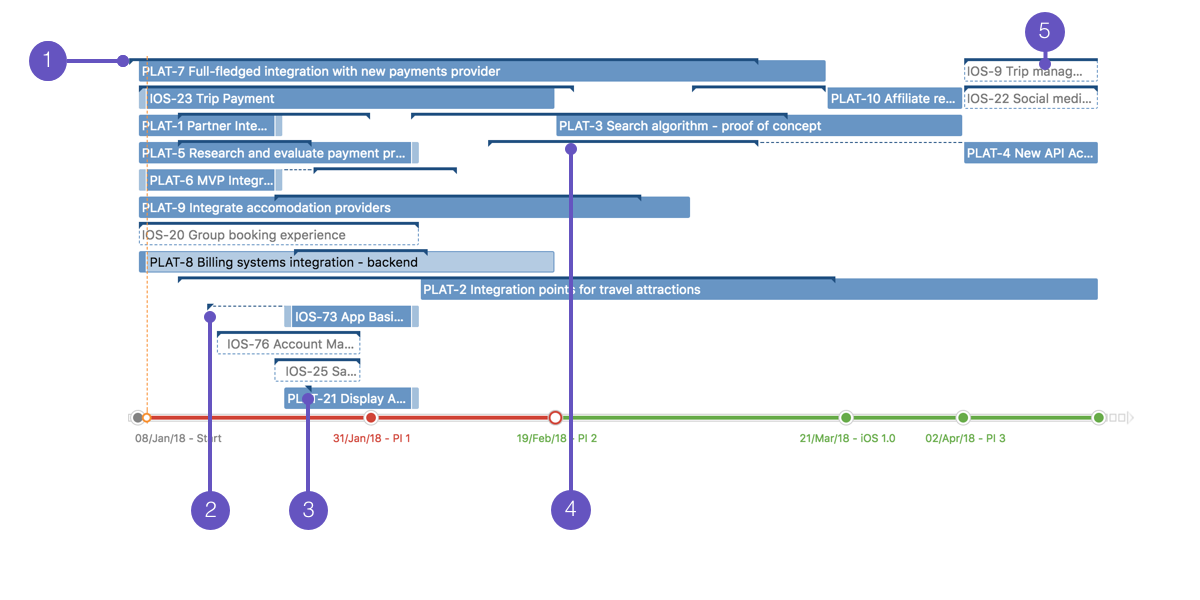
This section explains the key elements of the target schedule view. The target schedule view shows a visual roadmap of all the issues in your plan, any dependencies they may have, and the target dates that have to be set on issues. The target dates are set via target start and end dates that you can access from the scope table.
- Target dates indicator: A blue line above an issue indicating the target start and end dates for the issue.
Individual target start date indicator: A small individual triangle pointing to the left indicates only a target start date has been defined for the issue.
Individual target due date indicator: A small individual triangle pointing to the right indicates only a target due date date has been defined for the issue.
Target dates indicator for unscheduled issues: A white issue bar with the target dates indicator line on the top indicating an issue with target dates that can't be scheduled. This type of issue bar only occurs in the Target Schedule view and will show if one of the following scenarios arise:
- An issue has an estimate and a violation, such as a dependency violation.
- An issue has no estimate assigned to it and "Unestimated issue scheduling" is turned to "Off" in the plan's scheduling configuration.
- Target dates placeholder issue bar for an unscheduled issue: A white issue bar with the target dates indicator line. If you click an issue bar that has dependencies, the dependent issues will turn white on the schedule to highlight what they are. It's likely caused by the issue not being estimated, but as it's been assigned to a release, Portfolio creates the placeholder for the same duration of the release.
Capacity
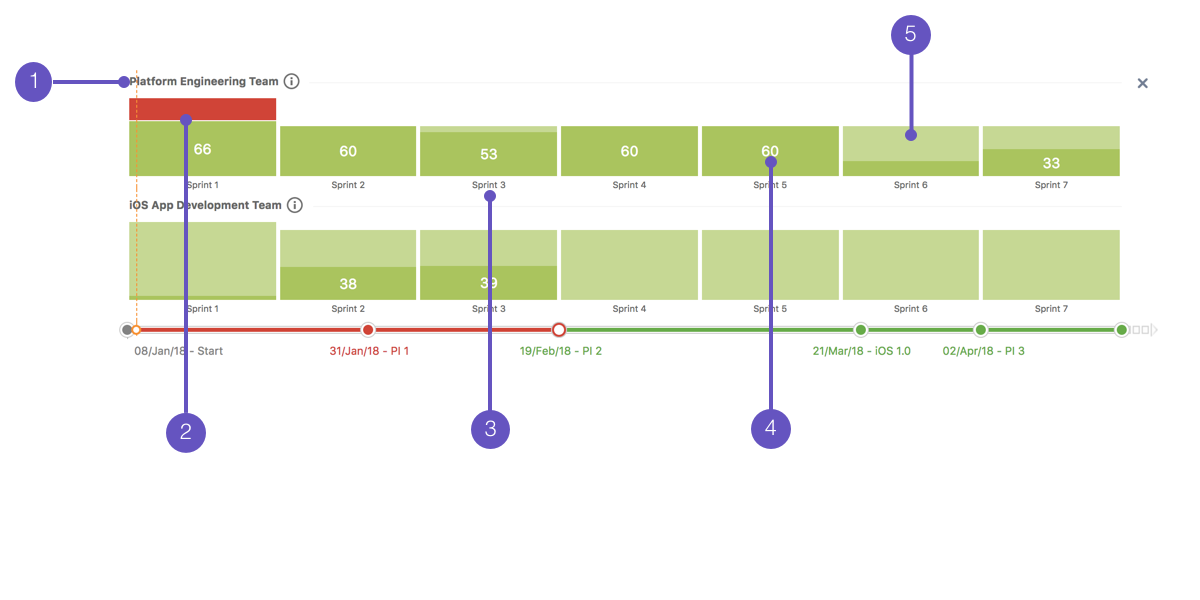
This section explains the key elements of the capacity view. The capacity view shows key capacity information for teams and team members on an iteration by iteration basis.
- Team name label: Name of the team the capacity view is referring to (will only show when viewing capacity view using "team " grouping set by the user in the capacity view settings).
- Overbooked capacity indicator: Indicates the overbooked capacity for the iteration. This is displayed in red on the capacity bar. Click anywhere on the capacity bar for an exact breakdown of planned capacity, free capacity, overbooked capacity, and capacity utilization.
Iteration name label: The name of the iteration the capacity bar relates to.
Numerical planned capacity indicator: Shows the amount of capacity planned for the iteration period. This value only appears when there's enough room on the capacity bar. Click anywhere on the bar for a breakdown of planned, free, and overbooked capacity, along with capacity utilization.
Free capacity indicator: Indicates the free capacity for the iteration. This is displayed in light green on the capacity bar. Click anywhere on the capacity bar for an exact breakdown of planned capacity, free capacity, overbooked capacity, and capacity utilization.


