Diagnostics for third-party apps
Overview
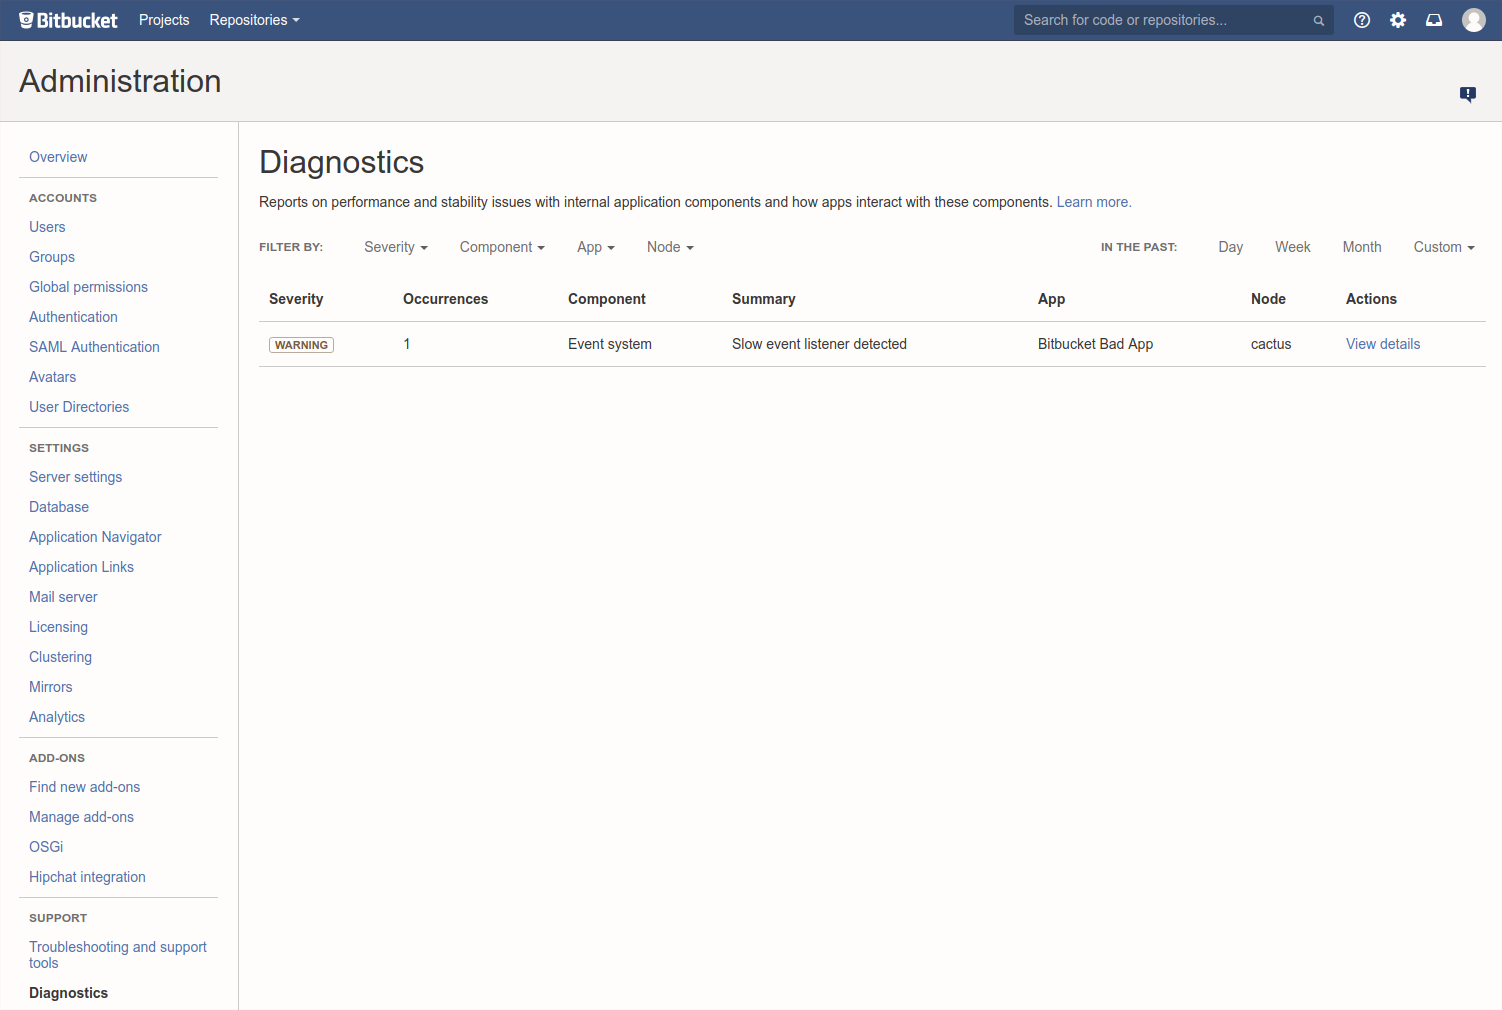
The diagnostics tool displays a summary of the alerts that have been raised on the instance in the past 30 days, grouped by issue and app combination.
There are three levels of severity:
- Error: a serious problem has occurred that impacts system stability and/or availability
- Warning: an issue has been detected that impacts performance or can lead to more serious problems in the future
- Info: something worth noting has happened.
The alerts can be filtered by severity, component, app, node and time.
Alert Details
The alert details page is accessed by clicking into an alert, and displays individual alerts for the selected issue and app combination.
When many alerts are raised in a short time window, just one representative alert is displayed per 1 minute window.
Clicking Show displays information relating to the issue, that was collected when the alert was raised.
You can also set up alerts using JMX metric details.


